

Archaeological pedestrian survey is characterized by regional scales of study, variable ecological conditions, and the need to record archaeological finds and environmental conditions in a standardized and consistent manner (Alcock and Cherry Reference Alcock, Cherry, Alcock and Cherry2004; Banning Reference Banning2002; Cherry Reference Cherry, Keller and Rupp1983; Fish and Kowalewski Reference Fish and Kowalewski1990; Francovich et al. Reference Francovich, Patterson and Barker2000). After surface materials are recorded, density and distribution maps are created to reveal artifact concentrations and allow interpretations of long-term changes in regional settlement patterns and land-use practices. In addition to environmental and anthropogenic processes, such as erosion and plowing, factors such as the weather, time of day, and the spacing of surveyors can greatly impact the quantity of materials recorded in a survey unit and the subsequent interpretations of the data (Banning et al. Reference Banning, Hawkins and Stewart2011; Verhoeven Reference Verhoeven, Voorips, Loving and Kamermans1991; Wandsnider and Camilli Reference Wandsnider and Camilli1992). Resurveying areas under varying conditions has resulted in dramatically different recovery rates, a phenomenon Lloyd and Barker (Reference Lloyd, Barker, Barker and Hodges1981:29) described as sites “turning on and off like traffic lights.”
Of the many factors that influence the recovery rates and representativeness of survey materials, one of the most influential is visibility, which refers to the clarity with which the ground surface can be seen by surveyors (Ammerman Reference Ammerman1995; Banning Reference Banning2002:46–48; Schiffer et al. Reference Schiffer, Sullivan and Klinger1978:6–8; Verhoeven Reference Verhoeven, Voorips, Loving and Kamermans1991). Visibility is often a property of ground cover and is recorded as a characteristic of the overall survey unit with bearing on all the materials found therein. As a result, visibility has long been a standard component of survey recording forms, with each unit given a score based on the ease with which surveyors were able to see the surface while surveying. Yet despite the central importance of this parameter for archaeological surveys worldwide, visibility is generally recognized as a subjective and inconsistent measure (Bevan and Conolly Reference Bevan and Conolly2006; Given Reference Given, Alcock and Cherry2004:16; Lock et al. Reference Lock, Bell, Lloyd, Gillings, Mattingly and van Dalen1999:59–60; Mattingly Reference Mattingly, Francovich, Patterson and Barker2000:10; Terrenato and Ammerman Reference Terrenato and Ammerman1996). The experience and perception of individual surveyors contribute to variable evaluations of visibility even in the same survey unit, whereas visibility conditions in an area may change drastically due to variable land cover and land-use practices. Even so, there is good evidence for a relationship between visibility and the quantity of artifacts counted, which, while variable and resulting from a variety of different factors, bears further investigation (Bevan and Conolly Reference Bevan and Conolly2013:48–50).
One means of exploring these relationships between recovered archaeological materials and visibility conditions is through high temporal resolution (HTR) satellite imagery. These data are characterized by frequent satellite revisits for image collection, allowing for the monitoring and study of phenomena at daily temporal resolutions. Such data may be provided by one constellation of satellites with identical imaging capabilities and parameters or by the aggregation of imagery from different earth observation platforms, which are likely to have more variable characteristics but may still contribute to continuous temporal coverage. While such data have not been widely applied in pedestrian survey (though see García Sánchez and Charro Lobato Reference García Sánchez and Lobato2018), they are utilized to monitor threats to cultural heritage from environmental effects (Agapiou Reference Agapiou2017; El-Behaedi and Ghoneim Reference El-Behaedi and Ghoneim2018; Elfadaly et al. Reference Elfadaly, Attia and Lasaponara2018; Goldberg et al. Reference Goldberg, Li, Goodman, Lindsey, Sjoberg and Sun2018; Plekhov and Levine Reference Plekhov and Levine2018) and from looting, conflict, and urbanization (Casana and Laugier Reference Casana and Laugier2017; Cuca and Hadjimitsis Reference Cuca and Hadjimitsis2017; Khalaf and Insoll Reference Khalaf and Insoll2019; Tapete and Cigna Reference Tapete and Cigna2018). Archaeological prospection has also benefited greatly from the availability of these data, allowing for the detection of seasonal and short-term changes in vegetation indicative of subsurface features (Agapiou et al. Reference Agapiou, Hadjimitsis, Sarris, Georgopoulos and Alexakis2013, Reference Agapiou, Alexakis, Sarris and Hadjimitsis2014; Calleja et al. Reference Calleja, Pagés, Díaz-Álvarez, Peón, Gutiérrez, Martín-Hernández, Relea, Melendi and Álvarez2018). As such data become increasingly available and accessible (Liu et al. Reference Liu, Di, Du and Wang2018), their unique applications in studying natural and anthropogenic processes at relatively short temporal scales warrant ongoing study (Opitz and Hermann Reference Opitz and Herrmann2018:23–24).
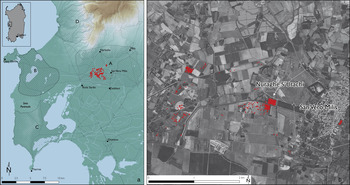
This article explores the application of HTR satellite imagery to pedestrian surveys and tests it as an additional evaluation tool for tracking visibility and land cover. Because visibility is profoundly affected by vegetation, developing methods that directly evaluate ground cover at the time of survey has relevance for interpreting survey visibilities and recovery rates and can contribute new insights into how surface assemblages are formed. The high spatial resolution (~3–10 m) of publicly available imagery allows for accurate measurements within the extents of survey areas, and its high temporal resolution is well equipped to monitor changes arising from dynamic agricultural cycles. With its near-global coverage, satellite imagery is appropriate for the regional scale of archaeological surveys. This study uses data collected during the summer of 2018 for the Sinis Archaeological Project, a regional survey currently conducting fieldwork in west-central Sardinia, Italy (Figure 1). We employ PlanetScope imagery (provided by Planet), which has a spatial resolution of approximately 3 m, four spectral bands (blue, green, red, near-infrared), and a daily revisit time (Planet Team Reference Team2017).
Map showing (A) area of study, with 2018 survey tracts marked in red, and (B) aerial image with dot-density distribution of ceramics collected from 2018 season (1 dot = 10 ceramics).

To investigate the utility of satellite imagery to visibility assessment, we use these data to calculate mean Normalized Difference Vegetation Index (NDVI) values for individual survey units and test whether there is a correlation between these values and field-recorded visibility scores. NDVI is a widely employed vegetation index frequently used to assess the relative health of vegetation as well as to distinguish vegetation from other land-cover types (Xue and Su Reference Xue and Su2017). Our expectation is that low NDVI values, corresponding to areas with little to no vegetation, will have higher visibility than areas with high NDVI values and dense vegetation.
We test this general relationship between NDVI values and visibility scores for all survey units, as well as for particular land-cover types (e.g., plowed, fallow, vineyard). Such differences in land-use practices can have significant effects on the formation of surface assemblages (Ammerman Reference Ammerman1995; Davis and Sutton Reference Davis and Sutton1995). For instance, the distinction between an abandoned fallow field and one that is fallow but used as a pasture is clearly important but can often be difficult to discern on the ground. HTR imagery allows us to parse out these distinctions through time-series analysis, which we can use to detect rapid changes in vegetation that indicate clearing, planting, or grazing.
The intention of this study is to complement, rather than replace, field-reported visibility scores in survey methodology and practice by providing a comparison with scores derived from remotely sensed imagery. Subjective and embodied field measurements are just as informative and essential to record, while communication with local farmers provides critical information about land use. Therefore, we do not propose these data as a solution to the problems of field reported visibility or as a replacement. Rather, we highlight some of the useful ways in which these data can be used in concert to provide a better understanding of how land cover and other environmental factors influence the results of pedestrian survey and contribute to interpretations of survey data.
VISIBILITY AND ARTIFACT RECOVERY IN REGIONAL ARCHAEOLOGICAL SURVEY
The earliest archaeological surveys took place in regions with naturally high visibility. Projects in coastal Peru (Willey Reference Willey1953), central Mexico (Sanders et al. Reference Sanders, Parsons and Santley1979), the American Southwest (Plog Reference Plog1974), and Mesopotamia (Adams Reference Adams1965) were successful due to the generally arid conditions that made surface finds and architectural remains highly visible and recordable. Those who adopted archaeological survey in more temperate regions quickly confronted issues of visibility arising from lusher vegetation and more variable ground cover (Ammerman Reference Ammerman1981:81–82). Surveys in such regions found that site and artifact counts were often orders of magnitude higher in areas that were recently plowed and free of surface cover and recent erosive events (Terrenato and Ammerman Reference Terrenato and Ammerman1996). These spatial patterns suggest that recovery rates were influenced less by the record of past human activities and more by conditions in the present (Allen Reference Allen and John Schofield1991; Ammerman Reference Ammerman1995; Bintliff Reference Bintliff, Boardman and Bell1992). This clear bias thus presented a serious challenge to the interpretations of survey projects, which—based on their systematic and intensive collection strategies—were meant to provide a fairly representative picture of human settlement and activity through time (Plog et al. Reference Plog, Plog, Wait and Schiffer1978). The need to record visibility conditions quickly became evident and was emphasized as a necessary component of in-field recording (Cherry Reference Cherry, Keller and Rupp1983:397–400).
Because visibility scores were associated with individual survey units, many projects explored quantitative and statistical approaches through modeling and empirical testing to correct survey results for visibility issues (Ammerman and Bonardi Reference Ammerman, Bonardi, Barker and Hodges1981; Banning et al. Reference Banning, Hawkins and Stewart2006; Bintliff Reference Bintliff, Bintliff, Kuna and Venclová2000; Bintliff et al. Reference Bintliff, Howard and Snodgrass1999; Tartaron et al. Reference Tartaron, Gregory, Pullen, Noller, Rothans, Rife, Tzortzopoulon-Gregory, Schon, Caraher, Pettegrew and Nakassis2006; Terrenato Reference Terrenato, Francovich, Patterson and Barker2000). These approaches assume that recovery rates would necessarily be higher in areas with greater visibility. The Keos Archaeological Survey, for example, noted that artifact concentrations tended to be higher in areas with higher visibility (Cherry et al. Reference Cherry, Davis and Mantzourane1991:42) with a strong correlation between the two (Terrenato and Ammerman Reference Terrenato and Ammerman1996:106). Though they did not specifically state it, these analyses demonstrated that once this linear relationship was sufficiently defined, artifact counts from units with poor visibility could be corrected to better match values expected under ideal visibility conditions.
Subsequent studies revealed, however, that the relationship between artifact recovery and visibility was far more complex. Barton and colleagues (Reference Barton, Bernabeu, Aura, Garcia and La Roca2002:168) found that recovery rates for some materials were actually higher in areas with poor visibility than in areas with high visibility. Likewise, Bevan and Conolly (Reference Bevan and Conolly2006) noted in the Kythera Archaeological Project that though artifact density increased with visibility, the correlation was extremely weak and had a considerable amount of variability. The Eastern Korinthia Archaeological Survey conducted a series of seeding experiments in 1999 and 2001 to evaluate the effects of field conditions on recovery methods (Schon Reference Schon2002; Tartaron et al. Reference Tartaron, Gregory, Pullen, Noller, Rothans, Rife, Tzortzopoulon-Gregory, Schon, Caraher, Pettegrew and Nakassis2006). Their experiments found that artifact recovery and relative visibility have a positive relationship, but one that is neither linear nor predictable. In other words, a field with 60% visibility may reveal more finds than a field with 30% visibility, but the difference is not necessarily twofold (Schon Reference Schon2000). Studies have also shown that increases in visibility do not necessarily provide more material, suggesting that low visibility is not always an obstacle to obtaining reliable results (Davis and Sutton Reference Davis and Sutton1995; Thompson Reference Thompson, Alcock and Cherry2004).
The Cecina Valley Survey also conducted a thorough analysis of the relationship between site count and areas with vegetation and recent erosion or sediment deposition. They found that areas recently plowed or harrowed had about seven times as many sites per square kilometer as areas with light or heavy vegetation and twice as many as expected, given the relative size of these vegetation-free areas to the rest of the survey area (Terrenato and Ammerman Reference Terrenato and Ammerman1996:99–101). Yet the high spatial variability in vegetation and geomorphology across the survey area resulted in a poor correlation between site counts and visibility and the determination that developing a predictive model likely would not be useful. As the authors noted (Terrenato and Ammerman Reference Terrenato and Ammerman1996:103–104), sites and artifacts are not found evenly distributed across the landscape. Consequently, areas with good visibility will not necessarily have high site counts, contributing to the high variance between visibility and recovery rates. Furthermore, assumptions that visibility biases, while problematic, are at least consistently impactful are also shown to be faulty as settlement patterns and land-use practices shift through time and vary across space (Ammerman Reference Ammerman1995:91; Bintliff and Snodgrass Reference Bintliff and Snodgrass1988).
Visibility remains a critical and pervasive obstacle for archaeological surveys. The ecological, geomorphological, and historical heterogeneity of surveyed landscapes results in considerable variance and, frequently, a lack of correlation between artifact recovery rates and evaluations of visibility. Nevertheless, the observational nature of archaeological survey necessitates that visibility be considered and recorded. As the studies mentioned above have shown, while the relationship between visibility and artifact recovery rates may be nonlinear, highly variable, and complex, one cannot deny that a relationship exists. What is necessary, therefore, is continued exploration and development of how to best utilize measures of visibility in understanding surface assemblages. Since the clarity with which the ground surface can be seen is a product of land cover, there is a fundamental connection between visibility and land-use practices (Ammerman Reference Ammerman1995). The dynamic nature of rural landscapes underscores the importance of considering the current state and the history of land use within each survey unit (Davis and Sutton Reference Davis and Sutton1995). Though current land use is often noted in survey forms, investigation of the relationships between these practices, visibility, and recovery rates is rarely carried out (though see, e.g., Casarotto et al. Reference Casarotto, Stek, Pelgrom, van Otterloo and Sevink2017; Tetford et al. Reference Tetford, Desloges and Nakassis2018; Van Leusen et al. Reference Van Leusen, Pizziolo and Sarti2011). What satellite remote-sensing data offer is the high spatial and temporal resolution necessary to investigate visibility and land cover at multiple scales, testing their effects and relationships on unit and regional scales.
CASE STUDY: THE SINIS ARCHAEOLOGICAL PROJECT (WEST-CENTRAL SARDINIA)
Our experiences working in the Upper Campidano of western Sardinia with the Sinis Archaeological Project (SAP) bear out many of the difficulties with visibility and artifact recovery described above and are comparable to those published by other surveys (Bevan and Conolly Reference Bevan and Conolly2006:127–128). Visibility was often variable within survey units, resulting in the need to agree on or average out the recorded visibility score for each unit as a whole. Geomorphological processes left large sections of our survey area relatively devoid of surface materials, resulting in many units with high visibility scores but low recovery rates. Likewise, areas with average visibility could have exceptionally high recovery rates (Figure 2). These experiences are common and well known in pedestrian surveys taking place today. For these reasons, we began using HTR satellite imagery as an additional tool for evaluating visibility and land cover during and after fieldwork. In the following sections, we summarize our study region and survey methodology before describing how we incorporated satellite imagery into our survey.
Artifact density plotted against field-recorded visibility scores.

Study Region, Project Aims, and Survey Methods
SAP is a diachronic regional survey initiated in 2018 in the west-central part of the western Mediterranean island of Sardinia (Figure 1). The survey area is situated in the Upper Campidano and neighboring coastal zones in and around the Sinis Peninsula, a varied landscape of plains, seasonal marshes and salt flats, rolling hills, and mountains. In antiquity, this part of the island was home to the Nuragic people who constructed monumental stone towers across the landscape in the Bronze and Iron Ages and, later, to foreign colonizers who came to exploit rich resources there, from metals to marine resources to obsidian to fertile soil. Over the course of the first millennium BC, Phoenicians, Carthaginians, and Romans came to Sardinia to found new settlements, annex territory, and exploit the island's agricultural landscapes and key resources from the mountains and coastal areas (Dyson and Rowland Reference Dyson, Rowland and Frizell1991, Reference Dyson and Rowland1992; Roppa and Van Dommelen Reference Roppa and van Dommelen2012; Stiglitz Reference Stiglitz2007; Van Dommelen Reference Van Dommelen1998; Webster Reference Webster2016; Wilson Reference Wilson and Evans2013:495–504; Zucca Reference Zucca2016). Our survey aims to understand the diverse social and environmental factors impacting landscape use, settlement patterns, and colonial interactions from prehistory to the present in this varied and dynamic landscape with a primary temporal focus on the first millennium BC through late antiquity—a period of intense colonization, interaction, and connectivity.
SAP's survey region encompasses four ecological zones, each of which will be a focus of pedestrian survey over the course of the project. These are areas where many archaeological sites have been excavated and well studied but where new landscape survey will help provide a more nuanced view of connections across these sites and of the territory as a whole. Zone A centers on the Nuraghe S'Urachi, the largest prehistoric tower complex of the region, located in an inland area of agricultural plains of the Upper Campidano (Stiglitz Reference Stiglitz2016; Stiglitz et al. Reference Stiglitz, Cusí, Ramis, Roppa and van Dommelen2015; Tore Reference Tore, Waldren, Chapman, Lewthwaite and Kennard1984a, Reference Tore and Anati1984b; Van Dommelen et al. Reference Van Dommelen, Cusí, Gosner, Hayne, Jorda, Ramis, Roppa and Stiglitz2018). Zone B is a coastal area west of Zone A and located on the northern extent of the Sinis Peninsula, containing dunes, marshes, and salt flats (Castangia Reference Castangia2012, Reference Castangia2013). Zone C is farther north in the Monte Ferru mountain range and its foothills, not far from the ancient city of Cornus (Blasetti Fantauzzi Reference Blasetti Fantauzzi and Ruggeri2015; Blasetti Fantauzzi and de Vincenzo Reference Blasetti Fantauzzi, De Vincenzo, Mattone and Cocco2016). Zone D is located in the southernmost part of the Sinis Peninsula in a coastal area with rolling hills and many nearby well-known archaeological sites, including the port city of Tharros and the indigenous site of Monte Prama (Tronchetti Reference Tronchetti and Balmuth1986, Reference Tronchetti1988; Zucca Reference Zucca1993). Our first two seasons of work, in 2018 and 2019, concentrated on Zone A with some preliminary investigations in Zone B. Future work will move into our other zones of interest (Sinis Archaeological Project 2019).
SAP uses a multiscalar methodology to assess these diverse landscapes: extensive regional reconnaissance, systematic pedestrian field survey, and intensive scatter-based collection. Our work during the 2018 field season focused on the intermediate scale and employed the intensive pedestrian survey techniques that traditionally have been used in Mediterranean survey (Alcock and Cherry Reference Alcock, Cherry, Alcock and Cherry2004; Cherry Reference Cherry, Keller and Rupp1983). Teams of six to eight people traversed units along transects spaced 10 m apart with units roughly conforming to existing field boundaries and measuring, on average, about 6,000 m2. Each fieldwalker was responsible for counting and collecting artifacts and noting features within 1 m on either side, resulting in 20% coverage of the survey areas walked. For each survey unit, the team leader provided a description and sketch of the field and recorded the field condition, land cover, visibility, weather conditions, and quantities of artifacts discovered by each fieldwalker. Diagnostic ceramics, lithics, and other significant artifacts were collected for study in the laboratory. All this information was input into the project database, which was then linked to the GIS data collected for the boundaries of every survey unit and the transects of each fieldwalker.
In this article, we focus exclusively on data from our fieldwork conducted in 2018 in Zone A, where environmental conditions are ideal for pedestrian survey because of the prevalence of agriculture, and therefore frequent plowing, across the zone. The region's most common crop is wheat, which is planted in large farm plots. Olive groves, vineyards, mixed orchards, and vegetable gardens are also abundant and usually are planted in smaller plots. Some fallow fields are also used as pastures for sheep, cows, horses, and donkeys. This landscape, then, provides a good test case for the applicability of satellite imagery to archaeological survey because it is the type of Mediterranean landscape typically targeted for pedestrian surveys. In 2019, we focused surveys on the agricultural fields surrounding the Nuraghe S'Urachi, where we previously completed a survey and where ongoing excavations are taking place (Gosner and Smith Reference Gosner and Smith2018; Stiglitz et al. Reference Stiglitz, Cusí, Ramis, Roppa and van Dommelen2015; Van Dommelen et al. Reference Van Dommelen, Cusí, Gosner, Hayne, Jorda, Ramis, Roppa and Stiglitz2018).
The team surveyed 223 units covering 1.31 km2. For each of these survey units, an overall visibility score was established by averaging visibility numbers from each fieldwalker. This was combined with land-cover information to better understand how day-to-day agricultural practices affect archaeological preservation, surface visibility, and the recorded density of artifacts present on the surface. To this end, we recorded not only the type of crops that were planted within each field (wheat, grape vines, olives, vegetables, etc.) but also the stage or status of the field in the agricultural cycle. For wheat fields, this ranged from plowed to harvested (a catch-all category used in 2018 for cut and threshed wheat with straw and chaff remaining on the ground or baled) to fallow. Each of these agricultural stages resulted in different ground visibility levels for fieldwalkers. Noting the potential for satellite imagery to distinguish these stages, we set out to determine whether NDVI values corresponded to visibility scores recorded at the time of pedestrian survey.
HTR Satellite Imagery for Visibility Assessment: Methods of Analysis
As discussed, the methodology employed by SAP is based on survey design and recording protocols that are fairly standard on most archaeological survey projects. Each survey unit (SU) is recorded with at least four GPS points along the borders of the SU, allowing for the creation of polygons that cover the areal extent of the unit. These spatial data are linked to attributes in the database that record parameters such as visibility, date surveyed, land cover, and the total number of recorded finds for various material types (e.g., ceramics, lithics, plastics).
To test the utility of HTR satellite imagery for visibility assessment, we employed data provided by Planet and their PlanetScope constellation of approximately 150 Dove satellites (Planet Team Reference Team2017). These satellites provide global coverage with a daily revisit time, collecting imagery with a resolution of approximately 3 m and in four spectral bands (blue, green, red, near-infrared). Each PlanetScope satellite is a miniaturized (30 × 10 × 10 cm) CubeSat 3 U satellite that is capable of imaging approximately 24.6 × 16.4 km per frame, operating in either sun-synchronous or ISS orbits. Once collected, imagery is provided in various formats and processing levels (e.g., at-sensor radiance, radiometrically calibrated, orthorectified), depending on the user's needs. We used the PSScene4Band product, which is orthorectified and projected to the Universal Transverse Mercator (UTM) coordinate system. This product is provided with top-of-atmosphere (TOA) radiometrically corrected data as well as a bottom-of-atmosphere (BOA) surface reflectance product generated using look-up table values retrieved from MODIS near-real-time (NRT) data (Planet Team Reference Team2017). We employ the surface reflectance data for this study to increase the comparability of imagery collected on different days that would otherwise differ based on atmospheric conditions at the time of collection.
These data are freely accessible through Planet's generous Education and Research Program, which provides limited, noncommercial access to 10,000 km2 per month of PlanetScope imagery for university-affiliated researchers. Imagery is often available for download within 24 hours of collection, providing quick and easy access to relevant imagery, provided that internet availability is sufficient in the field. Planet data may be downloaded through Planet's Explorer tool (https://www.planet.com/explorer), which allows users to view the data and manually modify parameters.
Using the total spatial extent of the SUs, we requested Planet imagery that overlapped our survey area and was acquired during the month of June 2018, when we conducted our survey. Further parameters used to filter the imagery include the amounts of overlap (how much of the selected images should overlap the extent) and cloud cover. Though imagery was available for almost every day of the survey period, in the end, we selected nine images that were sufficiently free of cloud cover (see supplemental material for image IDs used in this study). These images provided fairly complete coverage of the survey period, as each day of fieldwalking was no more than three days removed from an available image.
After downloading the surface reflectance product, we calculated NDVI values for each image. NDVI values range from −1 to 1 and are calculated as a ratio of the red (R) and near-infrared (NIR) bands: (NIR-R)/(NIR + R). Pixels showing relatively healthy vegetation will often have values between 0.3 and 0.8, whereas areas that are barren, paved, or covered in water will have lower values. NDVI is thus a reliable and fairly consistent method for distinguishing different land-cover types with the sensitivity to detect and distinguish changes in vegetation. While other vegetation indexes can be used in archaeological and environmental studies that may be better suited to particular environmental conditions or objectives (see Agapiou et al. Reference Agapiou, Hadjimitsis and Alexakis2012 for review), NDVI remains the most standard and straightforward vegetation index and is therefore utilized by the SAP team to assess field visibility and as a metric for this study.
With NDVI values calculated for each image, we then iterated through each SU, extracting NDVI values for each SU polygon from the image closest in date to when that SU was surveyed. These values were then averaged, providing a single NDVI score for each SU. We then tested for correlations between NDVI values and reported visibility scores, including the visibility score reported by survey walkers in general and the association of this score with different types of land cover. Though previous studies have shown that there is a poor correlation between visibility and artifact count, we also compared the relationship between NDVI and density to field reported visibility at both the unit and transect levels. Visibility is rarely recorded at the transect level, often for the sake of expediency, but is easy to do with satellite data by extracting values from digitized transect lines. Artifact density was calculated using ceramic counts (count/sq m). Though SAP collected lithics, bone, and a variety of other material types, ceramics were by far the most numerous and, thus, served as the basis for density evaluation.
Finally, we created a time series stack of all available NDVI imagery covering the temporal span of the 2018 season, and we calculated standard deviations to highlight areas that experienced relatively substantial changes in vegetation. In the next section, we consider the information this provides about the dynamic agricultural cycle in the region, and we show how these time-series data allow us to identify recent changes to fields of otherwise similar land cover and visibility. Ultimately, this information can be used in planning when and where to survey (or resurvey) areas of SAP's study region. The full processing and analysis procedures are provided as an R Markdown file (R Core Team 2019) in the supplementary material, allowing readers to input data and test this approach for their survey projects.
Visibility Assessment Results
The application of NDVI values to assessing variable visibility resulted in mixed but promising results. Plotting mean NDVI values for SUs against their respective visibility scores shows the predicted negative relationship, with visibility increasing as NDVI values decrease (Figure 3). Despite this negative relationship, the coefficient of determination calculated from the linear regression is very low (R 2 = 0.08). Such a low value indicates that a large proportion of the variance in the dependent variable (visibility scores) is not predicted by the independent variable (NDVI value). In short, there is considerable variability in the data. This variability is demonstrated more clearly when we consider the land-cover types of each unit, represented in Figure 3 by different colors. We can see that vineyards and groves generally have higher NDVI values than expected from visibility scores, while plowed areas tend to have lower NDVI values. Harvested and fallow areas tend to also have lower NDVI values than expected, though there is considerable variance here as well, as seen in the residuals for each land-cover type (Table 1). These patterns conceptually make sense, as NDVI is particularly sensitive to the presence or absence of vegetation. Where vegetation is present, NDVI values are likely to predict lower visibility than fieldwalkers, who can more easily see through vegetation.
NDVI values for each SU plotted against their respective visibility scores. Data points are color coded according to their land-cover type.

Root Mean Square Error (RMSE) by Land-Cover Type.

Another way of visualizing these differences and relating them to visibility scores is to look at the distribution of NDVI values according to land cover (Figure 4a). Here we see that vineyards and groves have similar NDVI distributions, whereas their field-reported visibility score ranges are more divergent (Figure 4b). The similarity in NDVI values between groves and vineyards is likely due to the 3 m resolution of the imagery, which fails to detect the exposed soil between vine rows and therefore provides similar values to groves. On the ground, however, vineyards often have exposed soil between rows of vines that provides good if not excellent visibility, whereas tree groves and orchards have more variable ground cover, as seen in the wider distribution of visibility scores. Tree canopies will also mask any exposed soil when viewed from above, regardless of spatial resolution.
Distribution of NDVI and visibility scores according to land-cover types.

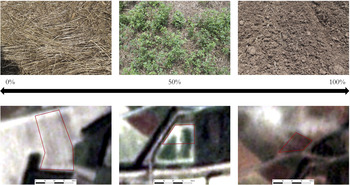
On the other hand, the reason harvested areas have NDVI values that are close to NDVI values in plowed areas has more to do with the actual spectral properties of recently cut and dead vegetation. Both appear as brownish-yellow on satellite imagery, whereas on the ground, their differences are more apparent (Figure 5). As a result, NDVI values for harvested areas have a far smaller range than visibility scores, which are more divergent for harvested areas and fairly distinct from plowed areas. For fallow areas, both visibility scores and NDVI values have wide distributions. In both cases, however, fallow areas represent the worst visibility conditions (highest NDVI values and lowest visibility scores).
Comparison of ground cover photos and satellite imagery for different visibility scores.

Thus, there are some parallels between NDVI values and visibility scores. When the data are grouped according to land-cover classes and we again test the relationship between NDVI values and visibility scores, we obtain strong correlations for plowed, vineyard, and grove areas but not for harvested and fallow (Table 2). The reason for this distinction may be due in part to the far greater number of units that were classified as harvested or fallow. Both these types contain more units than plowed, vineyard, and grove areas combined and therefore are likely to contain more variability. Yet the distinction is also likely due to the clear spectral signatures and consistent visibility of plowed areas. Vineyards and grove areas also have consistent spectral signatures, and at least in our case, vineyards also had fairly consistent visibility scores. Therefore, the challenge for applying this methodology to pedestrian survey is in harvested and fallow areas, where the spatial and spectral resolution of satellite imagery cannot achieve the clarity that surveyors in the field can.
R2 Values for Relationship between Visibility Scores and NDVI Values, by Land Cover.

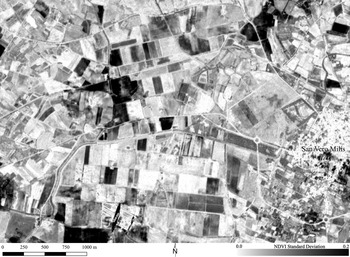
At the regional scale, however, HTR imagery clearly identified areas of recent land-cover change (Figure 6). Using these data, we determined the longevity of field conditions, such as recent or long-term fallow. These data demonstrate how quickly and profoundly field conditions can change, whether through vegetation regrowth or from clearing (Figure 7). This is useful information for understanding whether materials found in a survey unit are recently exposed or have been on the surface for prolonged periods. Artifacts that have been exposed for a long period of time are more likely to be transported by surface processes, which can move artifacts considerable distances across the landscape (Tetford et al. Reference Tetford, Desloges and Nakassis2018). Therefore, distinguishing a recently plowed field from one that has remained so for several weeks, as was common throughout our survey area, can be important when interpreting artifact densities and concentrations.
Map showing standard deviation of NDVI values indicative of land-cover changes.

Time series NDVI plot of seven units classified as harvested. Units represented by the red lines were surveyed on June 12, immediately before being cleared and replanted. Units represented by the black lines were surveyed on June 17, more than two weeks after being cut.

This temporal resolution was useful in planning where and when to walk different parts of our survey area. Although we had limited access to high-speed internet connections in the field, we were able to acquire imagery once or twice per week, which allowed us to effectively monitor changes in the landscape. We integrated this information with our field observations and drew on conversations with local farmers to strategically target areas to survey each day. For instance, newly planted fields could be avoided to prevent fieldwalkers from damaging delicate crops. Recently cut or plowed areas, where many contiguous fields could be quickly and easily surveyed, were readily identifiable. Likewise, fields inaccessible because of high growth or impenetrable fallow vegetation could be avoided. While our goal was to achieve full coverage of the survey area, this was not always practical or possible, so using the imagery helped us achieve faster coverage of more area than if we had simply driven to a randomly selected unsurveyed area each day.
Finally, we explored whether NDVI values were a better predictor of artifact densities than visibility scores. In brief, at the unit scale, NDVI is not a good predictor of artifact densities (R 2 = 0.01; p = 0.58). At the transect level, the relationship between recorded densities and NDVI values was slightly better though still weak (R 2 = 0.04; p < 0.001). Thus, while the use of satellite imagery and NDVI analysis may be useful for survey planning and post hoc analysis of visibility conditions and land-use typologies, as yet, it is no more sufficient for predicting artifact densities than conventional visibility scores.
CONCLUSIONS AND FUTURE DIRECTIONS
The relationship between vegetation and field-reported visibility has long been evident to all who have participated in pedestrian survey. While the effect of visibility on artifact recovery rates remains difficult to quantify, our results and those of other projects show that artifact recovery is generally higher in areas with better visibility. Developing new methods to measure visibility and assess its relationship with land-use practices and changes resulting from the agricultural cycle can provide a better understanding of surface assemblages and generate new interpretations of survey data. To this end, the availability of HTR satellite imagery offers many useful avenues for further research, some of which we hope to have demonstrated here.
Of these, the ability to monitor daily changes on the landscape at a regional scale greatly contributed to our understanding of local agricultural production and allowed us to more effectively plan our survey of the area. These near-daily time-series data also allowed us to evaluate how recently surveyed units had undergone changes, giving us additional confidence in the representativeness of our finds and allowing us to further differentiate areas of similar land-cover classes for interpretation and future prospection. As mentioned above, we do not feel that these data can replace the observations we make on the ground or the necessity of communicating with local farmers and landowners. Using HTR satellite imagery did not diminish the importance of these other forms of data collection; rather, it complemented them and provided us with more spatial and temporal scales at which to study the region.
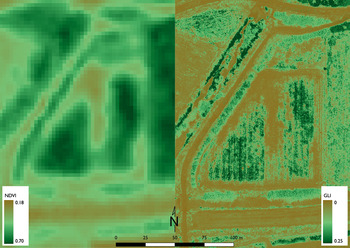
Indeed, the results of our comparison of field-recorded visibility scores and NDVI values shows that at its current spatial and spectral resolutions, HTR satellite imagery generally provides, at best, a rough proxy for visibility. For land-cover classes such as plowed areas, these data fare better and can be used to differentiate plowed areas from fallow or recently cut fields. Ultimately, there is no strong correlation of NDVI values to either field visibility or land use, nor is the resolution that is currently available effective in determining the percentage of ground cover visible at a scale comparable to that of the individual surveyor. One way of bridging this gap in resolution is through unmanned aerial vehicles (UAVs) that can be effectively employed to provide the necessary spatial resolution to monitor vegetation at the time of survey and even map the surface materials (Orengo and Garcia-Molsosa Reference Orengo and Garcia-Molsosa2019). Though we do not present these data here, our preliminary exploration of this approach shows that the resolution of low-altitude photography and photogrammetry is sufficient for capturing minute variations in surface vegetation (Figure 8). As multispectral and thermal cameras become increasingly available for UAV-based photography (Casana et al. Reference Casana, Wiewel, Cool, Hill, Fisher and Laugier2017; McLeester et al. Reference McLeester, Casana, Schurr, Hill and Wheeler2018), these data are likely to become more common. UAVs are already successfully used for high-resolution mapping of agricultural fields and precise analyses that can differentiate crop varieties (Avola et al. Reference Avola, Di Gennaro, Cantini, Riggi, Muratore, Tornambè and Matese2019), promising exciting potential for more complex land-cover mapping in the future. However, the fairly short flight times of UAVs and the time necessary to create high-resolution orthophotos prevented us from using them to map every survey unit. With multiple teams operating over a large region, such mapping is currently impractical within the scale of regional pedestrian surveys. Furthermore, while the spatial resolution of this imagery may be more effective for evaluating vegetation at the time of survey, such synchronic data does not permit the time-series analysis that satellite imagery allows.
Left: PlanetScope image. Right: Green Leaf Index (GLI) orthophoto generated by UAV. GLI is calculated as (2 × G-R-B)/(2 × G + R + B) (Louhaichi et al. Reference Louhaichi, Borman and Johnson2001). Both images collected on June 16, 2018.

While other sources of HTR satellite imagery, such as the Sentinel missions (10 m resolution), are available (García Sánchez and Charro Lobato Reference García Sánchez and Lobato2018), the spatial resolution provided by these satellites is lower than Planet data. On the other hand, the Sentinel-2 sensor has 12 spectral bands that allow for more advanced spectral analysis and the calculation of more complex vegetation indexes (Agapiou et al. Reference Agapiou, Alexakis, Sarris and Hadjimitsis2014; Tapete and Cigna Reference Tapete and Cigna2018). Which datasets and combinations will be most productive will depend on the research questions and circumstances of individual projects, but the increasing availability and accessibility of these data encourages us to continue experimenting with them and exploring their applications (Cuca and Hadjimitsis Reference Cuca and Hadjimitsis2017).
What are needed therefore are further applications of these approaches in different regions and environmental contexts. The approach outlined here will not be applicable in all circumstances. The same arid conditions that make visibility so high for surveys in some parts of the world would also limit the effectiveness of this approach for approximating visibility due to the general scarcity of vegetation. However, the benefits of HTR imagery for monitoring environmental change and evaluating conditions at the time of survey make it a useful tool to add to archaeological survey methodology and design. At a minimum, it is an effective first step for remotely analyzing field visibility at the regional level and, ultimately, it has great potential for increasing our understanding of surveyed landscapes and distinguishing biases of the present from the historical patterns of the past.
Supplemental Material
For supplemental material accompanying this article, visit https://doi.org/10.1017/aap.2020.1.
Supplemental Table 1. Table showing images used in this study and their dates of collection.
Supplemental Text 1. R Markdown script detailing analyses, showing how figures were created and values calculated.
Acknowledgments
We are grateful to Peter van Dommelen and Alfonso Stiglitz for their logistical and intellectual support. Thank you to Alessandro Usai and Maura Vargiu of the Soprintendenza archeologia, belle arti e paesaggio per la città metropolitana di Cagliari e le province di Oristano e Sud Sardegna for granting us permission to carry out our work. We also thank the following 2018 field team members: Andrew Crocker, Michael Garth, Kelly Miklas, and Seth Price. Emanuele Madrigali, Andrea Roppa, and Jeremy Hayne assisted with materials analyses. The Sinis Archaeological Project is affiliated with the Museo Civico di San Vero Milis and the University of Michigan, Ann Arbor. We are indebted to our 2018/2019 sponsors: the Rust Family Foundation (RFF-2018-54), the Curtiss T. Brennan and Mary G. Brennan Foundation, the Loeb Classical Library Foundation, the Julie Herzig Desnick Endowment Fund for Archaeological Field Surveys (Archaeological Institute of America), and the DigitalGlobe Foundation. We thank Planet's generous Education and Research Program for access to satellite imagery. We also thank John Cherry for his helpful comments on earlier drafts of this paper and the two anonymous reviewers for their valuable feedback and suggestions.
Data Availability Statement
Planet Imagery can be obtained through Planet's Explorer tool (https://www.planet.com/explorer), with access provided by Planet's Education and Research Program (https://www.planet.com/markets/education-and-research/). Images and associated IDs used in this analysis are provided in Supplemental Table 1. Data pertaining to Sinis Archaeological Project survey tracts, transects, and counts, as well as other supplemental materials, can be found at https://osf.io/yehvm/.