

Scholars have long debated determinants of mass mobilization in non-democracies (for an overview, see Chenoweth and Ulfedler Reference Chenoweth and Ulfelder2017). A dominant perspective in contentious politics literature is that political opportunity structure – that is, certain dimensions of the political environment – affects the level of protest activity (Meyer Reference Meyer2004; Osa and Corduneanu-Huci Reference Osa and Corduneanu-Huci2003). Graeme Robertson (Reference Robertson2011), for example, posits that intra-elite political competition was a key driver of subnational variation in the intensity of labour strikes in Russia. Another argument is that grievances breed social unrest (Gurr Reference Gurr1970; Thomson Reference Thomson2018). Gary Tang (Reference Tang2015), for instance, observes that public outrage over the police use of tear gas fuelled citizens' participation in the Umbrella Movement in Hong Kong. Others claim that the development of formal and informal social networks, including labour unions and social media, influence the level of protest engagement (Chrona and Bee Reference Chrona and Bee2017; Metzger and Tucker Reference Metzger and Tucker2017; White and McAllister Reference White and McAllister2014). Dina Bishara (Reference Bishara2018), for example, traces how labour organizations in Egypt mobilized citizens against the authoritarian government. Although rich scholarship has investigated the relative importance of political and socioeconomic factors, far less attention has focused on the role of university students.
There are conflicting theoretical expectations regarding students' protest behaviour in contemporary autocracies. On the one hand, consistent with a resource model of political participation (Brady et al. Reference Brady, Verba and Schlozman1995), university students are more likely than their peers without higher education to get involved in protests because the former tend to possess a greater amount of political knowledge, develop a wider range of social networks and be more structurally available for protest action. On the other hand, university students in autocracies might refrain from high-risk activism in exchange for their own financial well-being and career advancement (Mickiewicz Reference Mickiewicz2014; Ong and Han Reference Ong and Han2019). The important question remains whether students in non-democracies will rise en masse to demand political change.
Using an original data set of protests in Russian cities, this article examines the relationship between the size of anti-government protests and student population in an authoritarian regime. In March 2017, thousands of people across the Russian Federation joined anti-corruption rallies organized by Alexei Navalny, a prominent opposition politician and founder of the Anti-Corruption Foundation. Based upon a city-level analysis of protest events, the study finds that anti-corruption protests were larger in cities with a larger university student population. Next, employing individual-level data from the fifth wave of the European Values Survey (EVS), the article shows that university students expressed greater interest in politics and participated in demonstrations at a higher rate than non-students of the same age. These findings highlight the significance of students for mass mobilization in an autocracy. First, university students can numerically increase the size of protests by virtue of their own engagement in a protest event. Second, university students can amplify the level of mass mobilization by stimulating political action by other strata of society. In line with a bottom-up model of political socialization (McDevitt Reference McDevitt2006), some adults might get involved in civil resistance as a result of their children's activism. Russian women, for example, launched the civic initiative Mothers against Political Repression and organized pickets, marches and hunger strikes in support of political prisoners, including jailed students (Kagermazov Reference Kagermazov2019). This study represents one of the first attempts to empirically interrogate the relationship between the protest size and student population in Russia under Vladimir Putin's presidency.
In addition, the article makes an empirical contribution to comparative politics literature by analysing subnational variation in mass protests with an anti-corruption agenda. Prolific research documents that corruption is an endemic problem in non-democracies (Ledeneva Reference Ledeneva2013; Sun Reference Sun1999). Given the pervasiveness of corruption, protests against a flagrant abuse of power can attract a wide range of constituencies and erode the government's legitimacy. For example, research shows that grassroots mobilization in Russian cities was predominantly driven by such bread-and-butter issues as infill construction (uplotnitelnaia zastroika), road conditions and the inadequate provision of municipal services (Kleman Reference Kleman, Erpyleva and Magun2015; Semenov Reference Semenov2019). However, patterns of anti-corruption protests in non-democracies have been underexplored in comparative politics literature. A closer analysis of anti-corruption mobilization can shed some light on the odds of political stability in corruption-ridden autocracies.
The remainder of the article is structured as follows. The next section briefly discusses extant research on the role of students in repressive political regimes. The article then provides background information on the 2017 anti-corruption protests, describes data sources and the measurement of key variables. The empirical analysis proceeds in two steps. It first analyses the relationship between protest size and university student population, employing city-level data. Next, it uses individual-level data from the EVS to gauge the likelihood of students' participation in protests. The concluding section spells out implications of these findings and identifies avenues for future research.
Student activism in repressive political regimes
Student activism has long proven to be a powerful social force worldwide (Altbach Reference Altbach1989; Boren Reference Boren2019). The 1973 student uprising at the National Technical University (Polytechneio), for example, contributed to the collapse of the military junta in Greece (Psacharopoulos and Kazamias Reference Psacharopoulos and Kazamias1980). The student movement also played an important role in communist Poland in 1980–81 (Junes Reference Junes2015; Wejnert Reference Wejnert1988). Likewise, rich interdisciplinary literature documents the significance of the 1989 student protests in the People's Republic of China (Calhoun Reference Calhoun1997; Cunningham Reference Cunningham2014). Recent research uncovers how Hong Kong students revolted against the government's encroachment on their political freedoms (Macfarlane Reference Macfarlane and Brooks2016; Wasserstrom Reference Wasserstrom, Ma and Cheng2019). Nonetheless, there are conflicting claims about the role of students in contemporary autocracies.
Conventional wisdom holds that students in non-democracies are well poised to act as agents of political change. There are several reasons why students are prone to revolt against the regime. First, prior research shows that students tend to exhibit higher levels of interest in politics and political awareness (Rich Reference Rich1980). Second, students tend to be embedded in multiple formal and informal social networks (Crossley Reference Crossley2008), which facilitates their mobilization in favour of a cause. Third, students are, on average, more available than full-time employees to engage in contentious collective action due to fewer family obligations or employment responsibilities (Wiltfang and McAdam Reference Wiltfang and McAdam1991). Consistent with this perspective, Sirianne Dahlum and Tore Wig (Reference Dahlum and Wig2021) demonstrate that, in Africa and Central America, localities with a university are more prone to protest.
Yet, recent literature on the state-dependent middle class casts doubt over the transformative power of college-educated youth in contemporary autocracies. Contrary to classic modernization theory (Lipset Reference Lipset1959), scholars of Russian politics find that the middle class whose financial well-being depends on state employment is less supportive of regime change than those employed in the private sector (Gontmakher and Ross Reference Gontmakher and Ross2015; Rosenfeld Reference Rosenfeld2017). The state-dependent middle class comprises a sizeable portion of the population in the former Soviet republic. According to some estimates, state employment accounts for nearly 50% of formal employment in contemporary Russia (Di Bella et al. Reference Di Bella, Dynnikova and Slavov2019). Specifically, the lion's share of employees in the education sector fall into the category of the state-dependent middle class, which increases pressures for university students to conform politically.
In view of the government's extensive use of co-optation and repression, most university students in an autocracy might acquiesce to the political order in exchange for the pursuit of their economic interests and advancement of their careers in the public sector. Empirical evidence suggests that university students tend to place a high value on their career trajectory. Scholars, for example, find that today's university students in China seek to join the Chinese Communist Party primarily out of pragmatic concerns for career advancement, rather than a deep-seated commitment to state ideology (Dickson Reference Dickson2014; Guo Reference Guo2005). Likewise, research reveals that the pro-regime youth movement Nashi (Ours) attracted swathes of Russian youth, including a mix of civic-minded and career-oriented university students, in the mid-2000s (Hemment Reference Hemment2015; Miinssen Reference Miinssen2014). Based upon focus group discussions with Russian students at three elite universities in April 2011, Ellen Mickiewicz (Reference Mickiewicz2014) concludes that most students are very wary of the detrimental effects that protest participation might have on their careers and shy away from high-risk activism. Similarly, career-related risks weigh heavily on the calculus of protesting in urban China (Ong and Han Reference Ong and Han2019).
The article contributes to a major debate in comparative politics literature on determinants of mass mobilization and in particular the role of university students in a non-democratic setting by analysing the relationship between the protest size and university students in Russian cities. Unlike Ruben Enikopolov, Alexey Makarin and Maria Petrova's (Reference Enikolopov, Makarin and Petrova2020) research, using the presence of universities as a control variable and focusing on the relationship between social media and protest participation, this article places students at the centre of the empirical analysis. Given the growth of a sizeable state-dependent middle class, the case of Russia presents a ‘hard test’ for evaluating the linkage between higher education and protest engagement.
The 2017 anti-corruption protests in Russia
Navalny has become one of the most influential opposition politicians and fiercest critics of corruption in Putin's Russia, using social media as a platform to articulate his political views (Dollbaum et al. Reference Dollbaum, Lallouet and Noble2021). In spring 2017, Navalny posted a slick video exposing the abuse of power by Russian Prime Minister Dmitry Medvedev and illustrating the ruling elite's extravagant lifestyle. This video, aptly titled ‘He Is Not Dimon to You’,Footnote 1 received more than 15 million views on YouTube and caused public outrage (Orekhanov Reference Orekhanov2017). Thousands of people across Russia responded to Navalny's call for action and took to the streets on 26 March 2017 (Milov Reference Milov2017; Novosti Vladivostoka 2017).
A hallmark of the 2017 anti-government protests was the visible presence of university and even high-school students (Balmforth Reference Balmforth2017). Students turned out, carrying humour-infused protest signs and yellow rubber ducks.Footnote 2 Local media, for example, reported that a considerable number of students joined the protest event and spoke out against corruption in the city of Vladimir (Golovinov Reference Golovinov2017). Similarly, according to an eyewitness account from the city of Perm, ‘What was especially surprising was the fact that near the monument to the Heroes of the Frontline and the Home Front gathered not professional revolutionaries and representatives of the opposition (though they were also present), but ordinary university students and even high-school students who had become fed up with the ruling elite (vlast’) and today's Russia’ (quoted in Churilova Reference Churilova2017). Yet, despite an abundance of anecdotal evidence, there is virtually no quantitative analysis of the impact of university students on the size of anti-corruption protests.
Research preceding the 2017 protests indicates that corruption has become a salient issue among university students (Denisova-Schmidt et al. Reference Denisova-Schmidt, Huber and Leontyeva2016). When prompted to name a top problem in contemporary Russia, 42% of students surveyed in the Republic of Tatarstan in 2014 mentioned grand corruption (Morozova Reference Morozova2015: 128). Furthermore, university students believed that the magnitude of corruption had been growing in Russia since the start of Putin's first presidential term (Goloborodko et al. Reference Goloborodko, Okulich-Kazarin and Timaev2018). It was unclear, however, whether Russian students would act upon their grievances and take to the streets.
Meanwhile, the Russian government took pre-emptive measures to suppress student activism. A flurry of lectures and ‘informal conversations’ with student activists were held on the eve of anti-corruption protests. Moreover, students were pressured into attending alternative state-sponsored events or staying at home on the day of the protest event. Youth Guard (Molodaya gvardiya), the youth wing of United Russia, for example, held an alternative rally in Khabarovsk to display their disapproval of Navalny's political agenda (Vostok Media 2017). University students were not only joiners, but also organizers of anti-corruption rallies. For this reason, several student activists were threatened with expulsion from university. In Komsomolsk-na-Amure, for example, the university administration pressured students to withdraw their application for an official permit for the protest event within a few hours after the submission of the application, revealing a close collaboration between the coercive apparatus and university management (Sherstobitova Reference Sherstobitova2017). Taken as a whole, the government's deployment of repressive measures suggests that state authorities considered student activism as a potential threat to the regime.
Data and measures
The Russian Federation provides an ideal setting for analysing subnational variation in mobilization because it is one of the largest countries in the world, with a population of 144.5 million people and a vast territory. Seventy-five per cent of the country's population, or 107.6 million people, live in urban areas. Despite the high rate of urbanization, Russian cities exhibit a great deal of variation in terms of sociodemographic characteristics, economic development and political competition (Zubarevich Reference Zubarevich2011). Specifically, there is considerable spatial dispersion of the student population across Russia's regions.Footnote 3 Of 4.4 million students enrolled in tertiary education during the 2016–2017 academic year, 1.3 million were based in the Central federal district, 880,500 people in the Volga federal district, 575,100 in the Siberia federal district, 311,200 in the Ural federal district, and 152,700 in the Far East (Rosstat 2017: 420–423).
Drawing on data from the mass media, the Federal Service of State Statistics (Rosstat) and municipal governments, this study constructs a data set with city as a unit of analysis. The sample consists of Russia's 100 largest cities, excluding Moscow and St Petersburg.Footnote 4 The population size ranges from 181,709 people in Abakan to 1.6 million people in Novosibirsk. The plurality of cities in the sample have a population of between 250,000 and 500,000 people (N = 39). The full list of cities is provided in the Online Appendix (Table A1). From the methodological standpoint, it is advantageous that all the protest events under study were held on the same day (26 March 2017).
Dependent variable
Protest event data are retrieved from multiple data sources, including Meduza, a Riga-based online publication produced by a team of Russian journalists in exile, and at least one local media outlet, focusing on news in a specific city. From its inception in 2014 (Golubkova Reference Golubkova2015), Meduza has provided high-quality coverage of Russian politics and published a host of investigative reports as a result of its collaboration with investigative journalists and human rights activists in Russia. To address a description bias, the Meduza-generated data are cross-referenced with protest event data retrieved from over 100 local (city-based) online publications.Footnote 5 In most cases, Meduza and local media outlets cited similar crowd counts. For example, Meduza reported that the number of participants in the anti-corruption rally held in Kazan, the capital city of the Republic of Tatarstan, ranged from a minimum of 700 to the maximum of 1,500 people. The local newspaper Vecherniia Kazan (Evening Kazan) further revealed a source of conflicting estimates of the protest size. An onsite police officer allegedly reported to his superiors about the gathering of approximately 1,500 people in a city park, but an official press release subsequently issued by the local police lowered the number of protesters to 700 (Yudkevich Reference Yudkevich2017). It is a typical case of the police's efforts to claim a low turnout at a protest event. Since the minimum number of protesters reported by mass media tends to come from the police's press releases, this study does not consider it as a reliable measure of the protest size. For the sake of consistency, the maximum number of protesters cited in the media is used to compare the protest size across cities.
Independent variable
Students is the main independent variable, measuring the university student population as a percentage of the city's population.Footnote 6 The variable is log-transformed.
Control variables
Regression models include a host of variables commonly associated with protest participation (Schussman and Soule Reference Schussman and Soule2005).Footnote 7 In line with life cycle theory (Braungart and Braungart Reference Braungart and Braungart1986), young people in general are prone to protest. This study, however, draws a distinction between university students and young people. Youth, measured as the percentage of 18–29-year-olds in the city's population, is used as a control variable. In addition, control variables measure several dimensions of the local political climate. The variable United Russia measures the percentage of seats held by the ruling party in a city council in spring 2017. Intra-elite conflict, measured on a five-point scale, is a component of the Index of Socioeconomic and Political Strain in Russia's Regions computed by Alexander Kynev, Nikolay Petrov and Alexey Titkov (Reference Kynev, Petrov and Titkov2017). A higher score indicates a higher level of conflict. The variable Free elections is measured on a scale from 0 to 1, with a higher value indicating a lower degree of administrative pressures on electoral processes. As a measure of pre-emptive repression, the binary variable Sanctioned takes the value of 1 if the municipal government granted permission for the protest event. According to Russian law, participation in an unsanctioned protest event incurs a fine of up to 20,000 Russian rubles (US$348) or imprisonment of up to 15 days. Event organizers routinely seek the government's permission to hold a protest event, even though this does not guarantee the absence of arbitrary arrests or police violence at the protest site. Still, the number of participants in state-sanctioned protests might be higher.
Prior research shows that grievances can serve as a catalyst for mass mobilization (Gurr Reference Gurr1970; Tang Reference Tang2015). Since the protests under study focused on the issue of corruption, measures of budget transparency and petty corruption are included in the models. Budget transparency is measured based upon budget transparency monitoring implemented by the National Research Finance Institute in February–December 2016. The variable Clean public sector is measured with the help of the INDEM Index, computed by the Fund Informatika dlia demokratii (Information Technology for Democracy – INDEM). The INDEM Index gauges the supply and demand of bribes, the average size of a bribe and the overall estimated amount of paid bribes based upon a public opinion poll in Russia (N = 17,500). The higher the score, the less corruption in the public sector.
Taking into account the importance of offline and online social networks for mass mobilization, regression models include such variables as Navalny's office, Internet use (percentage of daily internet users within the adult population) and Friendly neighbours (ten-point scale, signifying perceived friendliness of neighbours in a city). The presence of a Navalny election campaign office is used as a proxy for the organizational strength of Navalny's team. Since publicly declaring his intent to run for the presidency in December 2016, Navalny unveiled a schedule of opening campaign offices across the country to collect signatures in support of his candidacy (Volkov Reference Volkov2017). By 26 March 2017, the opposition politician was able to set up regional offices and visit an opening ceremony in 12 Russian cities. Friendly neighbours is used as an indicator of social capital, since interpersonal trust tends to facilitate contentious collective action. In addition, the analysis controls for the size of the 2011 post-election protests and protest activity in 2016 because earlier episodes of contention create opportunities for learning from losses and foster a culture of resistance.
Consistent with prior research on the significance of economic factors (Kern et al. Reference Kern, Marien and Hooghe2015), the analysis controls for Unemployment (percentage of unemployed as a share of working-age population in a city) and Socioeconomic inequality, measured as Gini coefficient at the oblast level. Following the literature, additional controls include Men (percentage of men in the city's population), Ethnic Russian (percentage of ethnic Russians), Federal district and Distance to Moscow (in kilometres). Descriptive statistics for all the variables are reported in Table A3 in the Online Appendix.
Empirical strategy
This study employs a negative binomial regression analysis because the dependent variable, measured as the number of protesters, falls into the category of count data. Negative binomial regression analysis is especially appropriate for over-dispersed count data – that is, when the conditional variance exceeds the conditional mean (for details, see Long and Freese Reference Long and Freese2014). To control for the size of a city's population, the log-transformed measure of the city population is included in each model.
Anti-corruption mobilization across Russian cities
As the first step in empirical analysis, this study finds that anti-corruption protests were held in 77 of 100 Russia's largest cities. The results of binary logistic regression models demonstrate that cities with a larger student population were more likely to witness anti-corruption protests in March 2017 (for details, see Table A4 in the Online Appendix).
Furthermore, a preliminary analysis finds that Russian cities exhibited considerable variation in the size of anti-corruption protests. The number of protesters ranged from as few as 30 in Ulan-Ude to as many as 4,500 in Yekaterinburg. A comparison of Chita and Tomsk illustrates variation in the level of anti-corruption mobilization in two cities with many similar characteristics. Despite the scheduling of protests in state-sanctioned locations, only 100 people showed up for a protest in Chita, while more than 1,000 people turned out in Tomsk (Chita.ru 2017; Korneva Reference Korneva2017). Both cities are located in Siberia, with nine in ten city residents being ethnic Russians. It is noteworthy that young people aged between 18 and 29 comprise approximately one-quarter of the total population in each city. Furthermore, Tomsk oblast and Zabaikalskii krai are plagued with similar levels of corruption and socioeconomic inequality.Footnote 8 Navalny's election campaign office in Tomsk, headed by 23-year-old Alena Khlestunova, opened its doors ten days prior to the protest event. Meanwhile, Nikolai Makarov, a student at Zabaikalskii State University, teamed up with a local civic activist to co-organize the protest event in Chita. What set Tomsk apart from Chita was that there was a higher concentration of university students in the city. Multivariate analysis is employed to investigate whether the size of student population is positively associated with the level of anti-corruption mobilization, controlling for a variety of city-level characteristics.
Table 1 displays the results of negative binomial regression models and reports exponentiated coefficients, also known as the incidence rate ratios. Each model includes the independent variable Students. Model 1 estimates the significance of university students, controlling for the level of corruption. Model 2 replaces corruption measures with socioeconomic inequality, given a strong correlation between the two variables.Footnote 9 Model 3 controls for such political conditions as intra-elite conflict in the region and the representation of United Russia in municipal government. Alternatively, Model 4 controls for the degree of administrative pressures on electoral processes.
Results of Negative Binomial Regression Models

Note: Incidence rate ratios are reported in the table, with robust standard errors in parenthesis. *** p ⩽ 0.05; ** p ⩽ 0.01; *p ⩽ 0.10.
The results of the regression analysis provide robust empirical support for the argument that the size of an anti-corruption protest in a city is positively correlated with the size of university student population. As seen in the last column (Model 4), the rate for Protest size increases by a factor of 3.8 with a one-unit increase in university student population. In contrast, the rate for Protest size decreases by five percentage points with a one-unit increase in youth population.
The results of the negative binomial regression analysis also demonstrate how several socioeconomic and political variables affect the level of anti-corruption mobilization. As seen in Model 1, protests were larger in cities with higher levels of perceived corruption in the public sector. Meanwhile, socioeconomic inequality appears to depress the size of anti-corruption protests. In addition, the results indicate that protests were larger if event organizers secured an official permit from the municipal government to hold such an event. Furthermore, the analysis finds that the number of participants in anti-corruption protests was higher in areas with a lower level of government meddling in elections. Another noteworthy finding is that protests were larger in cities with a higher percentage of ethnic Russians. This finding is consistent with previous research, demonstrating that gross violations of democratic procedures and, in particular, electoral malpractices are more widespread in republics with a sizeable share of non-ethnic Russians (Kobak et al. Reference Kobak, Shpilkin and Pshenichnikov2016).
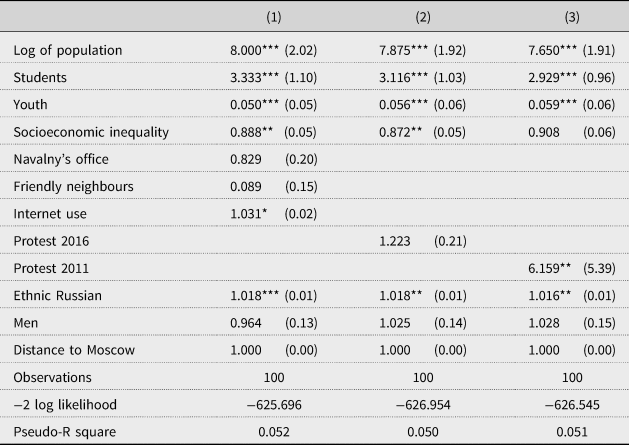
Additional analysis further confirms the association between university students and the size of anti-corruption protests. As seen in Table 2, the coefficient for Students remains statistically significant, controlling for such variables as Navalny's office, Friendly neighbours and Internet use. Furthermore, the size of the anti-corruption protest is positively associated with the number of university students in a city, controlling for the size of the 2011 post-election protests. Notably, a prior record of post-election protests, as well as internet use, increases the likelihood of a sizeable anti-corruption protest in a city.
University Students and Protests

Note: Incidence rate ratios are reported in the table, with robust standard errors in parenthesis. *** p ⩽ 0.05; ** p ⩽ 0.01; * p ⩽ 0.10.
Figure 1 visually presents the divergent effects of university students and youth population. The top panel in Figure 1 plots the marginal effect of Students on the protest size, with a 95% confidence interval. The level of anti-corruption mobilization increases with an increasing share of university students in a city's population. As shown in the bottom panel in Figure 1, the size of the protest, on the contrary, decreases with an increasing proportion of youth in a city's total population.
Marginal Effects of University Students and Youth on the Protest Size
Note: Marginal effects for Students are shown in the top panel and for Youth in the bottom panel. Marginal effects are estimated using Model 1 in Table 2. The shaded area represents the 95% confidence intervals.

The results suggest that the presence of Navalny's election campaign office exerted a negligible impact on the number of participants in the March protests. There are at least two reasons why this trend is observed. First, Navalny's offices started opening their doors in early 2017, so there might have been insufficient time for Navalny's team to build a large base of supporters. The growth of Navalny's offices and the recruitment of Navalny's supporters accelerated in the aftermath of students' participation in the March protests (on this point, see Dollbaum et al. Reference Dollbaum, Semenov and Sirotkina2018). Second, most Russians tend to place little confidence in opposition political parties, so the presence of Navalny's campaign office might have been an insufficient condition for mass mobilization. According to a public opinion poll by the Levada Center, Russia's leading public opinion company, only 10% of those who heard about the March protests believed that support for Navalny had been the driving force behind citizens' participation in the protest event (Levada Center 2017). Nonetheless, it is remarkable that Navalny's campaign captured the attention of many Russians and brought youngsters onto the streets.
Robustness checks
Several robustness checks were performed. Alternative specifications of the model and inclusion of additional control variables do not alter the main result. For example, negative binomial regression models, employing an alternative measurement of youth as 16–29-year-olds, indicate that youth population size is negatively correlated with the size of anti-corruption mobilization. Likewise, models that use the number of universities in lieu of the number of university students as the main independent variable produce similar results. As seen in Table A5 in the Online Appendix, the coefficient for the variable University is statistically significant. To detect the omitted variable bias in ordinary least squares (OLS) regression analysis, the Stata command ovtest was used to perform the Ramsey (Reference Ramsey1969) RESET test (REgression Specification-Error Test). A p-value greater than 0.05 for the RESET test suggests that there are no omitted variables in a model.
The negative binomial regression analysis might be more prone to a Type-II error (false negative) than OLS regression analysis. Based upon a comparison of different estimation methods for count data, Michael Sturman (Reference Sturman1999) finds that negative binomial regression analysis can serve as a ‘conservative check of the results’, while OLS regression analysis ‘does not yield more false positives than expected’ (Type-I error). OLS regression analysis was performed, using the log-transformed dependent variable (the log of the number of protesters plus one) to better meet assumptions of traditional statistical methods (see Table A6 in the Online Appendix). The log of the city's total population was included in each OLS model. The main results are consistent across different models, demonstrating that student population is positively correlated with the size of anti-corruption protests.
Student protest participation: findings from the EVS
The individual-level data from the fifth wave of the EVS are used to examine political attitudes of and protest participation by university students.Footnote 10 The survey, based upon a national representative sample, was conducted in Russia from 7 November to 25 December 2017, almost six months after the March protests against corruption.Footnote 11 A total of 1,825 respondents participated in the survey; 21% of them (N = 385) were aged between 18 and 29. Using the calibration weights, a preliminary analysis finds that university students comprised one-third of the youth population. More specifically, 97% of the surveyed Russian university students were under the age of 25. Two-thirds of university students resided in cities with a population of over 100,000 people. In light of these sociodemographic patterns, the bivariate analysis compares political engagement of university students and their non-student peers, controlling for the age group and the town size. The analysis focuses on 18–24-year-olds residing in cities with a population of over 100,000 people.Footnote 12
The study compares the level of political involvement among university students and non-students aged between 18 and 24 (see Figure A2 in the Online Appendix). The survey results show that 13% of university students, compared to only 1% of non-students, were ‘very interested’ in politics.Footnote 13 A related finding is that Russian university students were heavier consumers of political news than non-students: 33.3% of university students, compared to 28.6% of non-students, daily consumed political news on social media.Footnote 14 Meanwhile, university students placed less trust in government. Most importantly, the analysis finds that 17.5% of university students, compared to 3.8% of non-students, reported participation in demonstrations in 2017. The bivariate analysis of individual-level data suggests that university students participated in anti-corruption protests at a higher rate than non-students of the same age.
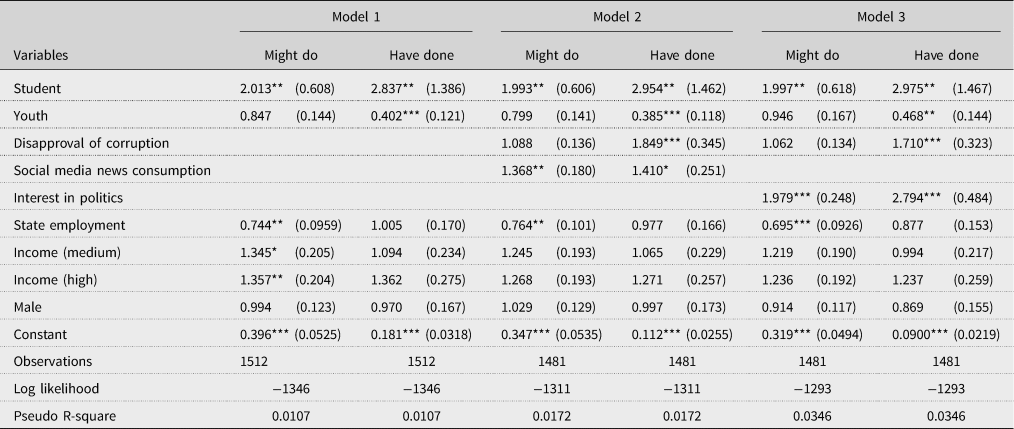
Multinomial logistic regression analysis is performed, with Participation in demonstrations as the dependent variable.Footnote 15 Participation in demonstrations has three categories so that models estimate the risk of protest participation (‘have done’) or protest potential (‘might do’), compared to the risk of non-protesting (‘never’).Footnote 16 Each model includes the binary variables Student and Youth. Model 1 controls for such sociodemographic variables as State employment, Income (measured on a ten-point scale) and Male. Model 2 includes such variables as Social media news consumption and Disapproval of corruption. The variable Disapproval of corruption is coded so that it takes the value of 1 if bribery is never justifiable and 0 otherwise.Footnote 17 It is here assumed that disapproval of bribery will increase the likelihood of joining a demonstration. Model 3 estimates the risk of protest participation, controlling for Interest in politics.
The relative risk ratios (RRR), or exponentiated coefficients, are reported in Table 3. An RRR > 1 indicates that the risk of falling into a comparison group relative to the reference group increases with a one-unit change in the value of an independent variable. An RRR < 1 indicates that the risk of falling into a comparison group relative to the reference group decreases as the value of an independent variable increases.
Protest Participation of Students and Non-Students

Note: The base category for the dependent variable is ‘never’. Relative risk ratios are reported in the table, with robust standard errors in parentheses. *** p ⩽ 0.05; ** p ⩽ 0.01; * p ⩽ 0.10.
The results displayed in Table 3 demonstrate the positive relationship between being a student and protest engagement. Specifically, the risk of protest participation versus inaction increases by a factor of 2.9 for students. Being young, on the contrary, decreases the risk of protest participation. Another noteworthy finding is that disapproval of corruption increases the risk of protest participation versus inaction by over 70 percentage points. As expected, interest in politics increases the risk of protest participation, relative to inaction, by a factor of 2.7 (Model 3). Similarly, news consumption on social media is positively associated with protest participation. In contrast to previous research on protesting in the 1990s, the analysis reveals that gender exerted a statistically insignificant impact on the likelihood of protesting in 2017, signifying that young men and women attended peaceful demonstrations at a similar rate. According to some reports, young women were ‘front and centre’ of the 2017 anti-government protests (Nemtsova Reference Nemtsova2017). Taken as a whole, the results of the regression analysis are consistent with the main argument, positing that the level of anti-corruption mobilization was higher in cities with a larger university population.
Conclusion
Drawing on multiple data sources, the article has analysed the relationship between university students and the size of anti-government protests in an authoritarian regime. The results show that anti-corruption protests were larger in Russian cities with a higher proportion of university students in their population. Concurrently, the analysis finds that youth population size is negatively correlated with the protest size. Individual-level data further confirm that students attended demonstrations at a higher rate than non-students of the same age. These findings underscore the importance of drawing a distinction between university students and young people. More broadly, multivariate analysis shows how different city characteristics affect the size of anti-government protests in a non-democratic setting. The findings might be generalizable to other cases of anti-government protests in Russia and beyond.
Student engagement in the 2017 anti-corruption protests used to be seen as a one-off event in Russian society. Following a surge in protest engagement, students did not show signs of high protest potential in 2018–20. Yet, students again turned out in large numbers in the aftermath of Navalny's arrest in January 2021 (Luxmoore Reference Luxmoore2021). A new cohort of students, embodying heavy TikTok users, joined street protests in support of Navalny and poked fun at the Kremlin on social media (Moscow Times 2021). In turn, state authorities implemented a conventional set of countermeasures (Nikitin et al. Reference Nikitin, Kuznetsov, Mishina and Khlimanova2021). University administrations were charged with the task of scheduling extra classes or exams on Saturday, the date of the protest event, and submitting attendance sheets to the Ministry of Science and Higher Education. In addition, students received warnings via social media about expulsion from university if they became involved in pro-Navalny protests. Furthermore, upon the request of a Russian government agency, the Chinese company ByteDance, owner of the video-sharing app, deleted over one-third of protest-related videos on TikTok (Zverev and Tétrault-Farber Reference Zverev and Tétrault-Farber2021). Despite an arsenal of repressive measures, the authoritarian government scrambled to control the diverse flows of information accessible to university students in the 21st century.
Future research should proceed in several directions. First, scholars should further investigate conditions under which university students in autocracies are more likely to protest. Navalny's ability to harness the power of social media and effectively communicate with youth might explain, in part, why students acted upon his call for action. For comparison, Boris Nemtsov and Vladimir Milov's (Reference Nemtsov and Milov2010) analytical report on Putin's first two presidential terms, uncovering causes and consequences of corruption under Putin's rule, gained less traction among students. Opinion polls indicate that 82% of Russians surveyed in July 2010 had never heard of the report (Levada Center 2015). Meanwhile, Navalny's video on Medvedev's abuse of power has become one of the most widely watched documentaries in Russia. The spread of new information and communication technologies created new opportunities and challenges for the mobilization of students, which presents a fertile area for future research.
Second, scholars should devote greater attention to generational differences within the student population. As noted by a Russian journalist and filmmaker Andrei Loshak, students in the early 2000s tried to fit into the political system, and employment at the state-run gas company Gazprom was their utmost dream (Meduza 2021). In contrast, Russian students in the early 2020s seem to be disenchanted with the authoritarian incumbent and dissatisfied with the dearth of opportunities in their home country. Public opinion research shows that Russian youth view anti-corruption reforms as a top priority for the government (Krawatzek and Sasse Reference Krawatzek and Sasse2018: 11). It has yet to be seen whether today's cohort of students will persist in their resistance to the incumbent government and bring down the current regime.
Supplementary material
The supplementary material for this article can be found at https://doi.org/10.1017/gov.2021.54.
Acknowledgements
I thank Jan Matti Dollbaum, Félix Krawatzek, Graeme Robertson, Andrei Semenov, Joshua Tucker and three anonymous reviewers for their insightful comments. I am also thankful to participants in the international conference ‘Youth Mobilisation and Political Change: Participation, Values, and Policies between East and West’, the Centre for East European and International Studies (ZOiS), Berlin, Germany; the interdisciplinary workshop ‘Cultures of Protest in Russia’, the Davis Center for Russian and Eurasian Studies, Harvard University; the Occasional Series event, the Jordan Center for the Advanced Study of Russia, New York University; the 2019 annual meeting of the American Political Science Association, and the 2019 annual world convention of the Association for the Study of Nationalities for helpful feedback on previous versions of the article. An undergraduate student at the National Research University Higher School of Economics (Russia) provided excellent research assistance. This research was supported by the Faculty Research Expense Program at Fordham University.