


Introduction
Creontiades dilutus (Hemiptera: Miridae), the green mirid, is an endemic Australian bug, recorded from a broad range of host plants including many crops (Foley & Pyke, Reference Foley and Pyke1985; Miles, Reference Miles1995; Malipatil & Cassis, Reference Malipatil and Cassis1997). Prior to the adoption of transgenic cotton that expresses Bt toxins C. dilutus was controlled incidentally by the application of pesticides targeted at the noctuid moths Helicoverpa armigera and H. punctigera (Khan et al., Reference Khan, Kelly, Hickman, Mensah, Brier and Wilson2004; Whitehouse, Reference Whitehouse2011). In Australia, the application of broad spectrum pesticides has fallen by as much as 85% in transgenic cotton (Whitehouse, Reference Whitehouse2011), and C. dilutus has consequently emerged as the main insect target of chemical control (Khan et al., Reference Khan, Kelly, Hickman, Mensah, Brier and Wilson2004) because heteropterans are unaffected by the Cry1Ac and Cry2Ab toxins expressed by transgenic cotton (Whitehouse et al., Reference Whitehouse, Wilson and Fitt2005; Torres & Ruberson, Reference Torres and Ruberson2006, Reference Torres and Ruberson2008).
The widespread adoption of Bt cotton globally has resulted in a similar shift in primary pests towards a number of mirid species, including Apolygus lucorum in China (Lu et al., Reference Lu, Wu, Jiang, Xia, Li, Feng, Wyckhuys and Guo2010; Li et al., Reference Li, Feng, McNeil, Liu, Chen and Qiu2011) and Lygus hesperus in the USA (Gross & Rosenheim, Reference Gross and Rosenheim2011). Other Creontiades species are now emerging pests of transgenic cotton, for example, C. biseratense in India (Rohini et al., Reference Rohini, Mallapur and Udikeri2009; Patil et al., Reference Patil, Udikeri, Vandal, Modagi, Hirekurubar and Guruprasad2010), C. pallidus in the Middle East (Stam, Reference Stam1987; Hosseini et al., Reference Hosseini, Asadi, Kamali, Shojaii and Hadi2002) and C. signatus in the USA (Coleman et al., Reference Coleman, Hereward, De Barro, Frohlich, Adamczyk and Goolsby2008; Armstrong et al., Reference Armstrong, Coleman and Duggan2010, Reference Armstrong, Coleman and Adamczyk2011). All these mirids use multiple host plants. Such ‘generalists’ are frequently found to comprise suites of cryptic species (Hebert et al., Reference Hebert, Penton, Burns, Janzen and Hallwachs2004; Burns et al., Reference Burns, Janzen, Hajibabaei, Hallwachs and Hebert2008; Bonebrake et al., Reference Bonebrake, Watt, Perez and Boggs2011). Interpreting the consequences of multiple host use thus requires that the species status across hosts is determined accurately (Paterson, Reference Paterson and Zalucki1991; Walter, Reference Walter2003). Failure to recognize cryptic species in economically important insects can result in catastrophic errors and wasted resources in pest management or biological control (Paterson, Reference Paterson and Zalucki1991; Clarke & Walter, Reference Clarke and Walter1995; Walter Reference Walter2003; Bickford et al., Reference Bickford, Lohman, Sodhi, Ng, Meier, Winker, Ingram and Das2007). Consequently, the development of integrated pest management programmes aimed at controlling emergent polyphagous mirid pests needs to include the correct resolution of species status across host plants as a research priority. This can be achieved by careful application of molecular techniques to establish the limits of mating and thus gene flow between the populations concerned (Paterson, Reference Paterson and Zalucki1991; Bickford et al., Reference Bickford, Lohman, Sodhi, Ng, Meier, Winker, Ingram and Das2007).
Previous research on green mirids in Australia indicates that there are discrepancies in the use of two crop species, cotton (Gossypium hirsutum, Malvaceae) and lucerne (alfalfa) (Medicago sativa, Fabaceae). Field surveys of C. dilutus in central Queensland indicated that the influx to cotton is characterized by wide expanses of cotton (across 10s to 100s of km) being colonized within a short time by relatively uniform low densities of these insects (Chinajariyawong, Reference Chinajariyawong1988; Miles, Reference Miles1995). Numbers in adjacent lucerne fields, which cover very much smaller areas than cotton, did not appear to decrease dramatically at the same time, so lucerne was apparently not the source of mirids that had moved into cotton (Miles, Reference Miles1995). If lucerne was not the source of mirids that invaded cotton crops, then what was? And what was the underlying cause of the apparent difference in use of the two crop hosts by this species?
Lucerne has been proposed as a trap crop for C. dilutus when interplanted to cotton (Mensah & Khan, Reference Mensah and Khan1997). A greater attraction to lucerne was indicated in mesh-cage choice tests but, in no-choice tests, oviposition and survival were similar across cotton and lucerne. Under field conditions, however, C. dilutus was much more abundant in lucerne strips than in the similar sized inter-planted cotton strips. Following mowing of lucerne, however, C. dilutus numbers did not increase in the inter-planted cotton. C. dilutus may have moved onto weeds adjacent to the field site, as increased numbers were sampled from there (Mensah & Khan, Reference Mensah and Khan1997). Another explanation is that the mirid population on lucerne is a different (cryptic) species to that which occurs on cotton. To interpret resource use by the green mirid, which is renowned for its use of multiple hosts, thus requires that this apparent difference in host plant use be explained. Can it be explained by the presence of two species using different host plants? If not, then how can the differential use of these two host species be explained? Resolving these questions is critical to the effective management of these pests. For example, lucerne would not prove a successful trap crop for green mirids if host associated cryptic species are present across these two crop hosts.
The evidence for cryptic species within C. dilutus was evaluated by sampling mirids from adjacent patches of cotton and lucerne at three geographically separated sites. Microsatellites were used to assess gene flow between insects in adjacent crop hosts. In addition, host feeding was determined by amplifying chloroplast intron markers from the gut of a subsample of individual mirids (Hereward & Walter, Reference Hereward and Walter2012) to determine whether bugs from each of the crops had fed upon the alternative crop. This method previously revealed that although two particular plant species in the genus Cullen are probably the primary hosts for green mirids in the arid interior of Australia, individuals collected from these hosts had often fed on other plant species as well (Hereward & Walter, Reference Hereward and Walter2012). With this approach, we could thus test whether green mirid individuals move between cotton and lucerne. A lack of movement combined with a lack of gene flow (mating) between hosts would provide strong evidence for the presence of cryptic species. Alternatively, movement across the two hosts by members of a single species would require better understanding of the functional relationship of green mirids with each of these hosts. In either case, the resolution provided by such an approach provides a sound basis from which further ecological research can be developed to underpin pest management options for this pest, should be applicable to many other insect pests and is expanded in the Discussion.
Materials and methods
Sampling
Mirids were collected at three sites separated by 100s of km so that host plant associated genetic differentiation could be separated from geographic differentiation and local effects (such as recent immigration). Green mirids can potentially disperse to long distances, but if host associated cryptic species are present within this taxon then long distance dispersal would not occur between lucerne and cotton hosts, and host associated differentiation would be higher than geographic differentiation. At two of these sites cotton and lucerne grow within 50 m of each other – Biloela (24.38°S, 150.52°E) in central Queensland and Narrabri (30.20°S, 149.57°E) in central New South Wales (fig. 1). These two sites, about 750 km apart, were selected so that short distance dispersal and feeding history could be tested across these crops locally. Thirty individuals (juveniles and adults of both sexes) were collected from each host plant species to provide adequate replication in our individual based analyses (STRUCTURE, see below). The third sample was collected at Emerald (23.57°S, 148.21°E), which is about 250 km from Biloela, and about 900 km from Narrabri, where cotton was separated from lucerne by about 5 km, this site was selected to assess genetic differentiation across spatially discrete host plants, and was not included in the gut contents analysis. All samples were collected in January 2007 to remove temporal variation in population genetic parameters (fig. 1), and stored in ethanol.
Sample locations and number of individuals (n) from each sampling event that were used in the microsatellite analyses.

Microsatellite genotyping
DNA was extracted using a modified salt precipitation protocol based on that of Miller et al. (Reference Miller, Dykes and Polesky1988). Nine microsatellites (mirsat-2F, mirsat-4B, mirsat-3E, mirsat-A1, mirsat-3H, mirsat-6B, mirsat-5C, mirsat-G8 and mirsat-7G) were amplified and separated on a MegaBACE 4000 capillary electrophoresis system (Amersham Biosciences), as per Andris et al. (Reference Andris, Aradottir, Arnau, Audzijonyte, Bess and Bonadonna2010). Briefly, each microsatellite locus was amplified in a single PCR reaction, with the addition of fluorescent dye labels using the ‘M13 tail’ method (Schuelke, Reference Schuelke2000), loci were then pooled and cleaned by ethanol precipitation prior to electrophoretic separation. Microsatellite peaks were confirmed and binned manually.
Gut content analysis
Fifty individuals were selected from each host plant at Biloela and Narrabri. Chloroplast trnL intron markers were PCR-amplified from whole insect derived DNA (as above) using the primers: c A49325 (5′-CGAAATCGGTAGACGCTACG) and d B49863 (5′-GGGGATAGAGGGACTTGAAC) (Taberlet et al., Reference Taberlet, Gielly, Pautou and Bouvet1991). PCR conditions comprised: 25 μl reactions using Platinum Taq (Invitrogen), 0.2 μM each primer and 1.5 mM MgCl2 amplified with the touchdown cycling conditions described by Jurado-Rivera et al. (Reference Jurado-Rivera, Vogler, Reid, Petitpierre and Gomez-Zurita2009). These primers yield different sized PCR products for cotton (600 bp) and lucerne (400 bp). Selected products were sequenced on the ABI 3730xl platform (Macrogen) to ensure that each fragment was from the correct plant. Subsequently, these fragments were separated by agarose gel electrophoresis and scored for each individual bug.
Statistical analyses of microsatellite data
The presence of null alleles was inferred from our data using the expectation maximization algorithm (ENA) of Dempster et al. (Reference Dempster, Laird and Rubin1977), global F ST and pair wise F ST (Weir, Reference Weir1996) were computed with and without ENA correction in FreeNA (Chapuis & Estoup, Reference Chapuis and Estoup2007). The number of alleles and heterozygosity (observed and expected) were computed in GenAlEx6.
We used the clustering algorithm as implemented in STRUCTURE (Pritchard et al., Reference Pritchard, Stephens and Donnelly2000), which uses gene frequencies to assign individuals to any specified number of clusters (K) within a Markov Chain Monte Carlo framework. We used both the ‘admixture’ and ‘no-admixture’ models. In the former, individuals are allowed shared ancestry between populations. This model deals better with the complexity of many biological systems, and deals with hybrids in a more natural way. The ‘no-admixture’ model assumes that populations are discrete, and is less appropriate for mirids in the cotton/lucerne context, but is better able to detect subtle structure. We ran these models with all nine loci ‘with nulls’, and for the seven loci that showed little evidence of null alleles (‘no nulls’) to test for the effect of null alleles on the inference of this algorithm. We used a burn-in of 50,000 iterations and a further 500,000 iterations and did not allow the use of population designations for the inference of cluster membership. Under each scenario the algorithm was run five times for each value of K (K=2–5). The results were permuted and averaged using CLUMPP (Jakobsson & Rosenberg, Reference Jakobsson and Rosenberg2007) and plotted using ‘distruct’ (Rosenberg, Reference Rosenberg2004).
We used NewHybrids to infer whether the genetic data indicate the presence of separate gene pools (i.e. species) and, if so, whether F1 or F2 hybrids could be detected. This algorithm also uses an MCMC approach to determine the posterior probability of individuals belonging to five classes, but uses an explicit genetic model for hybridization. The approach does not require that parental gene frequencies are known, or that separate pure parental species have been genotyped (Anderson & Thompson, Reference Anderson and Thompson2002). We ran this algorithm on both the ‘nulls’ and ‘no nulls’ datasets. Several runs were initiated for each dataset to ensure that the same results were converged on each time, then used a burn-in of 500,000 iterations, followed by 250,000 iterations. The results were plotted using ‘distruct’ (Rosenberg, Reference Rosenberg2004).
Results
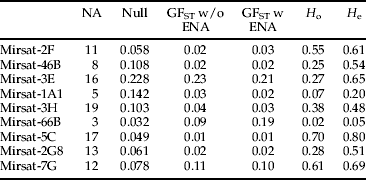
Two loci (mirsat-3E and mirsat-1A1) showed evidence of null alleles (table 1) and our analyses were run with and without these loci (see below). Global F ST (Weir, Reference Weir1996) was 0.063 with all 9 loci and without ENA correction (Chapuis & Estoup, Reference Chapuis and Estoup2007), but 0.058 with ENA correction. With just the seven loci with low null allele frequencies, global F ST was 0.041 without correction, and 0.041 with correction. The loci were variable across the populations sampled, with a total of 104 alleles when the null-prone loci were included and 83 when not included (table 1). The pair wise F ST comparisons reveal a greater effect of geography than host plant on genetic differentiation (table 2, mean pair wise F ST between plants within sites=0.0141, mean pair wise F ST across sites=0.0753). The highest pair wise F ST values are from comparisons between Emerald and other sites, possibly due to recent immigration.
The specific microsatellite loci (left hand column) amplified across all samples. Given for each of these are the number of alleles (NA), mean frequency of null alleles (Null), global F ST without ENA correction, global F ST with ENA correction, observed (H o) and expected heterozygosity (H e).
Pair wise uncorrected F ST values across all sites and host plants, asterisks indicate within-site comparisons between populations sampled from cotton and those from lucerne.

When the two loci with higher null allele frequencies were excluded and the admixture model was used, no difference was detected in cluster assignment using the structure algorithm (fig. 2a). When all 9 loci were included and the no admixture model used, some weak structure seems present, with Emerald samples having greater assignment to one cluster than the other samples (fig. 2b), as indicated by the pair wise F ST comparisons (table 2). This pattern is not evident, however, under the same model with the ‘no nulls’ dataset (fig. 2c). With this same dataset and K increased to three, the admixture results show that some individuals have a higher posterior probability of belonging to a third cluster, with the rest having an even assignment to all three (fig. 2d). When the NEWHYBRIDS algorithm was used with the ‘no null’ dataset these same individuals were assigned with some ambiguity to either the second parental species category or the pure F2 category (fig. 2e, see individuals marked with an asterisk). In analyses with all nine loci, these individuals were assigned with higher posterior probability to the second parental category (data not shown).
Results of the clustering analyses performed with STRUCTURE and NEWHYBRIDS. Each bar represents one individual and the shading represents the posterior probability that the individual concerned belongs to each of K clusters (which is given above the bar diagrams). Asterisks above the bottom diagram (e) indicate the 15 individuals that have a greater than 50% posterior probability of assignment to a separate species (black) or an F2 hybrid (grey) in the NEWHYBRIDS analysis.

The chloroplast intron markers amplified from mirid gut contents resulted in two different sized products, 600 bp (cotton) and 400 bp (lucerne), 5 random cotton-sized products and 5 lucerne-sized products were sequenced to confirm their identity. The cotton-sized sequences were all identical and are an exact match for G. hirsutum (GenBank, blastn search). The 5 lucerne-sized sequences were also identical, and matched Medicago sativa with a single base pair difference. One representative sequence of each crop species was deposited in GenBank (accession numbers: cotton=submitted, awaiting accession; lucerne=submitted, awaiting accession). From our analyses of gut contents of individuals from adjacent cotton and lucerne fields, 35% of mirids sampled in cotton had also fed on lucerne (n=98), and 18% of those mirids collected from lucerne had also fed on cotton (n=99) (fig. 3). Of those collected in cotton, 24% returned evidence of having fed only on lucerne (n=98). Those from lucerne indicated 12% had fed only on cotton (n=99) (fig. 3).
Gel (top) shows typical results of the gut content analysis of 14 bugs (numbers below). Clearly evident is the separation of cotton-amplified PCR products (C), lucerne-amplified products (L), and individuals that had both cotton and lucerne DNA in their guts (B). The table (below) shows the number of individuals (%) from each collection from which these products were amplified.

Discussion
Before this study, green mirids had shown every indication of comprising cryptic species across cotton and lucerne. Interpreting the host use of these insects in terms of them belonging to a single species was not straightforward. The novel application of these two different molecular approaches within a sampling strategy based on prior observations of the ecology of these bugs has resolved the problem. We detected high gene flow between cotton and lucerne, and even evidence, based on their feeding, of frequent movement between these two crops. Our results therefore indicate that the unusual patterns of host plant use recorded for C. dilutus are not a consequence of hidden host-specific cryptic species. Furthermore, fragments of the length that we amplified from the mirid gut contents can evidently be only detected within 12–48 h post ingestion (Hoogendoorn & Heimpel, Reference Hoogendoorn and Heimpel2001; Gariepy et al., Reference Gariepy, Kuhlmann, Gillott and Erlandson2007; Fournier et al., Reference Fournier, Hagler, Daane, de Leon and Groves2008; Muilenburg et al., Reference Muilenburg, Goggin, Hebert, Jia and Stephen2008). Out gut content analysis therefore shows that individual mirids will move between these hosts frequently when they are planted nearby, to the extent that a quarter of all bugs investigated from cotton had evidence only of lucerne in their guts, and with 12% of those from lucerne having fed only on cotton at the time of capture (fig. 3). Below, we interpret our findings in relation to previous studies, and then outline the implications for further research on green mirids and the consequences for their management.
Gene flow across host plants
Increasingly, single locus makers are recognized as poor choices for delimiting closely related species, especially those from uniparentally inherited genomes (such as mitochondria and chloroplasts) (Petit & Excoffier, Reference Petit and Excoffier2009). Such markers are liable to over-represent low frequency hybridization and suffer from incomplete lineage sorting, both of which undermine the accurate assessment of contemporary levels of gene flow in the system of interest (Powell, Reference Powell1983; Berthier et al., Reference Berthier, Excoffier and Ruedi2006; Nevado et al., Reference Nevado, Koblmuller, Sturmbauer, Snoeks, Usano-Alemany and Verheyen2009). Instead, we took a multi-locus multi-allelic approach, using microsatellites to make a robust assessment of gene flow across these two host plants at geographically separated sites.
Genetic differentiation was low across all our samples (global F ST=0.041 in the ‘no nulls’ dataset), consistent with high gene flow. The pair wise F STs across host plants within sites was lower than the between-site comparisons (mean F ST=0.0141 vs. 0.0753, table 2) indicating that there is very little genetic differentiation associated with host plants. Under the most conservative parameters (the admixture model and the ‘no nulls’ dataset), the STRUCTURE algorithm indicates a lack of genetic structure across host plants and across geography from our microsatellite data (fig. 2a). This finding is broadly in line with preliminary allozyme work undertaken by Miles (Reference Miles1995), where no differentiation was found between cotton and lucerne. Conversely, the NewHybrids analysis implicated 15 individuals as being either a second species or pure F2 crosses (fig. 2e), but these individuals are not associated predominantly with cotton or lucerne.
In situations with low differentiation the model based methods that we used in this study can sometimes infer a structure that might not be biologically relevant. NewHybrids specifically relies on the presence of gene frequency differences between species (Anderson & Thompson, Reference Anderson and Thompson2002). We used the STRUCTURE algorithm with and without the null-prone loci under different model conditions to determine whether this same pattern would be inferred. Although it has been shown that clustering analyses, such as STRUCTURE, are insensitive to low frequencies of null alleles (Carlsson, Reference Carlsson2008), when we included loci with relatively high frequencies of null alleles (0.14 and 0.22, table 1) quite different outcomes that were biologically reasonable were returned (fig. 2b). When the number of clusters, K, was set to 3 these same individuals were assigned to the third cluster. On closer inspection of the genotypes, the 15 individuals that clustered differently to the other samples mostly had a higher number of loci that are homozygous for a single allele, and this may have led to the clustering algorithms separating them. Possible causes of this pattern of homozygosity are discussed in the following subsection.
Multiple host use and future research priorities
Green mirids are endemic to Australia and found in high numbers in the arid interior in association with two native central Australian legumes Cullen cinereum and Cullen australasicum (Fabaceae) (Hereward & Walter, Reference Hereward and Walter2012). Using the same microsatellite loci as used here (table 1) we found genetic evidence of bottlenecks and long distance migration between the arid interior and more eastern sub-coastal cropping regions (J.P. Hereward, unpublished data). Individuals with increased homozygosity in fig. 2e may be the result of immigrants from inland populations, or their offspring. The gut contents analysis showed that green mirid individuals will move frequently between cotton and lucerne and a significant proportion of individuals will feed on both when they are planted close to each other (fig. 3). Together, these data indicate that green mirid individuals form a single gene pool (or species), with individuals that associate with both cotton and lucerne.
The influx of mirids to cotton has been characterized as sudden and widespread, with these bugs appearing across most cotton crops in the relatively extensive cotton growing region Biloela (for example) within a 24 h period, as demonstrated by crop consultant surveys and field sampling (Miles, Reference Miles1995). Green mirids are present in lucerne in high numbers at this time, but sticky trap data showed that numbers of mirids in lucerne did not drop appreciably at the time of mirid influx to cotton (Miles, Reference Miles1995). This pattern could, however, be explained by an influx of green mirids from host plants external to the agricultural system (possibly inland sites via long distance dispersal) especially if they settle at similar rates on both cotton and lucerne. The host searching mechanism in green mirids, particularly long range cues, clearly require directed research.
Lucerne supports consistently higher numbers of mirids than cotton, which is a relatively poor host for them (even though low densities are enough to cause damage (Chinajariyawong, Reference Chinajariyawong1988; Khan et al., Reference Khan, Kelly, Hickman, Mensah, Brier and Wilson2004)). This difference appears to have a sensory basis, because more mirids colonize lucerne in choice tests, but the survival of adults and nymphs in no choice tests did not differ between the two hosts (Mensah & Khan, Reference Mensah and Khan1997). Furthermore, lucerne is more closely related to the primary hosts of green mirids, namely C. cinereum and C. australasicum which are also Fabaceae, than is the malvaceous cotton (Hereward & Walter, Reference Hereward and Walter2012). However, performance testing has been largely limited to a single generation of these bugs, because rearing them under laboratory conditions for much longer than that is difficult. The use of Cullen to rear mirids may provide a solution to this problem.
The field trials of (Mensah & Khan, Reference Mensah and Khan1997) indicated that when lucerne is mowed, mirid numbers do not increase appreciably in adjacent cotton, but our data show that when these two crops are planted next to each other, a relatively high proportion of mirid individuals do move between the two crops and a substantial proportion feed on both. Mowing lucerne is likely to be enough of a disturbance to cause these insects to move further than adjacent cotton strips, and possibly a considerable distance given their high propensity for ‘startle’ flight and their obvious flight capacity (J.P. Hereward, unpublished data). Our collective results indicate that green mirids are likely to move a lot, both within sites (even when the primary host is present (Hereward & Walter, Reference Hereward and Walter2012)) and across distances up to 2000 km (J.P. Hereward, unpublished data). The processes of flight initiation, flight duration, physiological effects and the cues used for flight arrestment are thus research priorities if the invasion of cotton by these insects is to be understood.
Our results indicate that lucerne may not be an ideal trap crop for green mirids on the basis of movement and preference alone. The results of Mensah & Khan (Reference Mensah and Khan1997) may instead be a consequence of higher predator abundance in the unsprayed lucerne strips. Cullen species may prove to be a better option and it is likely that the opportunity to test this proposition will arise as both C. cinereum and C. australasicum are under investigation as drought tolerant pasture crops (Lori et al., Reference Lori, Michael, Susan, Margaret and Megan2009; Bennett et al., Reference Bennett, Ryan, Colmer and Real2010; Suriyagoda et al., Reference Suriyagoda, Ryan, Renton and Lambers2010; Bell et al., Reference Bell, Ryan, Bennett, Collins and Clarke2012). Should these species be domesticated and planted as crops it is also likely that they will support large numbers of green mirids that are likely to move into cotton, given that they support very high numbers of C. dilutus (Hereward & Walter Reference Hereward and Walter2012), and that gene flow between Cullen in the arid interior and cotton in eastern regions has been documented (J.P. Hereward, unpublished data). Future attempts to rear green mirids under laboratory conditions should, however, investigate the use of Cullen as a host, as a reliable method of maintaining more than a couple of generations would enable experimental approaches to understanding host detection and localization.
Conclusions
Although previous ecological data raised the possibility of cryptic species under the single taxon C. dilutus differing mainly in their use of cotton and lucerne hosts, we find no evidence to support this suggestion. Their unusual pattern of host use relative to these crops thus needs an ecological explanation, the beginnings of which are offered here. Our approach to testing for the presence of cryptic species in green mirids, a combination of molecular analysis of gene flow and gut contents analysis using chloroplast markers, has allowed this issue to be clarified. Previous data can now be interpreted in a new light, and future research directions set accordingly. However, our results also provide a methodological lesson; care must be taken when analysing microsatellite data that null alleles are dealt with adequately and that appropriate analytical models are chosen. The approach outlined in this study should be widely applicable to herbivorous insect pests, and understanding the species status of economic pests is critical to interpreting their ecology and thus setting accurate management guidelines.
Acknowledgements
We would like to thank Lindsay Popple and Andrew Ridley for assistance in field collections, and the Queensland Government Biloela research station, the Australian Cotton Research Institute, Tony & Mary O'Regan and Neville Moss for access to cotton and lucerne for mirid collections.



