

INTRODUCTION
The Conservative Movement has arguably been the dominant force in American politics since the 1970s. It has fully captured one of the major political parties, partially captured the other, and perhaps most importantly, consists of a range of institutions and sub-movements that effectively dictate what is possible in the realm of policy. The limits and possibilities of the government at all levels to tax, wage war, provide access to abortion, fund and administer schools, among other areas, are deeply influenced, if not entirely dictated by, conservative institutions and political figures. Why is the Conservative Movement today so much more powerful than historians describe it being in the immediate post World War II period (see Diamond Reference Diamond1995)? Sociologists, geographers, and political scientists have been deeply influenced by what could be called the Materialist Theory of Political Change (MTPC). The MTPC emphasizes the economic causes of conservatism’s rise and the importance of the 1970s as a moment (Dumenil and Levy, Reference Dumenil and Levy2004; Harvey Reference Harvey2005; Klein Reference Klein2007). The MTPC describes extended periods of institutional confluence around a set of economic ideas (Blyth Reference Blyth2002; Hackworth Reference Hackworth2007; Harvey Reference Harvey2005). Those periods are punctuated by crises that disrupt the status quo and provide space for an alternative paradigm. The Great Depression was the first such crisis during the twentieth century. The collapse of profitability destroyed the prevailing paradigm of laissez faire economics and opened a political space for socialists and Keynesians to build an alternative that involved a more vigorous role for economic management and social redistribution (Harvey Reference Harvey2005). David Harvey (Reference Harvey1989) deemed this the “Keynesian-managerial” period. Keynesian-managerialism prevailed from the end of World War II until the 1970s when it was then undermined by another economic crisis and replaced by neoliberalism (Harvey Reference Harvey2005; Klein Reference Klein2007; Stein Reference Stein2011). Neoliberalism is centered on individualism, market-fundamentalism, and an almost perpetual assault on the social interventions crafted in the Keynesian-managerial period (Hackworth Reference Hackworth2007). Within the MTPC, neoliberalism is the well-spring of change. Other aspects of the Conservative Movement such as abortion rights, military interventions, and traditional values are viewed as secondary, derivative, or not mentioned at all.
Most scholarship that explicates the MTPC does so at general spatial and temporal levels. The scope is frequently entire countries if not the Global North in general (Harvey Reference Harvey2005), and long durations (Polanyi Reference Polanyi1944). Comparatively less of this theoretical corpus is designed to understand more microscopic spatial changes but its reasoning can be easily applied to smaller spaces. If the center of the Conservative Movement is neoliberal economic policy (Dumenil and Levy, Reference Dumenil and Levy2004; Harvey Reference Harvey2005), conservatism logically (from a material standpoint) would be most ascendant in places where higher income households live or have moved to, such as the suburbs. If the Conservative Movement is ultimately about the reduction of taxes and social services to lower income groups, suburban conservatism could be explained as a movement to locales with lower taxes and better (per capita) services. Indeed, this is the explicit theory of the public choice school of thought since Charles Tiebout (Reference Tiebout1956) (see also Glaeser Reference Glaeser2011). Such movement leads to a geographical concentration of people who value private property and wish to detach themselves from the social obligations (taxes and social programs) achieved during the Keynesian-managerial period. Since one political party (Republicans) has more aggressively adopted that agenda than the other (in fairness they have both adopted it to some degree), it stands to reason that the suburbs have become more Republican for economic reasons.
To be sure, there is more than a kernel of truth to this explanation, but the MTPC suffers from several limitations. First, the Republican Party has been fairly consistent about economic policy since at least the New Deal. Their primary response to the expansion of the welfare state during the 1930s was to advocate for its reversal. They have advocated for lower taxes, smaller government, and diminished social welfare for almost a century, so finding a lurch toward the Republican Party since the 1960s would likely be rooted in other policy positions. Exit polling data suggest that positions on civil rights are key. Using American National Election Survey and other similar datasets, political scientists have found a growing association between racial resentment attitudes and voting Republican in presidential elections (Enders and Scott, Reference Enders and Scott2019; Tesler Reference Tesler2013; Tuch and Hughes Reference Tuch and Hughes2011). Scholars have, moreover, complimented this by illustrating that suburban conservativism is both a rejection of class obligations and an expression of fear, animus, or political disagreement with non-White populations (Gainsborough Reference Gainsborough2005). Second and related, suburban conservatism tends to be reduced to economic rationales (e.g., lower taxes) within the MTPC because suburban residents emphasize these themes in surveys and interviews. But sociologists have long argued that many White respondents—particularly those with higher incomes and education—are reluctant to admit racial animus for fear of being pejoratively judged. Scholars of race deem this the “social desirability bias” (Krysan et al., Reference Krysan, Couper, Farley and Forman2009). At a wider scale, it has also been inferred that suburban groups are aligned primarily with the economic goals of MTPC because their voting patterns and organizations that represent them invoke themes like “workfare”, “lower taxes”, and “freedom”—which are all, on their face, economic themes. But as Kevin Kruse (Reference Kruse2005) among others argues, such groups actually began by using openly segregationist language in the 1950s and 1960s. When this proved untenable, they adapted their discourse to the ostensibly-deracialized themes of “welfare” and “freedom”. Sociologists have argued how such terms have strong symbolic coding—in particular they serve as a plausibly deniable, socially acceptable way to express resentment toward minority groups (Haney Lopez Reference Haney-Lopez2014; Sears Reference Sears, Katz and Taylor1988). Finally, the Du Boisian school of racial capitalism argues, among other elements, that one cannot decouple the construction of race and class in the American context (Hackworth Reference Hackworth2021b; Itzigsohn and Brown, Reference Itzigsohn and Brown2020). There have long been reciprocal efforts between the White working class and White elites to bond with one another against non-White people (Du Bois Reference Du Bois1935; Hackworth Reference Hackworth2021b; Ignatiev Reference Ignatiev1995; Olson Reference Olson2004; Roediger Reference Roediger2007, Reference Roediger2019). One result of these efforts is to disadvantage non-White people in the provision of good jobs, equity-generating housing, and respectful treatment from law enforcement. Thus, even if the MTPC argues that political change is ultimately a class project, further explanation is needed as to the racial implications given that the production of disadvantage in the United States is not entirely reducible to class.
This article advances the following argument through a case study of presidential voting totals in the state of Ohio before, during, and after the Civil Rights Movement. First, contrary to conventional political wisdom, which places the rise of conservatism in the “socially intolerant” White rural areas of the United States, the greatest and most impactful post-Civil Rights swings toward Republican presidential voting have been in the suburbs of states like Ohio. The suburbs are the fastest growing locations in the state, so they have much more electoral influence on the rise of conservative politics than rural areas. Second, it is incomplete to attribute this tendency to the economic assumptions within the MTPC. The Conservative Movement is not reducible to neoliberalism. I adopt Corey Robin’s (Reference Robin2018) more general definition of conservativism as “a meditation on—and a theoretical rendition of—the felt experience of having power, seeing it threatened, and trying to win it back” (p. 4). This reactionary reach for the past is evident in neoliberalism, to be sure, but equally so for other elements of the Movement such as a desire for a past racial, gender, or moral order. Finally, the 1970s crises were important but they were not alone amongst realignment forces that give conservatism its present power. As historians and sociologists have long argued, there was also a racial realignment provoked by the Civil Rights Movement (Carmines and Stimson, Reference Carmines and Stimson1989; Carter Reference Carter1995; Edsall and Edsall, Reference Edsall and Edsall1992; Inwood Reference Inwood2015). Many of the politicians and think-tank conservatives who promoted neoliberalism and critiqued Keynesianism, were also hostile to the Civil Rights Movement, Black municipal empowerment in the North, and busing (Hohle Reference Hohle2015; Maclean Reference MacLean2017). Many invoke the language of neoliberalism (e.g. “freedom”) to inoculate themselves against accusations of racism (Inwood Reference Inwood2015; Roberts and Mahtani, Reference Roberts and Mahtani2010). This paper builds upon suburban history, the critical Whiteness paradigm, and group threat theory to provide an amendment to the MTPC that more fully recognizes the role of anti-Black racism at shaping broader political change. I adapt the emphases of these three schools of thought to the case study of political change in Ohio, from 1932 to 2016.
CRITICAL HISTORY, GROUP THREAT, AND DU BOISIAN ‘WHITENESS’
A synthesis of three paradigms—group threat theory, Du Boisian racial economy, and critical historiography—provides a needed amendment to the materialist theory of political change. Group threat theory (GTT) was initially devised by sociologist Herbert Blumer (Reference Blumer1958) but has been adapted and refined into a central paradigm within sociology (Bobo Reference Bobo1983; Brown Reference Brown2013; Pottie-Sherman and Wilkes, Reference Pottie-Sherman and Wilkes2017). GTT is counterposed with theories of racism that are centered on individual education and income levels. Group threat theory suggests that racism is durable across time and transcendent of class—though its manifestation may be different. GTT’s central insight is that all people are group conscious. Human identity is formed through constant attempts to understand and negotiate one’s role within and between groups. One dimension of that process is an understanding of what group we are not in. We are conscious of what binds the “in-group” and suspicious of threats by “out-groups”. These threats need not be physical or violent—though they may be—and they need not be direct to individuals. Threats to the position of the group in a hierarchy are particularly impactful and provoke a defensive response—racism—that can manifest in a variety of ways. The threat does not dissipate until and unless identification with groups is altered. As long as White and Black residents of the same city view themselves as groups, the potential for the powerful group to put racist limitations on the subordinate group to manage “threats” is ever-present. Scholars have shown, for example, how the movement of large numbers of immigrants or non-White people into a previously White neighborhood can provoke direct responses like physical violence, and indirect ones like an intense focus on law enforcement to restore social order. Group threat can be provoked through relatively organic conflicts, simple in-migration, or can be consciously produced (and reproduced) by political entrepreneurs seeking to generate advantage. The weakness of GTT as a stand-alone theory for political change, however, lies in the depth, nature, and meaning of “threats”. That is, the most obvious threat triggers for White suburban reaction—busing orders, violent uprisings, demographic change after the Great Migration—occurred almost fifty years ago in some cases, but White animus has not abated; in some cases it has intensified. Racially-prejudiced views persist despite the benefit of time since the most acute changes. Group threat theory alone cannot explain this.
Du Boisian racial economy provides some clues and emphases that can help with this task. W. E. B. Du Bois was a Marxist so it is likely that he would have agreed with some of the premises of the MTPC. But his Marxism, unlike many of his contemporaries’ (and many of his successors’) (Roediger Reference Roediger2019) was never colorblind. To Du Bois, modern racism emerged as a narrative and worldview to justify the obvious moral atrocities of colonial pillage and slavery:
Lying treaties, rivers of rum, murder, assassination, mutilation, rape, and torture have marked the progress of the Englishman, German, Frenchman, and Belgian on the Dark Continent. The only way in which the world has been able to endure the horrible tales is by deliberately stopping its ears and changing the subject of the conversation as the deviltry went on […]. ‘Color’ became the world’s thought synonymous with inferiority, ‘Negro’ lost its capitalization, and Africa was another name for bestiality and barbarism. Thus the world began to invest in color prejudice. (Du Bois Reference Du Bois1915, p. 708)
Racism and capitalism are not just co-existent—they are co-dependent within this worldview. He is thus considered one of the early theorists of what is now called “racial capitalism” (Robinson Reference Robinson1983).
Du Bois passed in 1963, before the bulk of the Civil Rights Movement unfolded, but he did weigh in on broader political change on a number of occasions and his emphases can be transported to the present by inference. I wish to highlight three over-lapping elements of his work that can be used to understand post-Civil Rights Movement political geographies of places like Ohio. First, unlike many political economists, Du Bois emphasized the durability of racism, and the acute nature of anti-Black racism (Du Bois Reference Du Bois1920). Racism is one form of differentiation needed by capitalism to justify its pillage and oppression. It mutates in time and space. Second and related, the material benefits of racism have driven White elites to use it to advance their material interests. Du Bois cites numerous examples of White factory owners, for example, exploiting tensions between White and Black workers to undermine solidarity. In a number of cases, such as East Saint Louis in 1917, this led to murderous rampages by Whites seeking revenge against Black workers for competing with them. The hostility of White labor to Black workers led to, among other outcomes, refusal to allow non-White union membership and attempts to politically distance the labor movement from the Civil Rights Movement. The New Deal period is sometimes framed as an antidote to such animosity, but as Du Bois among others points out, the benefits of this period were not trans-racial—they were overwhelmingly designed to benefit White workers. The benefits of the New Deal were “confined almost entirely to the White race” (Du Bois Reference Du Bois1944, p. 454), by design. New Deal benefits to Black workers, where they existed, were often derivative, secondary, and resented by White workers. So a Du Boisian perspective would reframe the starting point of the MTPC—it was not a broadly social move to social democracy. It was premised on White supremacy and would not have become enacted had it been more racially equal. In the 1960s and 1970s, White elites in the Republican Party had spent years advocating against the taxation levels and redistribution of the New Deal Democratic Party. But they were largely unsuccessful at agitating change. In the infamous Powell Memo, retired Supreme Court Justice Lewis Powell encouraged corporations to be more active in politics—to donate, lobby, and agitate for conservative causes.Footnote 1 By this point (1970) the Civil Rights Movement had provided sufficient resentment amongst poor and middle class Whites. White elites simply adapted their strategies and began to invest heavily in media, think-tanks, and the Republican Party which stoked these divisions and successfully framed the Democratic Party as hostile to White people. “In the eyes of many Whites”, Joel Olson (Reference Olson2008) writes, “the Democratic Party became the party of and for Black people” (p. 712).
The third, related, element of Du Boisian racial economy that provides explanatory power is the psychic value of racism to poor and middle-class Whites. Du Bois was insistent that racism functioned to assist capitalism—and was thus material—but one of the weapons that White elites could use was less tangible. The psychic need to believe in White superiority is often sufficient to make poorer Whites vulnerable to purely symbolic gestures as substitutes for material ones. Du Bois was, of course, conscious that even poor Whites enjoyed material “wages” from their Whiteness: better schools, housing, and treatment from law enforcement than Black people of similar means in the United States. But he was also conscious of the fact that Whites could be easily manipulated. Jim Crow Laws (e.g., separate facilities, laws about eye contact with Whites, etc.) were designed to reinforce the belief in superiority, and they generated intense loyalty amongst poor Whites who viewed them as honest expressions of their own supremacy and alliance with wealthier Whites. This aspect of Du Bois’ work, has spawned the critical Whiteness paradigm (see also Hackworth Reference Hackworth2019a; Ignatiev Reference Ignatiev1995; Lipsitz Reference Lipsitz2006; Olson Reference Olson2004; Roediger Reference Roediger2007;). Briefly, this paradigm holds that Whiteness is actively maintained by White elites as a racial project to inhibit class solidarity in the United States. More recent scholars have noted how powerful these efforts remain. Jonathan Metzl’s (Reference Metzl2019) work with White working class and poor people in the last few years stands out in this regard. He interviewed hundreds of marginalized White people who had little or no material reason to support White supremacy but who nonetheless were willing to sacrifice a great deal (sometimes their lives) to maintain the illusion of their benefit. White elites are conscious of the power of these psychic benefits and deploy symbols and messaging designed to activate them. Famous examples include stoking racial divisions through the invocation of tropes like “welfare queens” and “dangerous Black men”. As often, these symbolic projects involve the invocation of spaces—the Black city in particular. Framing the Black city as a dangerous, socialistic, menacing place in need of control has been an important form of advancing conservative policy goals in the past fifty years (Hackworth Reference Hackworth2019b; Kornberg Reference Kornberg2016; Seamster Reference Seamster2018).
The final component of this theoretical amendment comes from critical historical work on anti-Blackness. This paradigm emphasizes forms of racial animus that operate in conjunction with or separate from economic sources of change (Anderson Reference Anderson2016; Delmont Reference Delmont2016; Hirsch Reference Hirsch1983; Kruse Reference Kruse2005; Mayer Reference Mayer2016). Several events and processes are particularly important. The second wave of the Great Migration brought millions of Black people to certain cities in the North in search of employment that had previously been denied. In some of these cases, Black people began to achieve majorities (for example, in Gary, Indiana and Detroit), or substantial minorities. Not surprisingly, northern urban Black people began to politically align to break down the barriers to better housing, schools, and jobs (Reed Reference Reed and Smith1988). Conflicts with school boards, housing officials, police forces, and zoning boards ran the gamut from the courtroom, to picket line, to violent uprising (in 1967 and 1968). With larger numbers, Black populations began to elect Black city council persons and mayors, and to have national influence over the advancement of the Civil Rights Movement in the 1960s. Many White residents of cities where Black people were demographically and politically ascendant responded with vitriol—“White rage” as historian Carol Anderson (Reference Anderson2016) deems it—to what they saw as the unlawful political takeover of their city. When the last and most consequential wave of the Civil Rights Movement for the North—busing orders from the federal government—began to affect cities throughout the Midwest, middle class White people responded by moving to surrounding counties and aligning with politicians who were hostile to busing (which were and remain Republicans) (Bobo Reference Bobo1983; Delmont Reference Delmont2016; Hackworth Reference Hackworth2021a; Orfield Reference Orfield1978). These three paradigms offer a needed amendment to the MTPC which is weak at understanding non-economic sources of political change. An application of these insights to political change in Ohio illustrates this value.
POLITICAL CHANGE IN OHIO, 1932–2016
Presidential voting patterns are a proxy for broader political change. Turnout for presidential elections and exposure to the campaign rhetoric is higher than other elections at the state and local levels. At the national level, scholars have noted how voting shifts serve as a proxy for broader changes in race relations and attitudes. Political scientists have noted how being White and voting Republican have become increasingly correlated with one another since the Civil Rights Movement (Enders and Scott, Reference Enders and Scott2019; Tesler Reference Tesler2013; Tuch and Hughes, Reference Tuch and Hughes2011). Others have noted how whole regions of the United States have changed political affiliations after the Civil Rights Movement—most famously with the South moving from Democratic-aligned to Republican-aligned, and the Northeast the reverse of this pattern (Rigueur Reference Rigueur2015). Midwestern states have shifted in more subtle ways and have not always received scholarly attention despite being the most actively contested zone in presidential elections since the 1960s. To illustrate the historical and spatial variation in electoral patterns in the region, I focus on one closely-contested state, Ohio. There is nothing unique about Ohio, but it was chosen for several reasons. First, it has been electorally competitive since 1932, the beginning of the New Deal. Finding small changes in political geography in Ohio portends larger shifts at the national level given the electoral college model. Second, the state possesses a mix of cities, suburbs, and rural areas. It is not dominated by one major city, but by several large and medium size cities. This enables an analysis that is not overly influenced by one particular metropolitan area or city.
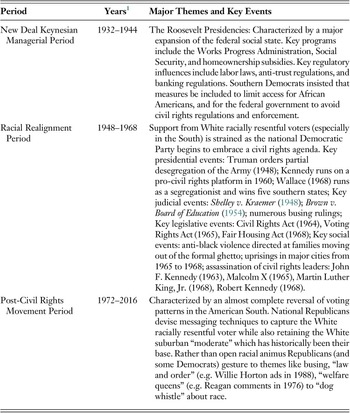
To analyze spatial change over time, I first divide presidential elections into three periods: (1) 1932 to 1944 as a proxy for the New Deal period; (2) 1948 to 1968 for the Civil Rights Movement, racial realignment period; and (3) 1972 to 2016 for the post-Civil Rights Movement period (see Table 1). The period of racial realignment was characterized by the national Democratic Party softening, then capitulating to, then facilitating the Civil Rights Movement (Rigueur Reference Rigueur2015). Key events in this period include President Truman’s order to desegregate the Army in 1948, a spate of court decisions that undermined housing and school segregation, and the three major civil rights acts of the 1960s. Busing court decisions (which were still being delivered as late as the 1970s) were particularly integral at moving otherwise evenly-divided (or Democratic leaning) spaces to becoming very Republican spaces. Though national Democrats were certainly not fierce advocates for busing, Republicans from Richard Nixon onward were openly hostile to it. Presidents Nixon, Ford, and Reagan not only frequently mentioned the topic; they actively dismantled the federal government’s ability to enforce desegregation orders coming from courts or the Department of Health Education and Welfare (Delmont Reference Delmont2016). In both subtle and overt ways, Republicans established themselves as hostile to the juridical residue of the Civil Rights Movement. Their position on these issues changed much more than their rhetoric and position on economic policy—which was consistently laissez-faire (“neoliberal” in today’s language) throughout the twentieth century (Rigueur Reference Rigueur2015).
Racial realignment in the United States, key moments, 1932–2016.
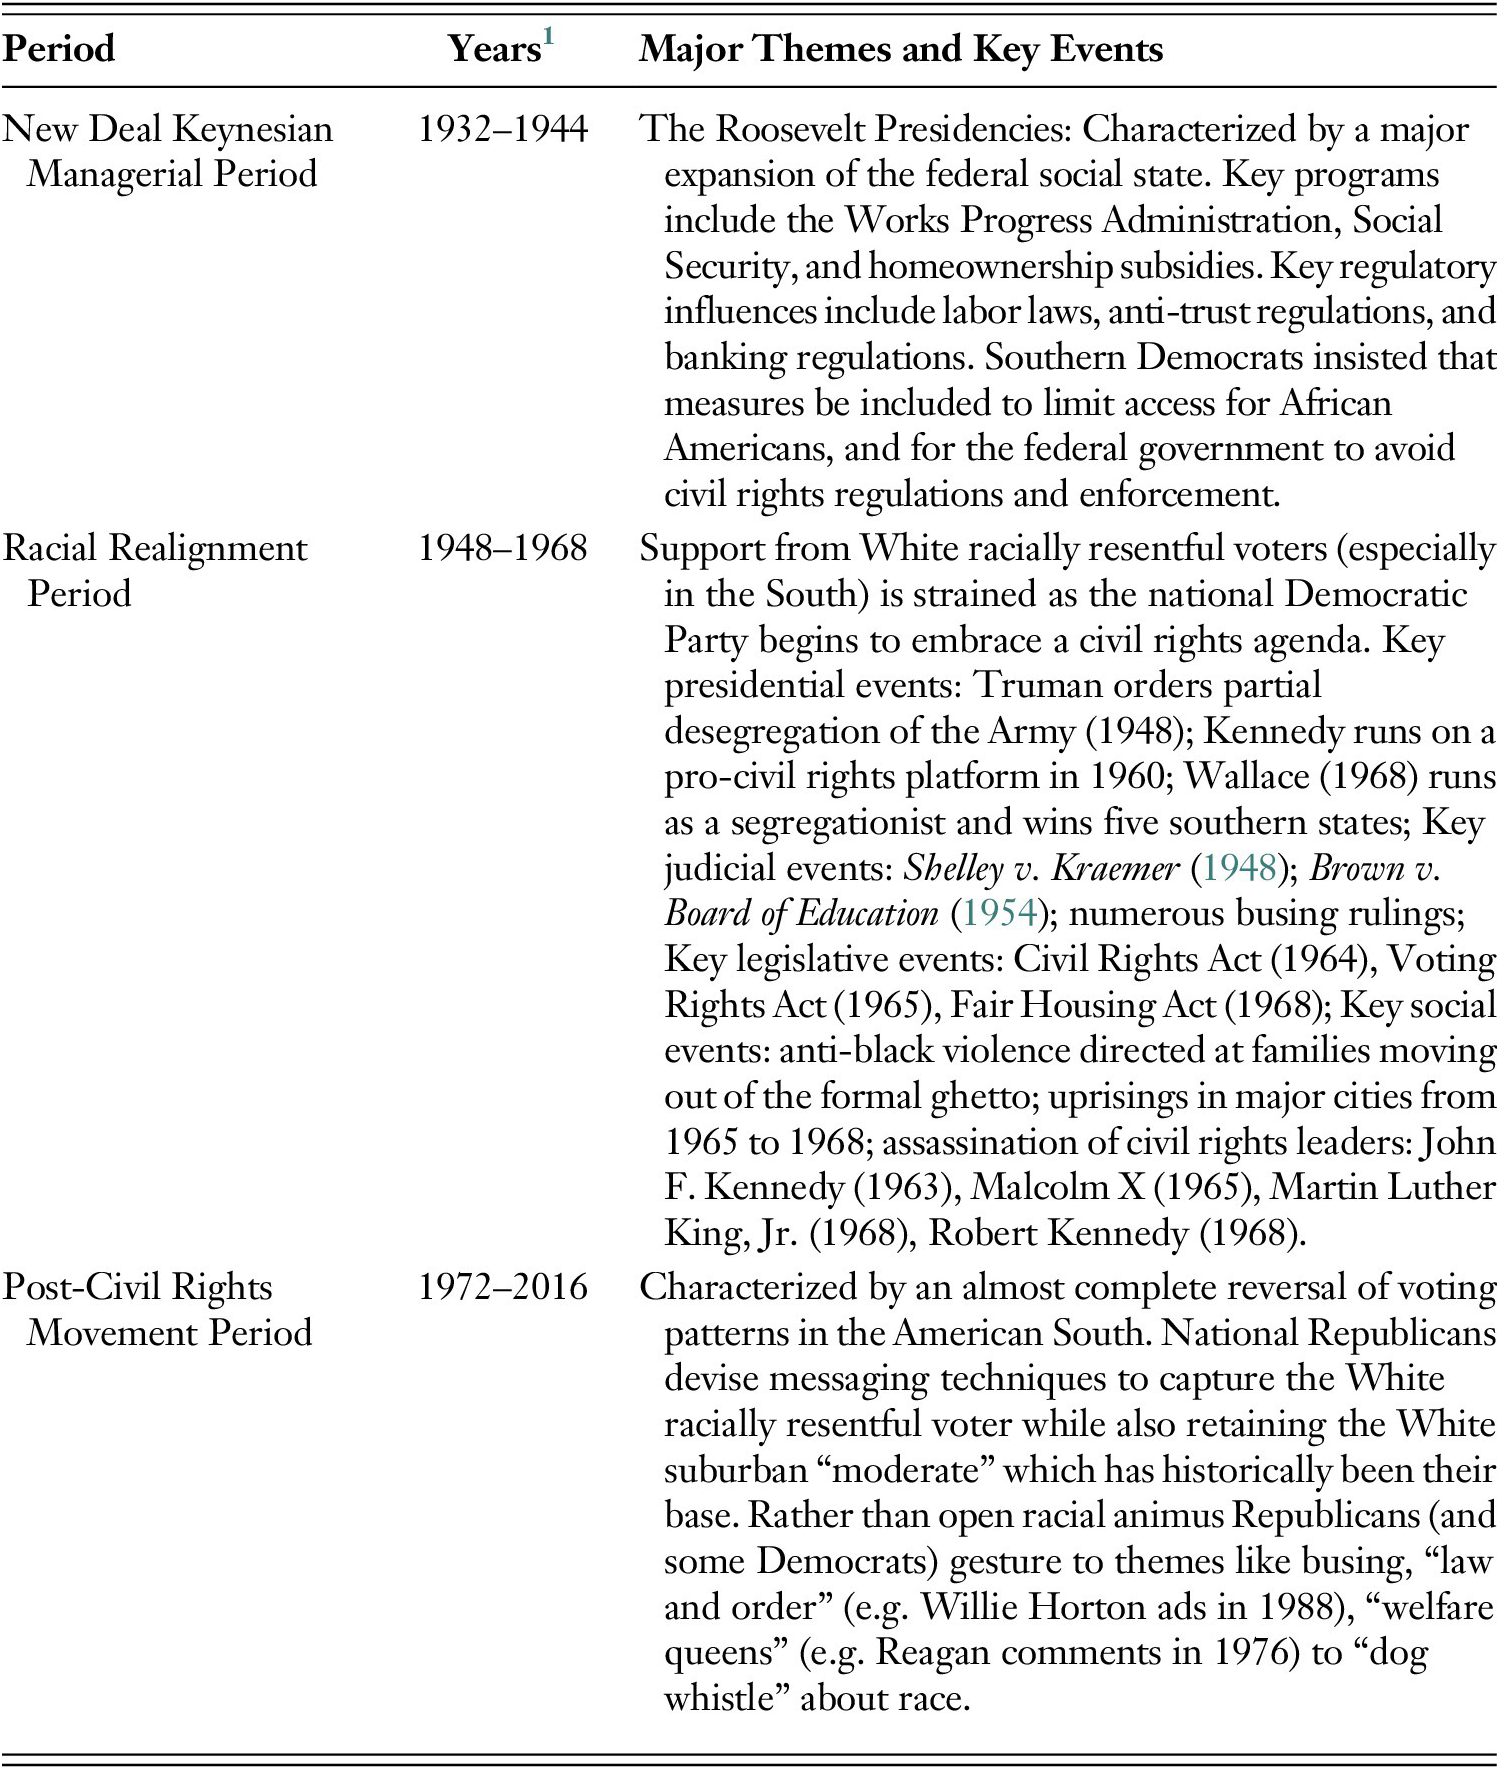
1 Refers to the presidential election years used to operationalize this period in this study. The actual transitions between periods was more fluid.
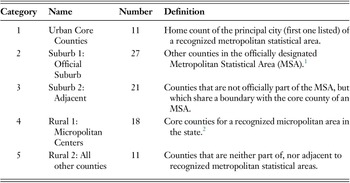
To assess change over time, I use county-level electoral data—the only scale of analysis available back to 1932. This county-level data was purchased from the Dave Leip presidential voting database—a digital record of presidential votes back to the origin of the country. The state’s counties were then divided into different categories and their election results compared over time. These categories are summarized in Table 2. First, I began with the contemporary metropolitan statistical area (MSA) boundaries in the state. The U.S. Census designates and continually revises the definition for MSAs.Footnote 2 Metropolitan statistical areas are groupings of counties whose total population exceeds 50,000 that are centered on one (sometimes several) major “principal city”. There are fourteen MSAs that either originate or spill into the state of Ohio as of 2018 (see Figure 1). In eleven of these cases, the core county is within the state boundary so it was counted as “category 1: urban core county”. Second, all other counties from the official metropolitan statistical area were counted as “official suburbs”. These counties have the strongest contemporary connection to the principal city in the MSA.Footnote 3 Third, there are twenty-one other counties in the state that were not officially part of an MSA but which share a boundary with the core county of an MSA. Though the connection was not strong enough for it to be counted as an “official county” by the U.S. Census, these counties do nonetheless share considerable proximity, labor market overlap, and often similar media. They are designated “adjacent”. The fourth category of counties are “micropolitan areas”. These counties contain fewer than 50,000 people and are often centered on a medium or large town. These will be referred to as “rural 1” counties. Finally, all counties that are neither part of, or adjacent to, the core county of a metropolitan or micropolitan area were counted as “rural 2”.
Typology of Ohio Counties.

1 MSA definitions were derived from the 2018 release available on the United States Census website (www.census.gov). Note also that three principal cities are located in West Virginia (Weirton, Wheeling, Huntington).
2 If it is both adjacent to an MSA core county, and a core county for micropolitan area, it was counted as “adjacent” (the idea being that metro city is more impactful than micropolitan area).
Spatial typology of Ohio counties.

Presidential election data at the county level in Ohio has both opportunities and limitations. Presidential elections have much higher turnout rates than local or state elections, so they are more a representative proxy for political attitudes than other elections. It is also true that Ohio has been and continues to be the focus of copious election advertising each cycle because it is a swing state. As such, its residents are particularly exposed to the viewpoints, rhetoric, and statements of the major candidates. That said, there are some limits to the approach used here, namely the spatial unit of analysis. Counties, particularly in Midwestern states like Ohio, are large spatial units that often contain “urban”, “suburban”, and “rural” communities. A county like Cuyahoga, for example, contains the city of Cleveland, some incorporated suburbs, and even some farmland. Counties are large units of analysis—in an ideal research world, we could evaluate voting changes at the precinct level and associate those findings with census data that align with those boundaries. In more recent years, such analysis is possible, but more historical work becomes impossible because the boundaries of smaller social units such as precincts and legislative districts change over time, and the availability of vote data at such a small scale is elusive for longer historical spans. Moreover, the U.S. Census uses a geography of tract and block boundaries, that both changes over time, and is difficult to align with electoral data particularly for more distant elections.
Thus, the reader should understand the findings through these limitations. First, the actual influence and size of “suburban” votes and communities is likely understated. The biggest counties in the state—Franklin, Cuyahoga, Hamilton—are classified as “large urban core” but contain dozens of incorporated suburbs within their boundaries that are as White and Republican-voting as the incorporated suburbs just beyond the county line. Put simply, the influence of “suburban” votes and reaction to the central city is even higher than the findings would suggest. Similarly, parts of the suburban counties surrounding major cities remain very rural, and certainly were during the New Deal period. Again, this would simply understate potential “suburban” findings. That is, if suburbs are indeed filled with purely “economic” conservatives, there should be evidence that such places are becoming more competitive in the post-Civil Rights period as the modern Republican Party is positioning itself against civil rights rhetoric and policy.
Figure 2 dissects Republican and Democratic presidential vote percentages by spatial type from 1932 to 2016. Several general patterns are evident from this visualization. First, votes for the two major parties have been competitive throughout the time period, but Republican votes have exceeded Democratic votes consistently in all places except for core counties. Even there, however, Republicans are more competitive than Democrats have been in rural areas since the 1960s. Second, several apparently-strong years for Democrats—1968, 1992, and 1996—were strong only because of a strong third-party candidate. Third, suburbs have become a more important part of the conservative coalition since the Civil Rights Movement (Figure 3). Between 1970 and 2016, the state grew by an anemic 8.8%, but this was geographically uneven with most growth occurring in the suburbs. But while the state’s official suburbs grew by 36.6% between 1970 and 2016, Republican votes for president grew by almost twice that (68.9%) between 1972 and 2016. Moreover, and not surprising, the suburbs have become an even larger component of the Republican coalition in the state. In 1972, they constituted 32.8% of the Republican vote total for president, but by 2016 that figure had grown to 47.6%. In recent years, suburbs have begun to eclipse core counties in size and political influence. 1992 was the last year that core counties constituted half or more of Republican votes. By 2008, suburbs had begun to outnumber core counties by themselves, and this trend has only grown since then.
Presidential vote percentages in Ohio regions, 1932–2016 (Source: Dave Leip Presidential Election Database).

Sources of Republican Presidential Votes in Ohio Elections, 1932 to 2016

Table 3 aggregates all votes for each party during the New Deal and compares them to the post-Civil Rights period, by spatial category. The suburbs are where the greatest shifts away from the Democratic Party occurred after it embraced a civil rights agenda. Official suburbs and adjacent areas experienced double digit shifts away from the Democratic Party. Rural areas of the state experienced much less of a shift because they were already pretty resistant to voting for the New Deal Democratic Party in the first place. The rural areas of the state tend to be dominated by small, independent farmers, whereas the core areas contained many unionized workers who embraced the New Deal agenda. Given the amplifying role of the aforementioned population growth, the suburbs of Ohio (like many other states) are the center of the Conservative Coalition there.
Shifts in Ohio presidential voting, by spatial category, 1932–1944 versus 1972–2016 (Source: Dave Leip Presidential Voting Database, 1932–2016).

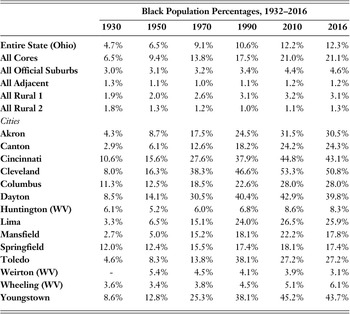
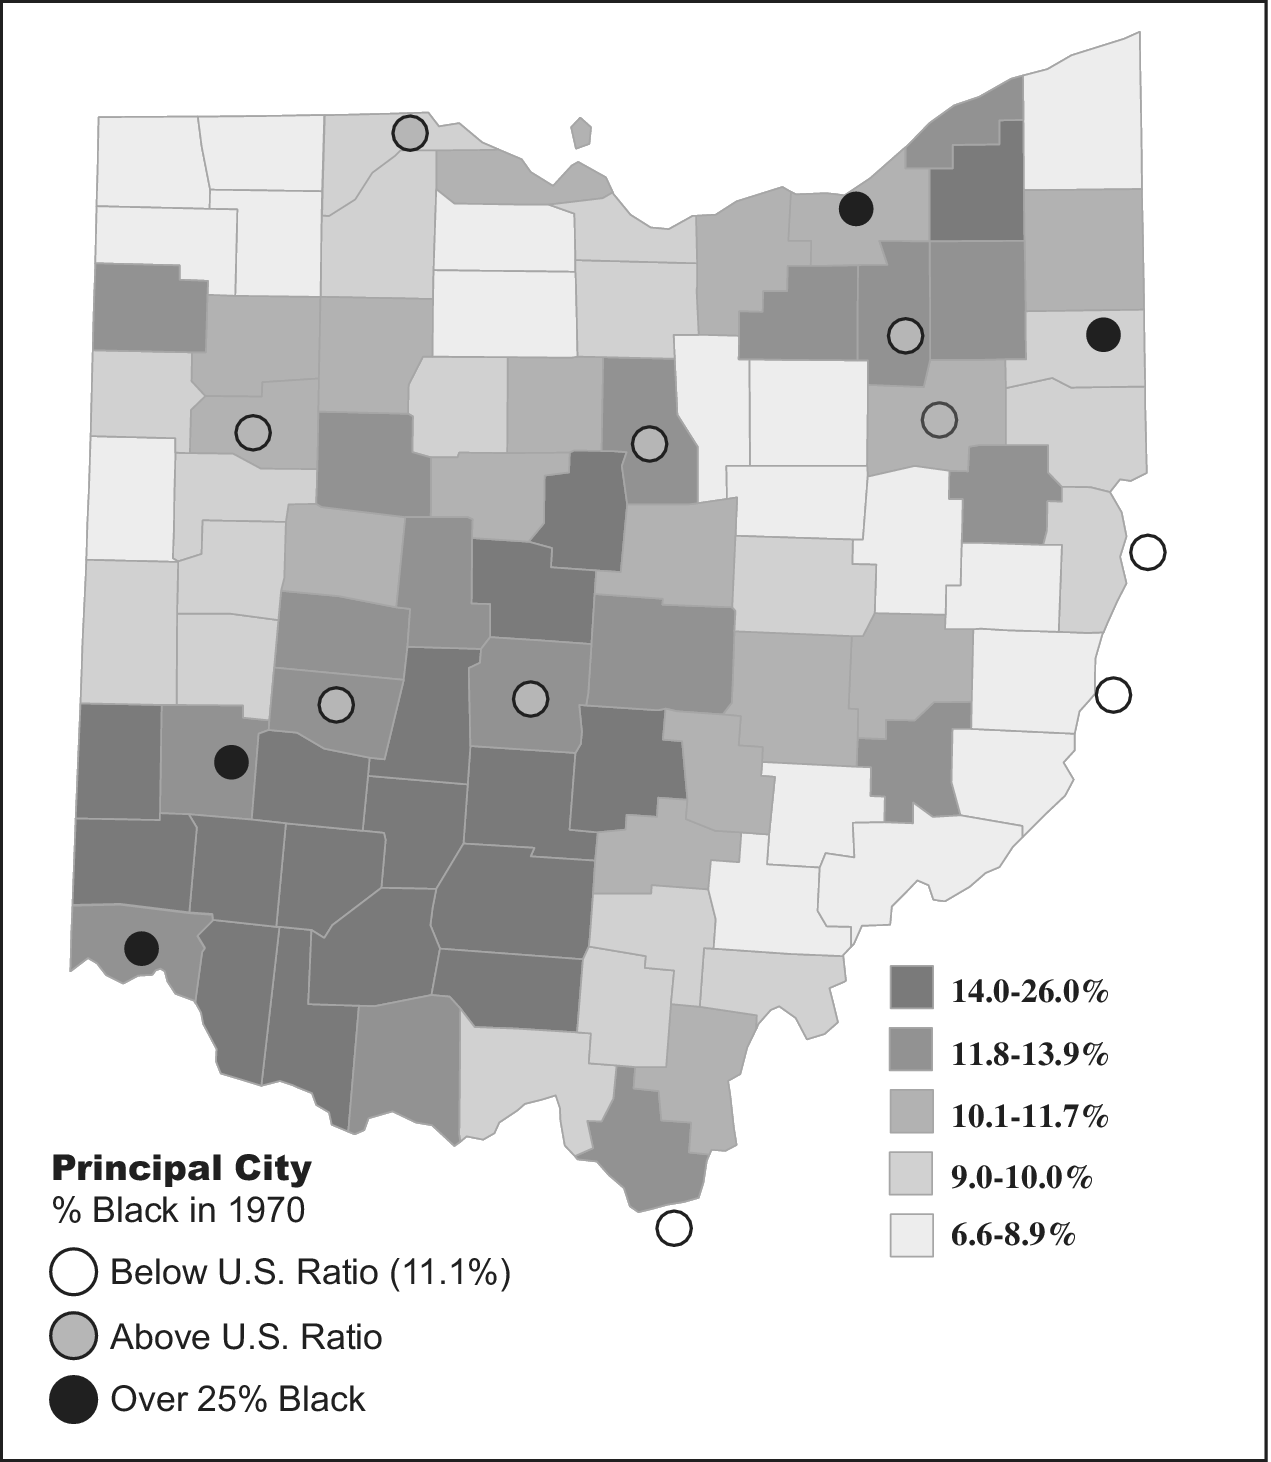
A strict MTPC interpretation of these patterns might accurately posit that the counties that are now “official suburbs” were rural areas during the New Deal and that the swing toward conservativism is simply a spatial class realignment—with middle class urban dwellers moving to newly built subdivisions in surrounding counties after the 1970s. That is indeed the case to a certain extent, but the demographic nature of the cities from which they fled is also worthy of attention. During the New Deal period, the state was Whiter than the national average (Table 4). It only reached the national percentage of Black population in the 1990s, but much earlier than this, the state’s main cities became significantly more African American—in some cases majorities. In all cases, the cities of Ohio had fairly small Black populations in the 1930s and 1940s, but as the second wave of the Great Migration began to unfold, some cities, namely Cincinnati, Dayton, Cleveland, Columbus, and Youngstown became significantly more Black quickly. In some cases (Cleveland, Dayton, Columbus) Black politicians were elected and significant battles over school boundaries ensued. Other cities like Lima, Mansfield, and Toledo experienced a spike in the Black population later in the 1980s and 1990s. Still others, like the West Virginia border cities, contained very small Black populations during the New Deal, and they remain small today. Virtually everywhere else in the state—suburbs and rural areas—were overwhelmingly White during the New Deal and remain so today. The shift in suburban votes to Republican candidates is particularly pronounced in the areas surrounding cities that became large-minority or majority Black. This effect was most acute in the southwestern corner of the state. The statewide shift away from Democrat presidential candidates from the New Deal to post-Civil Rights period was 10.6 points, but the suburbs of Cincinnati lurched 20.7 points, and Dayton 13.2 points away respectively. These shifts were notably less pronounced in the rural areas surrounding Whiter cities like Huntington, in part because those areas (the official suburbs) voted more consistently for Republicans during the New Deal.
Black population percentages in selected Ohio spaces, 1932–2016 (Source: United States Census of Population).

In short, the spatial coverage of the Democratic base in Ohio has shrunk considerably since the Civil Rights Movement. It is now overwhelmingly contained in the state’s main cities, which also happen to be the most African American spaces. All other spaces in the state shifted (in the case of suburbs) or remained (as in the case of rural spaces) significantly Republican since the 1960s.
SUBURBAN CONSERVATISM IN OHIO AS A LONG WAVE THREAT REACTION
The three aforementioned paradigms provide a way to understand these socio-spatial shifts. Like the remainder of the United States, social and political conditions were tumultuous in and around large Ohio cities during the 1960s. The demographic bedrock of this tumult was the large-scale movement of Black people to northern cities in search of jobs and a better life. Within a span of a decade, some cities like Cincinnati, Dayton, and Cleveland became home to a substantial number of African Americans where very few had lived before. Black people arrived to find substantial juridical and interpersonal obstacles to good employment, housing, and respectful treatment by law enforcement. Many White citizens of these cities supported these obstacles and believed that their new Black neighbors were a threat to their safety. African American voters, inspired by the Civil Rights Movement, were not willing to take such incivility in an obsequious way. Political organization in the Black community was active in the 1960s. Black city council people were elected, and eventually Black mayors followed. Cleveland, Dayton, and Cincinnati all had Black mayors by 1972; Columbus, Youngstown and Toledo followed suit by the 1990s. More often (and sometimes even in these cities), Black people protested the lack of Black leadership. In Cincinnati, for example the Black community vociferously complained about the reduction of Black council members and school board members that occurred after redistricting in the mid-1960s (which was widely seen as intentional) (NACCD 1968a). The Black community in Cincinnati and other cities felt that White politicians were either insufficiently concerned with their wishes for better treatment from police, better housing, and better education, or were actively working to maintain such unequal conditions. These tensions erupted into violent conflict in a number of Ohio cities. The Kerner Commission report (NACCD 1968a) remains the most complete public catalogue of conflict during this period. Ohio cities are featured prominently in the document. The document identified “serious” disorders in Dayton and Toledo, and “minor” disorders in Cleveland, Columbus, Hamilton (Cincinnati MSA), Lima, Lorain (Cleveland MSA), Massillon, and Sandusky.Footnote 4 Several cities—Cincinnati, Cleveland, Dayton—had multiple uprisings of different severity. One city, Cincinnati, was given special attention as one of the eight American cites with a “major” disorder.Footnote 5 Common predicates for social disorder were police violence against Black people, and unfair court decisions. Lives were lost in the Cleveland and Cincinnati uprisings. Millions of dollars of property damage and hundreds of arrests took place in the other Ohio cities. Civil conflict was rife in Ohio throughout the 1960s—particularly in 1967. According to surveys done by the Kerner Commission, views about why these conflicts occurred broke acutely along color lines: most Black people viewed these events as outcomes of racial oppression, while most White people saw these events as the acts of “outside agitators” and criminals who should go to jail (NACCD 1968b).
While the direct violence of uprisings triggered threat reactions by White northerners to a great extent, there were more subtle judicial battles behind the scenes that arguably had even more impact on triggering White resentment and pushing political realignment. The battle over school desegregation—or “busing”—was by far the most important such battle. As Orfield (Reference Orfield1978) wrote, “busing was the last important issue to emerge from the Civil Rights Movement of the 1960s and the only one to directly affect the laws of large numbers of Whites outside the South” (p. 1). Busing was and remains a divisive topic along sharp racial lines. Many Black people viewed it as an imperfect, but necessary reparative device that would ameliorate segregation, while many White people viewed it as a heavy-handed assault on their ability to control the racial make-up of their local school (Delmont Reference Delmont2016; Olson Reference Olson2002). Following the Brown v. Board of Education decision (1954), lower court judges finally began (a decade later) to issue orders for school districts throughout the North to achieve racial balance. Busing children to adjust the balance emerged as one desegregative method. Prior to 1974, the direction of federal courts suggested that some of these orders would apply not just to single school boards (e.g., Cleveland School District only), but also to all nearby school boards even if they were in a different municipality. By the 1970s, school districts had begun planning to bus children across school district lines as the level of separation was often greater across districts than within them. But the Milliken v. Bradley (1974) Supreme Court decision effectively ended this possibility. In Milliken, the Court overturned a lower court order to desegregate regionally, making it effectively impossible to bus across district lines (Delmont Reference Delmont2016). The primary collective response of White people was to move to a different municipality and/or a surrounding county where such orders were not valid (Hackworth Reference Hackworth2021a). This response too was uneven—it motivated White residential choice in the very places that Black people were most numerous (e.g., Cincinnati, Cleveland, Dayton), but not as much in the nearly all-White industrial regions of southeastern Ohio. Democrats held many different positions on busing. Conservative northern Democrats like Senator Joe Biden and the entire southern Democratic congressional delegation actively contested busing as a method. Others, hoping to capture the increasingly large Black population in the North, were either silent or supportive of school integration which further fueled the political animosity of fleeing Whites.Footnote 6 But because of the concentration of Black populations and political power, it was not just that White people saw the Democratic Party as associated with Black people. In the Midwest, White suburbanites increasingly associated the Democratic Party with the Black city and continued voting for Republicans as they took more rigidly hostile stances toward that city. The reactive threat was thus concentrated in and around a number of key cities. Meigs County in southern Ohio, for example, did not have a busing order, and even if it did, it would not have resulted in “integration” because nearly everyone in the county is White. But as of 1976, the cities of Akron, Dayton, Cincinnati, Cleveland, Columbus, and Youngstown had all been ordered by the courts to desegregate (and all had appealed these orders) (Wooten Reference Wooten1976).Footnote 7 Resentment among middle class Whites in the North was intense even if it (mostly) avoided the toxic language and messaging of Jim Crow (Delmont Reference Delmont2016).
Thus, by the mid-1970s there was considerable conflict around schooling, policing, and housing issues, particularly in and around the cities to which Black people had moved in greatest numbers. In Ohio, therefore, the reactionary lurch away from the Democratic Party around Cincinnati, Dayton, and Cleveland was greater than the suburbs in southeastern Ohio. Simultaneous to this, figures in the Conservative Movement started to devise ways of capturing this resentment to provoke realignment. Initially this consisted of “law and order” local officials campaigning against crime following the uprisings of 1967, but eventually extended to national politicians. In 1968, Richard Nixon (Reference Nixon1968) famously sneered that the Kerner Report “blamed everyone except the rioters” in an attempt to capture the resentful suburban Midwestern voter, but because segregationist George Wallace was also in the race, Nixon’s subtle ploys were not able to attract the racially resentful vote en masse. Wallace’s racist rhetoric led him to five state-level victories, but it also delivered electoral dividends in the suburbs surrounding Ohio’s most African American cities (Figure 4). White suburban Democrats who were disaffected by their party’s embrace of the Civil Rights Movement gravitated toward Wallace’s campaign and have still never returned. In some counties near Cincinnati and Dayton, he drew as much as 25% of the vote—the highest totals outside of the American South.
Vote percentages for George Wallace in the 1968 Presidential Election
(Source: Dave Leip Presidential Vote Custom Database).
By 1972 however, Nixon’s political consultants—Lee Atwater, Paul Manafort, and Roger Stone—honed “dog whistling” techniques to attract the resentful Wallace voter without alienating moderates. Nixon went on to rout his Democratic competitor, George McGovern, in 1972 by tapping into the resentment that Wallace had captured. Lee Atwater, later in this life, explained what their strategy was in an oft-quoted passage from a Rick Pearlstein interview. As his execrable comments indicate, they were particularly designed to provoke the northern White (former) Democrat who was incensed by issues like busing. “You start in 1954 by saying ‘nigger, nigger, nigger’”, Atwater admitted:
By 1968 you can’t say ‘nigger’—that hurts you. Backfires. So you say stuff like forced busing, states’ rights, and all that stuff. You’re getting so abstract now, you’re talking about cutting taxes, and all these things you’re talking about are totally economic things and a by-product of them is, Blacks get hurt worse than Whites. And subconsciously maybe that is part of it. I’m not saying that. But I’m saying that if it is getting that abstract, and that coded, what we are doing away with the racial problem one way or the other. You follow me—because obviously sitting around saying, ‘We want to cut taxes and we want to cut thus’, is much more abstract than even the busing thing, and a hell of a lot more abstract than ‘nigger, nigger’. So any way you look at it, race is coming on the back burner (quoted in Perlstein Reference Perlstein2012).
Atwater’s colleague in the Nixon White House, John Ehrlichman, later elaborated on what the political value of this messaging was. When asked by journalist Dan Baum in 1994 to explain the political rationale for his administration’s War on Drugs, the Nixon insider responded:
You want to know what this was really all about? The Nixon campaign in 1968, and the Nixon White House after that, had two enemies: the antiwar left and Black people. You understand what I’m saying? We knew we couldn’t make it illegal to be either against the war or Black, but by getting the public to associate the hippies with marijuana and blacks with heroin, and then criminalizing both heavily, we could disrupt those communities. We could arrest their leaders, raid their homes, break up their meetings, and vilify them night after night on the evening news. Did we know we were lying about the drugs? Of course we did (quoted in Baum Reference Baum2016).
While Ehrlichman was willing to make such admission nearly twenty years after Nixon left office, most conservatives strenuously deny that the focus on crime has anything to do with race. But these denials looked far-fetched against the backdrop of figures like Presidents Reagan and Bush. They look transparently absurd against the backdrop of President Trump. Reagan, both Bushes, and of course Trump, have continued using these messaging techniques. The idea, as Atwater and others explain, is to animate the racially resentful voter while also providing the self-conscious White suburban voter the plausibly deniable cover to insist that their party is not racist. By invoking the imagery or idea of Black urban danger they produce a bonding capital that serves to bring together the Conservative Movement’s various factions (Hackworth Reference Hackworth2019b). When Trump invokes the danger of “Black on Black crime” in Chicago, or gestures to the failures of places like Flint and Baltimore, he is doing the same thing that Nixon and Reagan were doing when they invoked “disorder” and “welfare queens”. He is reproducing a fear of dysfunction and criminality that many White suburban Midwestern voters have about the main city in their region. It has kept the “group threat” alive many years after the initial conflicts and migrations that served as its basis. This strategy has served as the bedrock of conservatism in Ohio and the Midwest in general where Black populations are particularly urbanized and abundant compared to other regions—thus easier to caricature as an imminent threat by invoking language of the urban (Hackworth Reference Hackworth2019a).
CONCLUSION
A common way to explain the rise of political conservatism in the United States is the Materialist Theory of Political Change. The MTPC argues that structural disruptions in the 1970s undermined the credibility of Keynesianism and set the stage for political entrepreneurs to institute its neoliberal replacement. Though it is often framed in a general way, the micro-spatial corollary of this theory is that conservatism was increasingly popular in America’s suburbs because those spaces were becoming increasingly occupied by the beneficiaries of neoliberalism—relatively high-income families seeking to reduce their taxes and social obligations. There is more than a kernel of truth to this narrative, but I argue it is incomplete—namely in the sense of not adequately explicating the role of racial resentment at driving suburbanites toward conservativism after the Civil Rights Movement. A mix of group threat, Du Boisian racial economy, and critical historiography provides an amendment to, rather than a replacement of, the MTPC. White suburbanites were not only fleeing higher taxes—they were fleeing active attempts to integrate their neighborhoods and schools. Few White suburbanites openly invoke the language of racial resentment when explaining their political preferences, but sociologists have long interpreted such denials as “social desirability bias” rather than the actual absence of animus. The initial triggers were demographic in-movement, political succession, and violent conflict in the 1960s and 1970s, but the Republican Party eventually mastered the ability to reproduce this resentment in coded ways that last to the present moment and have led to figures like Donald Trump. This article is based on a case study of Ohio, but many of the patterns exhibited are at least generalizable to the remainder of the American Midwest—where cities became more non-White and suburbs swelled with White refugees after the Great Migration. As importantly, spaces like Ohio hold such importance as competitive spaces that hold an outsized role in American national elections. In short, conservatism is not fully explained by a general turn toward neoliberal economic policy. Other elements of the Conservative Movement matter—namely race-based reaction that has paid enormous dividends for Republican political officials since the 1970s. This form of reaction was more responsible for the suburbanization of conservatism than the MTPC and other theories would suggest.