Introduction
Bryoria fuscescens s. lat., as understood in Europe, is a taxonomically difficult group composed of morphologically similar lichens which have been named as B. chalybeiformis, B. fuscescens, B. implexa, B. lanestris, and B. subcana. Although each of these species has been differentiated by chemical and morphological features, specimens with intermediate characters are frequent and prevent confident identifications. Preliminary molecular phylogenetic studies on material morphologically conforming to Bryoria fuscescens from the mountains in central Spain and Turkey, conducted in 2007, suggested a mismatch with the chemotypes as revealed by thin-layer chromatography (Hawksworth et al. Reference Hawksworth, Crespo, Rico and Ruibal2011). Independently, Myllys et al. (Reference Myllys, Velmala, Holien, Halonen, Wang and Goward2011a ), from studies based on material from a wide geographical range rather than discrete populations, reported a similar mismatch and obtained an unresolved phylogenetic tree for some Bryoria sect. Implexae species, and subsequently suggested that many of the recognized species were conspecific (Myllys et al. Reference Myllys, Velmala and Holien2011b ).
Chemistry has traditionally been emphasized in species separations in Bryoria, and was used in major treatments in the 1970s (e.g. Brodo & Hawksworth Reference Brodo and Hawksworth1977). The prevailing view, as noted by Krog (Reference Krog1980), was that “morphological plasticity in the genus Bryoria makes it necessary to focus on chemical characters in the final delimitation of the species”. By the late 1980s, however, it was starting to become evident that some chemotypes should not be separated as different species (Holien Reference Holien1989). Certain specimens, however, are now being found which contain a range of extrolitesFootnote 1 , such as psoromic, norstictic or fumarprotocetraric acids, which are chemically very similar. Caution in the use of structurally very similar compounds in species separation has previously been expressed (Hawksworth Reference Hawksworth1976; Lumbsch Reference Lumbsch1998). Molecular sequence data now afford a method of assessing phylogenetic relationships independently from morphological and chemical characters. As experience with other lichens in Parmeliaceae has demonstrated, intensive sampling of populations is necessary to fully understand their variability (e.g. Del-Prado et al. Reference Del-Prado, Divakar and Crespo2011). In order to determine whether chemistry was indeed a robust character for species delimitation in Bryoria fuscescens s. lat., we investigated the relationship between chemotype (the suite of extrolites in a specimen) and genetic kinship as inferred by the ITS rDNA sequences in three populations conforming morphologically to Bryoria fuscescens s. str., from the mountains of the Sistema Central in Spain. Furthermore, in order to ascertain if there was variation in the chemical products detected in different parts of the specimens, or if single specimens were of intermixed genotypes or “mechanical hybrids” (Hawksworth Reference Hawksworth1988), we separated each specimen into four different portions which were examined separately.
Materials and Methods
Three populations conforming morphologically to Bryoria fuscescens s. str., collected in the Sistema Central mountains of Spain, were studied. All specimens sampled had dark coloured thalli, paler basal parts, acute branching angles, pseudocyphellae which were inconspicuous or absent, and fissural as well as tuberculate soralia. In collecting, care was taken to avoid other Bryoria species or specimens with different morphological characteristics:
-
1) Segovia: La Granja de San Ildefonso, Sierra de Guadarrama, between Puerto de Cotos and Puerto de Navacerrada, 40°47'34·97"N / 03°59'12·62"W, 1854 m, 25 May 2012, C. G. Boluda & V. J. Rico (MAF-Lich. 18863, 18865, 18923-18932; GenBank accession numbers KJ652402 to KJ652413).
-
2) Madrid: Navacerrada, Sierra de Guadarrama, La Barranca, 40°46'06·3"N / 03°59'04"W, 1580 m, 11 July 2012, C. G. Boluda & V. J. Rico (MAF-Lich. 18862, 18933-18946; GenBank accession numbers KJ652414 to KJ652428).
-
3) Ávila: Navarredonda de Gredos, Sierra de Gredos, Pinar de Navarredonda, near the Parador Nacional de Gredos, 40°21'10"N / 05°06'45"W, 1550 m, 1 July 2012, V. J. Rico (MAF-Lich. 18947 to 18961; GenBank accession numbers KJ652429 to KJ652443).
All three sites were of uneven-aged Pinus sylvestris forests over granite, and the specimens were restricted to mature P. sylvestris trunks. The lichen community belonged to the Pseudevernion furfuraceae (James et al. Reference James, Hawksworth and Rose1977), and was dominated in these sites by Hypogymnia farinacea, Parmelia serrana, P. sulcata, Platismatia glauca, Pseudevernia furfuracea, and less abundantly Tuckermannopsis chlorophylla.
Fifteen discrete specimens were collected in each site. Three of those from the Madrid locality, however, were subsequently rejected due to the presence of the lichenicolous fungus Phacopsis huuskonenii, a species not previously published as occurring in Spain. For each of the remaining 42 samples, four thallus regions were cut and examined separately: 1) the base (the oldest part, usually in contact with the bark); 2) the median zone (middle of the branches, but with soralia removed); 3) the tips (the last 5 mm of the branches); and 4) the soralia. In total, 168 subsamples (42×4) were analyzed, using the same material for TLC and DNA extraction.
For the phylogenetic tree reconstruction, Bryoria glabra (Finland, GenBank accession number HQ402725.1) was used as outgroup (Myllys et al. Reference Myllys, Velmala, Holien, Halonen, Wang and Goward2011a ).
Extrolite chemistry
Spot tests were made using C, K, KC, and Pd, and TLC was performed using standard methods (Orange et al. Reference Orange, James and White2010). For the TLC, concentrated lichen extractions in acetone were spotted onto silica gel 60 F254 aluminium sheets (Merck, Darmstadt) and run with the solvents A, B, C and G. Spots were visualized under UV and after a sulphuric acid spray.
Molecular and bioinformatics techniques
DNA was extracted using the DNeasy Plant Mini Kit (Qiagen, Barcelona) with a slight modification to the manufacturer’s instructions (Crespo et al. Reference Crespo, Blanco and Hawksworth2001). The fungal ITS rDNA region was amplified using the primers ITS1FKYO2 (TAG AGG AAG TAA AAG TCG TAA) and ITS4KYO2 (RBT TTC TTT TCC TCC GCT) (Toju et al. Reference Toju, Tanabe, Yamamoto and Sato2012). For amplification, we used a reaction mixture of 25 µl, containing 18 µl of sterile water, 2·5 µl of 10× buffer with 2 mM MgCl2, 0·5 µl dNTPs (10 mM of each base), 1·25 µl of each primer at 10 µM, 0·625 µl of DNA polymerase (1U µl−1), and 5 µl of diluted 1/10 DNA template. For any failed samples the PCR was repeated using PuReTaq Ready-To-Go PCR Beads (2·5 U of PuReTaq DNA Polymerase, 200 µM of each dNTP, BSA, buffer reaction and stabilizers: 10 mM Tris-HCl pH 9·0, 50 mM KCl, 1·5 mM MgCl2; GE Healthcare, Little Chalfont, UK), adding to the lyophilized bead 20 µl of sterile water, 1 µl of each primer at 10 µM and 3 µl of diluted 1/10 DNA template.
The amplifications were run in an automatic thermocycler (XP Cycler, Bioer, Hangzhou) using the following parameters: initial denaturation 5 min at 95 °C, then 35 cycles of 1 min at 95 °C, 1 min at 56 °C, 1·5 min at 72 °C, and a final extension of 10 min at 72 °C. PCR products were cleaned using illustraTM ExoProStar (GE Healthcare, Little Chalfont, UK), according to the manufacturer’s instructions. Sequencing was performed by the Unidad de Genómica (Parque Científico de Madrid) and Stabvida (Lisbon, Portugal).
DNA sequences obtained were manually adjusted using SeqMan version 7.0 (DNAstar, Madison) and MEGA5 (Tamura et al. Reference Tamura, Peterson, Peterson, Stecher, Nei and Kumar2011). For genetic analyses, only one sequence per specimen instead of four was used, selecting the sequences belonging to the basal portion as those would be of the haplotype when the thallus started to grow. The alignment was performed using MAFFT version 7 (http://mafft.cbrc.jp/alignment/server/; Katoh & Standley Reference Katoh and Standley2013), using G-INS-I alignment algorithm, a scoring matrix of 1PAM/k=2, and offset value of 0·1. Gblocks version 0.91b (Barcelona; http://molevol.cmima.csic.es/castresana/Gblocks_server.html) was used to delete non-conserved GAPs, allowing smaller final blocks, gap positions within the final blocks, and less strict flanking positions, which resulted in the elimination of a single gap in the outgroup. The alignment was analyzed using maximum likelihood (ML) and Bayesian (B/MCMC) approaches. For the maximum likelihood (ML) tree reconstruction, we used the program RAxML v7.2.8 (Stamatakis Reference Stamatakis2006). The GTRGAMMA model was applied, which includes a parameter (Γ) for rate heterogeneity among sites, and we chose not to include a parameter for estimating the proportion of non-variable sites (Stamatakis Reference Stamatakis2006; Stamatakis et al. Reference Stamatakis, Hoover and Rougemont2008). Analysis was performed using RAxML v7.2.8, as implemented on the CIPRES Science Gateway (http://qball2.sdsc.edu:7070/portal2/home.action; Miller et al. Reference Miller, Pfeiffer and Schwartz2010) with the GTRGAMMA model as described above. Support values were assessed using the ‘rapid bootstrapping’ option with 1000 replicates. For the Bayesian reconstruction, MrBayes v3.2.1 (Ronquist & Huelsenbeck Reference Ronquist and Huelsenbeck2003) was used. The analysis was performed assuming the general time reversible model (Rodríguez et al. Reference Rodríguez, Oliver, Marín and Medina1990), assuming a discrete gamma distribution with six rate categories (GTR+G). The nucleotide-substitution model and parameters were selected using the Akaike Information Criterion as implemented in jModelTest (Posada Reference Posada2008). A run with four million generations, starting with a random tree and employing eight simultaneous chains, was executed. Every 400th tree was saved to a file. We plotted the log-likelihood scores of sample points against generations using TRACER v1.5 (Rambaut & Drummond Reference Rambaut and Drummond2007) and determined that stationarity had been achieved when the log-likelihood values of the sample points reached an equilibrium value (Huelsenbeck & Ronquist Reference Huelsenbeck and Ronquist2001), discarding the trees obtained before stationarity was reached. Posterior probabilities (PPs) were obtained from the 50% majority-rule consensus of sampled trees after excluding the initial 25% as burn-in. The phylogenetic tree was drawn using FigTree v1.4 (Rambaut Reference Rambaut2009).
For the haplotype network reconstruction, TCS v1.2.1 was employed, using gaps as missing data and 95% as the connection limit. We used DnaSP v4.50 (Librado & Rozas Reference Librado and Rozas2009) to calculate estimates of genetic diversity. PAUP 4.0 was used to calculate the haplotype diversity, number of polymorphic sites, nucleotide diversity, Tajima’s D value, Fu’s F statistic, and the raggedness index. For genetic comparison among predefined groups, the AMOVA test was implemented in Arlequin v3.5 (Excoffier et al. Reference Excoffier, Laval and Schneider2005), comparing differences among chemotypes and among populations. In order to test if there was a definite correlation between chemotypes and haplotypes, we performed a Fisher’s exact test implemented using the R package (R Development Core Team 2012).
Results
Chemical investigations
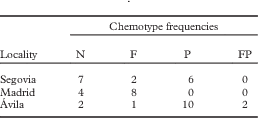
Four extrolite profiles were found: 1) norstictic and connorstictic acids; 2) fumarprotocetraric, protocetraric, and psoromic acids; 3) protocetraric and fumarprotocetraric acids only; and 4) psoromic acid only (Table 1). We did not detect atranorin in this study; this compound is known to occur sporadically in various Bryoria species (e.g. Myllys et al. Reference Myllys, Velmala and Holien2011b ) but is generally at low concentrations and not found in routine TLC. Although the three populations were in the same macroenvironment, there were marked differences in the percentage abundance of each chemotype. In some cases, two specimens collected close together, and apparently in the same microenvironment, had different extrolite profiles.
Chemotype frequencies in the 42 specimens of Bryoria fuscescens examined from 3 separate populations collected in 3 localities

N=norstictic and connorstictic acids, F=fumarprotocetraric and protocetraric acids, P=psoromic acid, FP= fumarprotocetraric, protocetraric and psoromic acids
TLC did not reveal differences in the presence /absence of extrolites in the four thallus regions, nor between the soralia and other parts of the thallus, except in two specimens. One had protocetraric, fumarprotocetraric, and psoromic acids in all parts of the thallus, except that the base lacked psoromic acid, while the other contained protocetraric and fumarprotocetraric acids except for the soralia which additionally contained psoromic acid. Although TLC indicates a homogeneous extrolite distribution along the thallus (with the exception of these two specimens), this may not be conclusive, as autofluorescence studies indicate that there can be chemical heterogeneity within thallus portions (Boluda et al. Reference Boluda, Rico and Hawksworth2014). For example, norstictic acid is commonly only present in soralia and inconspicuous pseudocyphellae, while fumarprotocetraric acid can be restricted to soralia. TLC of acetone extracts from thallus portions cannot detect such small-scale heterogeneic distributions. The results in the current study therefore have to be interpreted as indicating that, while there is generally no variation in extrolite composition from the base to the tips, they cannot exclude the possibility of heterogeneous small-scale distribution within thallus portions.
Molecular investigations
The amplified PCR products obtained were around 800 bp. Usually this PCR product is about 600 bp; the difference in size found in our samples was due to the presence of insertions of about 200 bp identified as group I introns (Gutiérrez et al. Reference Gutiérrez, Blanco, Divakar, Lumbsch and Crespo2007) at the 3' end of the SSU rDNA. We excluded group I introns as well as the SSU and LSU neighbouring regions of the ITS from the analysis.
The ITS sequences of the four thallus portions of each of the 42 specimens (42×4) revealed three cases of intra-thalline diversity (7·14% of the samples). These specimens were composed of two different genotypes, which were also present in other specimens from the same populations. In one specimen, the genotypes alternated among the four thallus portions, but in the other two the median zone contained a different genotype. In these three specimens, the extrolites were the same in all four segments tested. This result suggests that what seems to be a discrete and independent thallus can be composed of two or more intermixed genotypes.
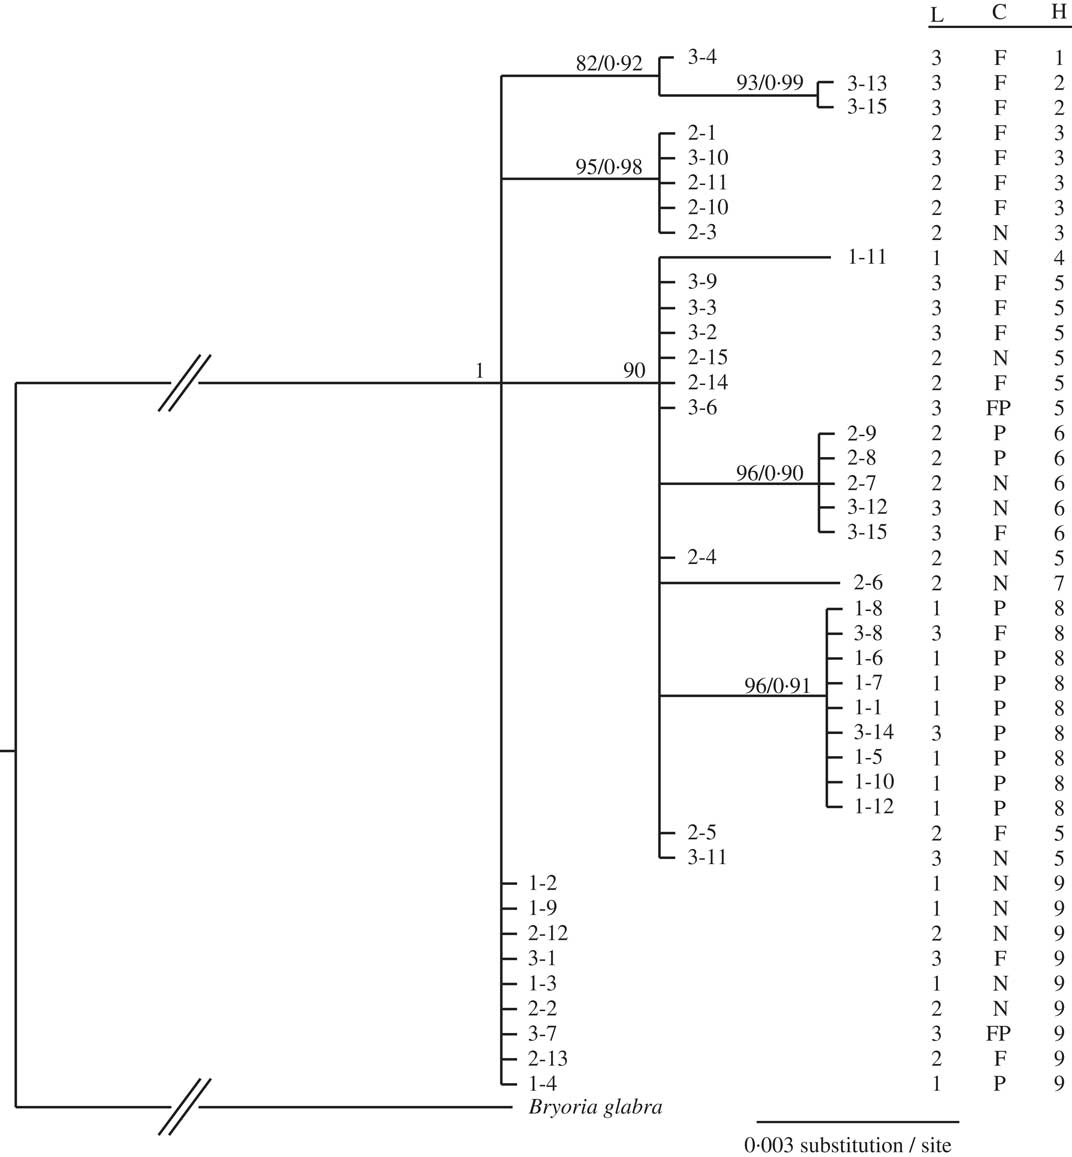
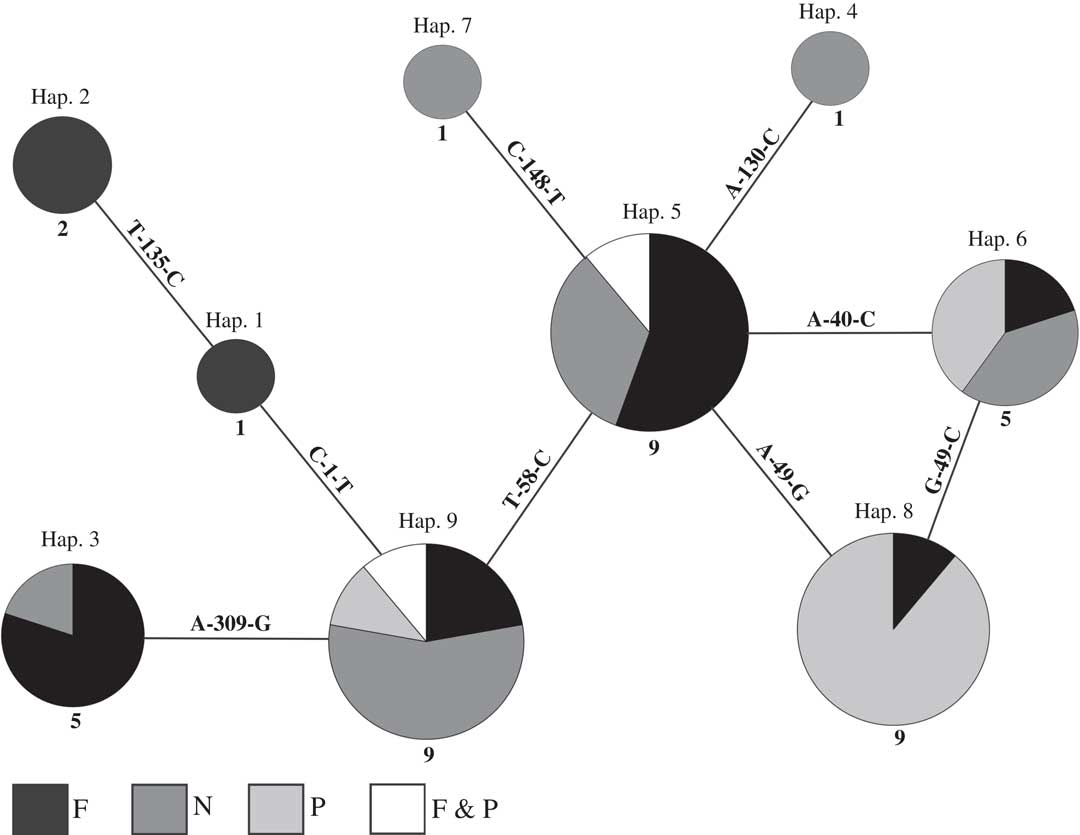
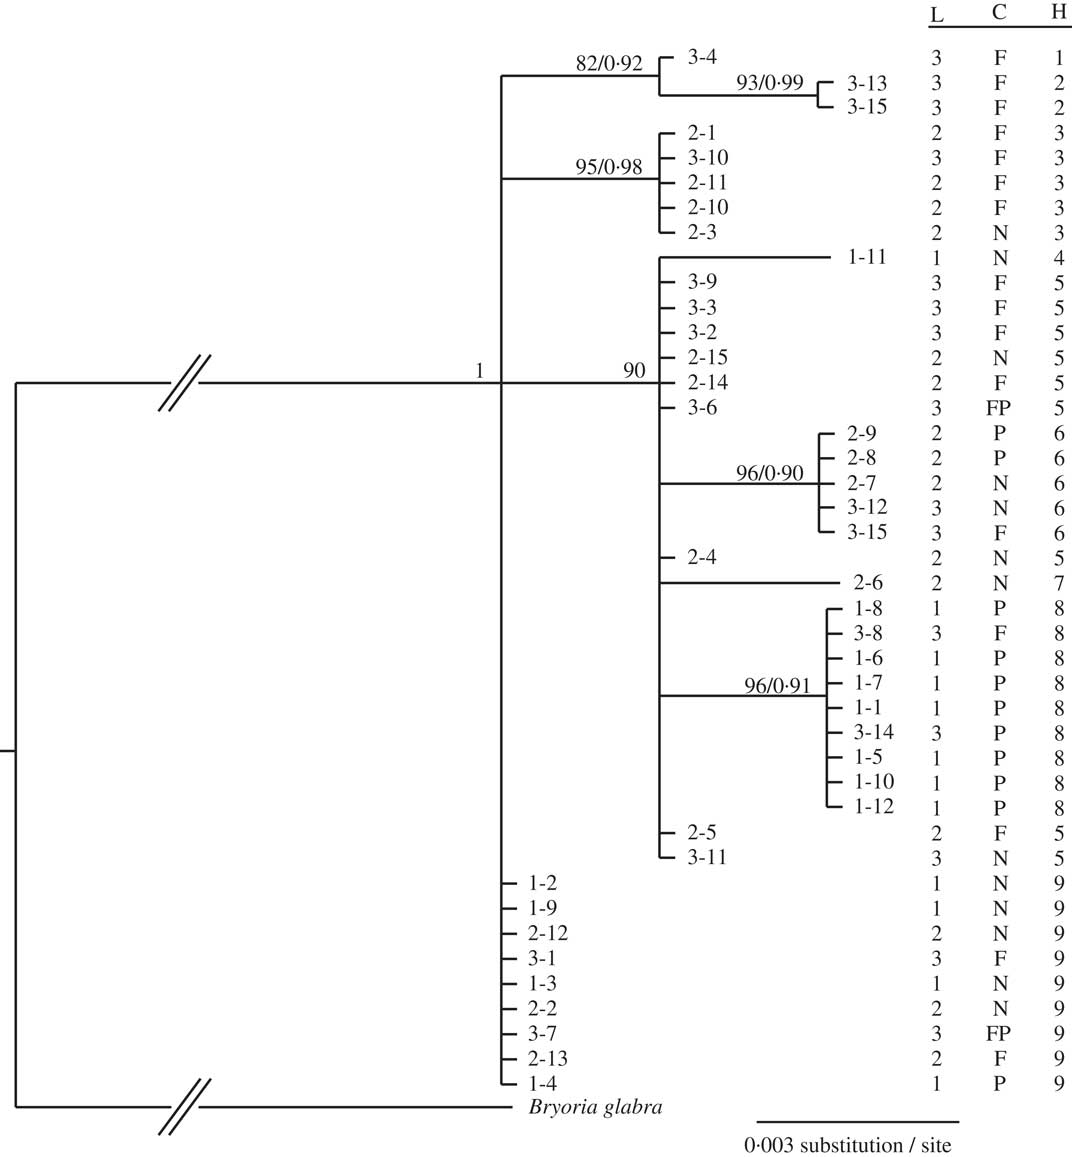
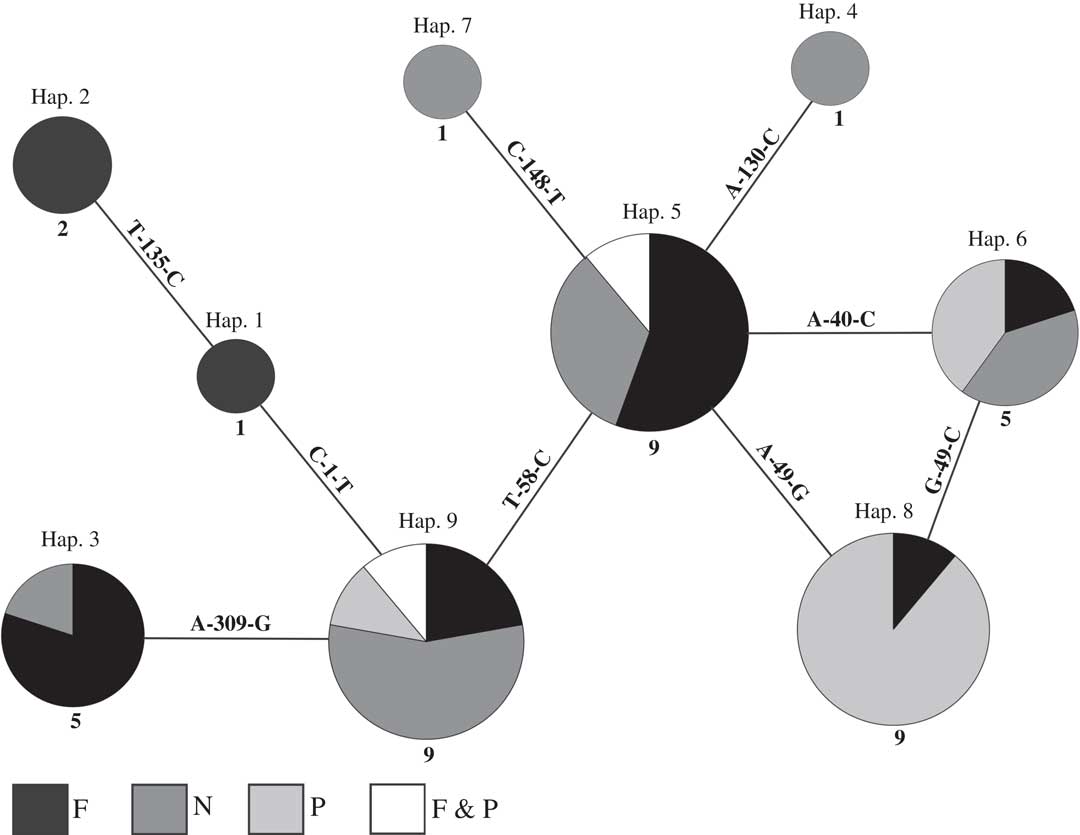
The sequences used for tree and haplotype network reconstruction (one per specimen) contained a haplotypic diversity (Hd) of 0·850, seven polymorphic sites (S), a nucleotide diversity (π) of 0·00331, a Tajima’s D value of −0·4847 (P>0·10, not significant), a Fu’s F statistic of −2·519 (P>0·10, ns), and a raggedness index (R) of 0·0944 (P>0·10, ns) with a unimodal mismatch distribution. Each of the 42 specimens was found to belong to one of nine haplotypes. The tree reconstruction (Fig. 1) was characterized by exceptionally short branch lengths (note that the scale in Fig. 1=0·003 substitutions per site) compared with those seen within other species of the genus (cf. Myllys et al. Reference Myllys, Velmala, Holien, Halonen, Wang and Goward2011a ). This represents a particularly low level of genetic diversity in the ITS sequences, many specimens having identical sequences. The same haplotypes occurred in the different populations, as evident from the haplotype network obtained (Fig. 2); all haplotypes were connected by a single mutation. Three of the nine haplotypes were represented by single specimens. Haplotypes represented by more than one specimen (except haplotype 2 with two specimens), also included more than one chemotype. Three of the predominant haplotypes (numbers 5, 9 and 6, with nine, nine and five specimens, respectively) contained specimens showing in total the full range of extrolites found in this study within each haplotype (norstictic, psoromic, and fumarprotocetraric acids). AMOVA results showed that 24·7% of the genetic variation was among the four chemotypes, while the variation among the collected populations was 7·8%. The Fisher’s exact test indicated that the hypotheses of there being no correlation between haplotypes and chemotypes (P<0·001), nor between haplotypes and populations (P<0·005), could not be entirely ruled out from the data available. The reason for this was that some haplotypes were represented by only one or two specimens in only one chemotype or population. In the case of the haplotypes in our study represented by greater numbers of specimens, the test showed that haplotypes and chemotypes were not correlated. This suggests that there is no correlation between extrolite chemistry and genetic kinship, but more samples are needed to be confident that this is the case for all haplotypes and chemotypes represented in our samples.
Phylogram obtained from maximum likelihood analysis of ITS rDNA sequences from 3 populations of Bryoria fuscescens obtained from the Sistema Central Mountains of Spain. ML bootstrap values ≥75 and posterior probabilities ≥0·90 for the Bayesian analyses are indicated above the branches. The tree tip numbers indicate the locality and specimen number respectively. L=locality (1=Segovia, 2=Madrid, and 3=Ávila); C=chemotype (F=fumarprotocetraric and protocetraric acids, N=norstictic and connorstictic acids, P=psoromic acid, FP = fumarprotocetraric, protocetraric and psoromic acids); H=haplotype.
95% probability haplotype network based on ITS rDNA sequences of the 42 specimens from 3 populations of Bryoria fuscescens examined. The circle size is proportional to the number of specimens sharing a haplotype. Numbers below the circles indicate the number of specimens. Text on the connecting lines indicates the nucleotide substitution. Hap.=haplotype, F=fumarprotocetraric and protocetraric acids, N=norstictic and connorstictic acids, P=psoromic acid.
Discussion
Bryoria fuscescens s. lat. is taxonomically difficult to resolve and the assignment of specimens to currently recognized species can be frustrating. Our results, the first to be based on intensive molecular and chemical analyses of discrete morphologically more-or-less uniform populations conforming to B. fuscescens s. str. but including some deviating chemically, suggest that extrolite production, which has been emphasized in species circumscription in these lichens since the 1970s, is not correlated with particular haplotypes (phylogenetic lineages) as revealed by ITS. We also show that populations lacking apothecia and so expected to reproduce clonally, and which also appear morphologically homogeneous, can comprise a mixture of haplotypes and can vary in the TLC-detectable extrolites. We found that specimens morphologically assigned to B. fuscescens may not contain fumarprotocetraric acid only, as historically assumed, but are much more variable in their chemistry. As pointed out previously (Boluda et al. Reference Boluda, Rico and Hawksworth2014), however, a fuller picture of the extrolite patterns in the complex will require the use of high performance liquid chromatography (HPLC) to detect compounds present at lower concentrations than can be visualized by TLC from extracts of single small thallus portions, and further fluorescence microscopy to explore the localization of compounds in thalli more precisely. In addition, negative but non-significant Tajima’s D value and Fu’s F statistics may indicate population stability (i.e. no evidence of demographic expansion or contraction) of B. fuscescens in the regions studied. The unimodal curve of mismatch frequency, however, suggests population expansion or spatial range expansion, but with a non-significant raggedness index. These contradictory results may well be attributable to bias arising from the limited sample size (Ramos-Onsins & Rozas Reference Ramos-Onsins and Rozas2002), and so more comprehensive studies would be required to test that hypothesis.
We conclude that extrolite composition appears to be of limited value for the possible separation of species within material conforming morphologically, but not always chemically, to Bryoria fuscescens. Furthermore, as the three populations we investigated were growing in similar ecological situations and on the same species of tree, there were no evident ecological factors to which the differences observed could be attributed, nor were there associations with particular genetic lineages as revealed by the ITS rDNA region.
Similar population studies across the range of the species complex are required to determine the extent to which those of the Spanish Sistema Central are representative of the situation throughout its geographical range. Furthermore, B. fuscescens s. lat. is much more abundant in northern Europe, where apothecia can sometimes be found, albeit at a low frequency, while in southern Europe specimens are almost exclusively asexual and occur as isolated populations. It would therefore be of interest to ascertain if a greater range of genetic diversity occurs in more northern regions.
Without more detailed population studies over a larger geographical area, we consider it unwise to conclude that material currently named as Bryoria capillaris, B. chalybeiformis, B. fuscescens, B. implexa, B. lanestris, or B. subcana should be treated as conspecific on the basis of DNA data alone, as suggested by Myllys et al. (Reference Myllys, Velmala and Holien2011b ). In order to elucidate the situation in Bryoria fuscescens s. lat., and lead to a more robust taxonomy for these lichens, sequences from more DNA regions and microsatellite population studies are required to determine if there are other correlations between chemistry, morphology, geography, and genetic data.
This study was prepared with support from the Spanish Ministerio de Economía y Competitividad project CGL2011-25003. We thank Paloma Cubas for her contribution to the statistical analyses and Constantino Ruibal for help in the laboratory.