Introduction
The Huang-Huai-Hai Plain is one of the most important regions for winter wheat production in China, which accounts for two-thirds of national production (Lu & Fan Reference Lu and Fan2013). However, wheat production is largely affected by water availability and high-temperature stress in this region. The unevenly distributed seasonal rainfall only meets 0.25–0.40 of the water requirement, causing water deficits during wheat growth (Zhang et al. Reference Zhang, Pei, Chen, Sun and Yang2006; Fang et al. Reference Fang, Ma, Green, Yu, Wang and Ahuja2010). In addition, the frequent dry and hot weather exceeds the moderate temperature needed for kernel development, causing high-temperature stress around the time of anthesis and grain-filling (Deng et al. Reference Deng, Zhang, Xu, Chen, Qin and Zhang2009).
Drought and high-temperature stress seriously affect the physiology of cereal crops, which prevents them from reaching their genetic yield potential (Wheeler et al. Reference Wheeler, Hong, Ellis, Batts, Morison and Hadley1996; Bowne et al. Reference Bowne, Erwin, Juttner, Schnurbusch, Langridge, Bacic and Roessner2012; Bürling et al. Reference Bürling, Cerovic, Cornic, Ducruet, Noga and Hunsche2013). For example, photosynthesis is susceptible to water deficit and high-temperature stress (Shah & Paulsen Reference Shah and Paulsen2003). Subrahmanyam et al. (Reference Subrahmanyam, Subash, Haris and Sikka2006) reported that water deficits reduced the net photosynthetic rate because of reduced stomatal conductance and impaired photochemical reactions of the photosynthetic apparatus (Lawlor & Tezara Reference Lawlor and Tezara2009; Hu et al. Reference Hu, Wang and Huang2010). As a consequence, the supply of photosynthates to the grains was reduced, eventually resulting in decreased grain weight (Yang et al. Reference Yang, Yin, Jiang, Peng, Yang, Cui and Wang2014). Heat stress between heading and maturity has increased in the last decades in the Huang-Huai-Hai Plain (Liu et al. Reference Liu, Liu, Tian, Cao, Zhu and Asseng2014). The photosynthetic apparatus in leaves is impaired by heat stress due to damage to the ultra-structure of organelles and reduction in ribulose bisphosphate (RuBP) carboxylase activity (Feng et al. Reference Feng, Liu, Li, Dong, Wang, Kong and Zhang2014). The grain-filling rate is decreased by high temperature due to reduced leaf photosynthesis, resulting in a decrease in final grain weight (Zhao et al. Reference Zhao, Dai, Jing, Jiang and Cao2007).
Canopy temperature depression (CTD), the difference between air temperature and canopy temperature, correlates with the environment and leaf physiological conditions such as soil water content, leaf gas exchange rate, leaf area and photosynthetic enzyme activity (Leuning et al. Reference Leuning, Kelliher, De Pury and Schulze1995; Balota et al. Reference Balota, Payne, Evett and Peters2008; Elbashier et al. Reference Elbashier, Tahir, Saad and Ibrahim2012). Furthermore, cooler canopies have been associated with increased grain number and yield (Rebetzke et al. Reference Rebetzke, Rattey, Farquhar, Richards and Condon2012). Accordingly, CTD has been used in various practical applications including wheat response to water deficit and nitrogen (N) fertilization management (Pradhan et al. Reference Pradhan, Xue, Jessup, Rudd, Liu, Devkota and Mahan2014; Mon et al. Reference Mon, Bronson, Hunsaker, Thorp, White and French2016). Supplemental irrigation and N management are crucial in the production of wheat: not only do they provide the additional water and nutrients required for wheat growth, but they also affect the field microclimate (Nielsen & Halvorson Reference Nielsen and Halvorson1990). The effects of N application and supplemental irrigation on leaf photosynthesis rates and grain yield have been reported previously (Albrizio et al. Reference Albrizio, Todorovic, Matic and Stellacci2010; Ferrante et al. Reference Ferrante, Savin and Slafer2013; Wang et al. Reference Wang, Xu, Zhang, Lin and Zhao2015). However, little is known about how supplemental irrigation, N application and their interactions affect canopy temperature and performance of the leaf photosynthetic apparatus. In particular, the relationship between leaf temperature and photosynthetic characteristics during grain filling has remained uninvestigated. Therefore, it was hypothesized that (1) N application and supplemental irrigation would decrease leaf temperature, which consequently increases canopy temperature depression and therefore enhances the photosystem's performance; (2) the enhanced photosynthetic capacity would furthermore promote photosynthate assimilation to the grains, which would (3) result in a higher grain yield. A 2-year field experiment was conducted, using thermal imagery and chlorophyll fluorescence measurements to explore the effects of supplemental irrigation and N application on canopy temperature and photosystem performance, in order to ultimately explain grain yield responses in terms of photosynthetic characteristics.
Materials and methods
Plant materials and growth condition
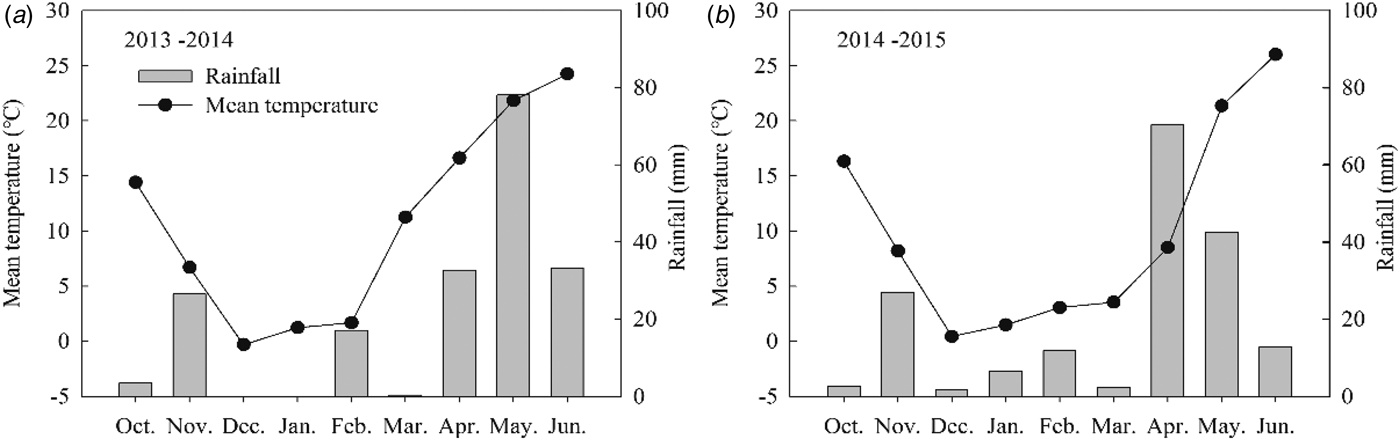
Field experiments were carried out during two winter wheat growing seasons (2013/14 and 2014/15), at the experimental station of Shandong Agricultural University, Tai′ an, China (36°09′ N, 117°09′ E, 128 m a.s.l.). This region has a warm and semi-humid continental monsoon climate, with an average total annual solar irradiance of 5.08 × 10³ MJ/m2 and average annual temperature of 13.7 °C. During the winter wheat growing seasons in 2013/14 and 2014/15, precipitation was 178.0 mm and 184.7 mm, respectively. The rainfall and mean temperature distribution during the growth cycle are shown in Fig. 1. The soil type is sandy loam (pH 7.3), and the top 30 cm of the soil contained 14.7 g/kg organic matter, 1.24 g/kg total N, 87.2 mg/kg available N, 9.6 mg/kg available P and 85.3 mg/kg available K. Seeds of the winter wheat cultivar Tainong18 (TN18) were sown on 10 October 2013 and 7 October 2014, at a density of 225 seeds/m2. The plants were harvested on 10 June 2014, and 6 June 2015. Pests, diseases and weeds were controlled by appropriate chemical applications throughout the growth cycle.
Mean daily temperature and monthly precipitation in the 2013/14 and 2014/15 seasons.

Experimental design
The experiments were laid out in a split-plot design, using three replications per treatment. The two main plots represented the two water regimes: one was rainfed and received no irrigation (R), the other received 180 mm additional water that was divided and applied via border irrigation (W) at growth stage (GS) 25, GS 31 and GS 75 according to the Zadoks et al. (Reference Zadoks, Chang and Konzak1974) scale. For each irrigation event, 60 mm water was applied to the soil using a flow meter connected to a 4-inch plastic water pipe. Urea (N) fertilizer application rates (0 kg N/ha, N0; 240 kg N/ha, and N1; 360 kg N/ha, N2) were assigned to sub-plots. Plot size was 9 m2 (3 × 3 m2) with ten rows of wheat. Half the amount of N, 75 kg/ha phosphorus pentoxide (P2O5) and 150 kg/ha potassium oxide (K2O) were mixed into the soil before planting while the remaining N was applied at GS31 for each treatment.
Flag leaf area, leaf relative water content and soil-plant analysis development
At the anthesis stage (GS62), 15 fully developed flag leaves from each treatment were randomly sampled to calculate leaf area (LA), determined as follows: LA = leaf length × leaf width × 0.78 (Guo et al. Reference Guo, Shi, Yu and Zhang2015). Leaf length is the distance between the base and tip; leaf width is the widest part of the leaf. Furthermore, to determine the fresh, turgid and dry weights (FW, TW and DW, respectively), 15 flag leaves from each treatment were sampled at 7-day intervals from anthesis onwards. After measuring fresh weights (FW), leaves were submerged in deionized water for 12 h at 4 °C in darkness. After soaking, fully turgid weight was measured (TW). Leaf dry weight (DW) was obtained after drying the leaves in an oven for 48 h at 70 °C. Leaf relative water content (RWC) was determined as follows: RWC = (FW – DW)/(TW – DW). A hand-held soil-plant analysis development (SPAD) chlorophyll meter (SPAD-502) (Minolta, Osaka, Japan) was used to estimate chlorophyll content. Fifteen fully developed flag leaves from each treatment were randomly sampled to measure SPAD values at 7-days intervals from anthesis onwards.
Canopy and leaf temperature
Thermal images of plant canopies were acquired using an infrared imaging camera with a sensor resolution of 640 × 480 pixels and sensitivity of 0.04 °C (Testo 890-1, Testo AG, Germany). Each treatment was measured between 10 : 00 and 11 : 00 at 10, 20 and 30 days after anthesis (DAA). Image analysis was conducted using Testo IRSoft version 3.2 software. For determination of mean flag leaf temperature, 15 flag leaves were selected from thermal images from each treatment. Canopy temperature depression (CTD) of each treatment was estimated subsequently using the equation from Balota et al. (Reference Balota, Payne, Evett and Lazar2007): CTD = air temperature (Ta) − canopy temperature (Tc).
Determination of photosynthetic rate and chlorophyll fluorescence
Net photosynthetic rate (PN) of flag leaves was measured on 15 flag leaves of each treatment with a portable photosynthetic system (CIRAS-II, PP systems, Hansatech, UK) at 10-day intervals from anthesis onwards. The chamber was equipped with a red/blue LED light source, and the photosynthetically active radiation (PAR) was set at 1200 µmol/m2/s.
The fast chlorophyll fluorescence induction kinetics curve was measured using a Handy-Plant Efficiency Analyser (PEA) chlorophyll fluorometer (Hansatech, UK). Flag leaves after 10, 20 and 30 DAA were dark-adapted for 30 min and then illuminated with continuous red light for 1 s at 3000 µmol(photon)/m2/s. Data were obtained according to equations of the chlorophyll α transient analysis (JIP test) parameters by a tabulation program and were analysed using the JIP test (Strasser Reference Strasser1997). The following parameters were used in the current study: Fo (fluorescence at 20 µs, O phase); F k (fluorescence at 300 µs, K phase); F j (fluorescence at 2 ms, J phase); F i (fluorescence at 30 ms, I phase); F m (maximal fluorescence, P phase); V k, V j and V i (relative variable fluorescence at K, J and I); Wk (relative variable fluorescence at the K-step to the amplitude F j – F o), Ψo (the probability that a trapped exaction transfers an electron into the electron transport chain beyond QA), PIabs (the performance index based on absorption of light energy).
Ribulose diphosphate carboxylase activity determination
At 10-day intervals from anthesis, 30 flag leaves from each treatment were sampled, which were immediately submerged in liquid nitrogen for 0.5 h and stored at −80 °C until biochemical assays were performed. Ribulose diphosphate carboxylase (RuBP) was extracted by the following method, modified from those previously described: 0.5 g leaf tissue was crushed and homogenized with 5 ml of extraction solution, which consisted of 40 mmol/l Tris-hydrochloride (HCl; pH 7.6), 10 mmol/l magnesium chloride (MgCl2), 0.25 mmol/l EDTA and 5 mmol/l glutathione. The homogenate was centrifuged at 15 000 g for 10 min, and the supernatants were used for enzyme activity assays (Wei et al. Reference Wei, Zhang, Huang and Wang2007). The RuBP activity was measured using a plant RuBP enzyme-linked immunosorbent assay kit (ELISA, Bangyi Bio Inc., Shanghai, China).
Grain yield, yield components and above-ground biomass determination
At maturity, all plants in an area of 1 m2 were harvested to determine grain yield, spike number, number of kernels per spike and 1000-grain weight. From each replicate plot, 20 above-ground plants were selected to calculate above-ground biomass per plant.
Statistical analyses
Statistical analyses were performed with Data Processing System (DPS7.05). The statistical analyses of grain yield, spike number, grain number, 1000-grain weight, above-ground biomass and flag leaf area consisted of poly-analysis of variance (POLYANOVA) with the general linear model, taking into account the year effect, irrigation treatment, N application treatment and the interaction of the three. Means were tested with the Duncan's test, and significance declared at P < 0.05. The graphs were plotted using the SigmaPlot 10.
Results
Results of poly-analysis of variance
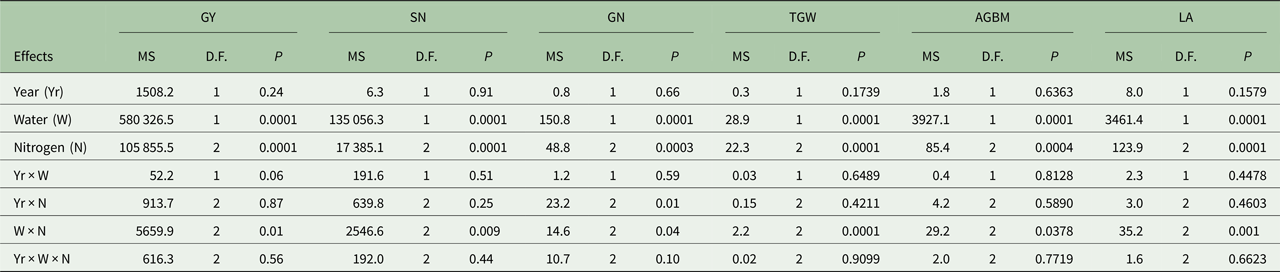
A Poly-ANOVA was conducted using DPS7.05 to find the mean squares (MS), D.F. and significance (Table 1). Grain yield (GY), above-ground biomass per plant (AGBM), spike number (SN), grain number per spike (GN), 1000-grain weight (TGW) and flag leaf area (LA) showed no significant effects of year (Yr) or the interaction between Yr, water regime (W) and nitrogen addition (N) (Table 1). In contrast, SN, GN and TGW were significantly (P < 0.05) influenced by W, N and W × N interactions, suggesting that they were important in determining grain yield.
The PolyANOVA of the year, water treatment, nitrogen application treatment, and the interaction of the three on grain yield (GY), spike number (SN), grain number (GN), 1000-grain weight (TGW), leaf area (LA) and above-ground biomass (AGBM)

MS, mean square; D.F., degree of freedom; Yr×W, Year–Water interaction; Yr×N, Year–Nitrogen interaction; W×N, Water–Nitrogen interaction; Yr×W×N, Year–Water–Nitrogen interaction; GY, Grain yield; SN, spike number; GN, grain number per spike; TGW, 1000-grain weight; AGBM, above-ground biomass per plant; LA, flag leaf area.
Grain yield
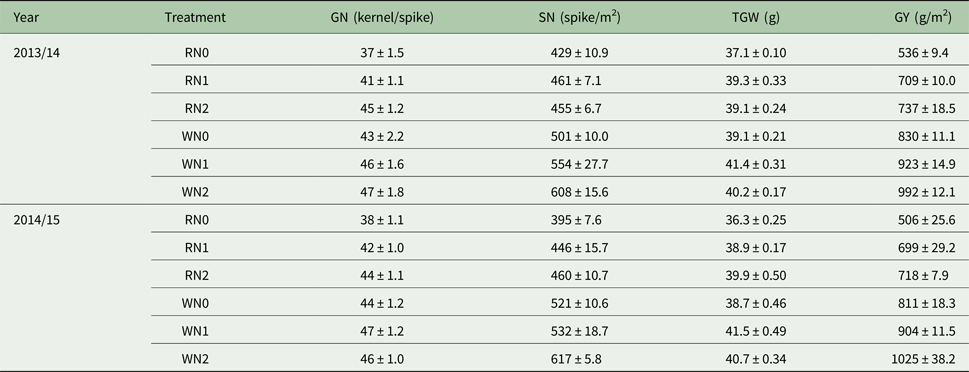
Significant differences in GY, SN, GN and TGW were observed among the various treatments (Table 2). Compared with the rainfed treatment, supplemental irrigation significantly (P < 0.05) increased GY, SN, GN and TGW values in the 2013/14 and 2014/15 seasons. Meanwhile, application of N significantly (P < 0.05) increased grain yield in both water regimes. The highest yield was obtained in the WN2 treatment, followed by WN1 and WN0. The RN0 treatment produced the lowest grain yield in both growing seasons, due to the lowest SN, GN and TGW values.
Winter wheat grain number (GN), spike number (SN), 1000-grain weight (TGW) and grain yield (GY) in 2013/14 and 2014/15

R, rainfed and received no irrigation. W, received 180 mm supplemental irrigation.
N0, no nitrogen fertilizer. N1, nitrogen rate of 240 kg N/ha; N2, 360 kg N/ha.
Data represent means ± standard error (n = 3).
Above-ground biomass per plant and flag leaf area
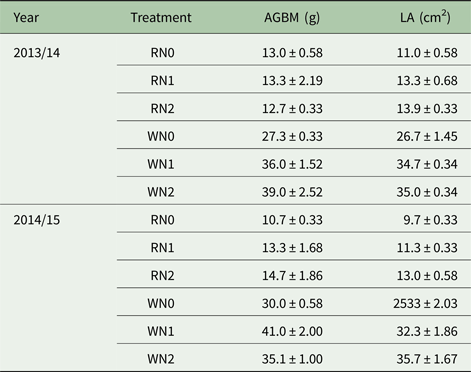
Supplemental irrigation and N application treatments significantly (P < 0.05) increased AGBM and LA (Table 3). Compared with RN0, AGBM in WN0 increased by an average of 152%. The latter could be explained by the increase in tiller and fertile spike number per plant, caused by supplemental irrigation. Compared with WN0, LA in WN1 and WN2 increased on average by 29% and 26%, respectively. However, there was no significant difference in AGBM between the WN1 and WN2 treatments.
Winter wheat above-ground biomass per plant (AGBM) and flag leaf area (LA) in 2013/14 and 2014/15

R, rainfed and received no irrigation. W, received 180 mm supplemental irrigation.
N0, no nitrogen fertilizer. N1, nitrogen rate of 240 kg N/ha; N2, 360 kg N/ha.
Data represent means ± standard error (n = 3).
Soil-plant analysis development readings and leaf relative water content
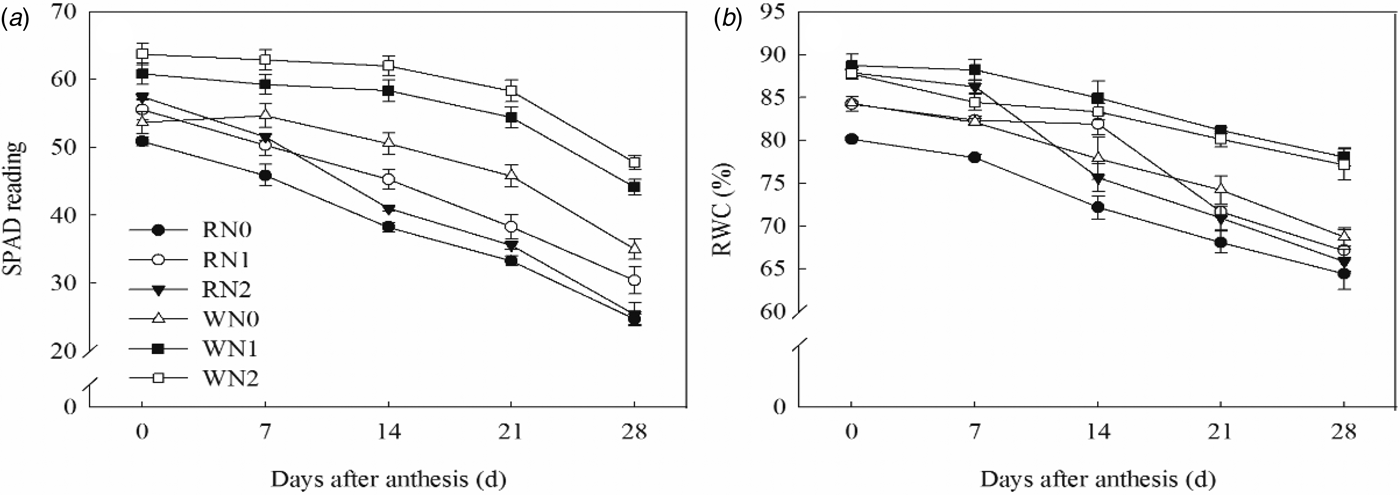
The SPAD readings, which characterized flag leaf chlorophyll content, decreased gradually from 0 to 28 days after anthesis (DAA) (Fig. 2(a)). The SPAD readings tended to be lower in the rainfed than in the supplemental irrigation treatment, whereas application of N significantly (P < 0.05) increased SPAD readings. SPAD readings were higher in WN2 and WN1 compared with WN0, in plants from 0 to 28 DAA. In addition, RN2 and RN1 had higher SPAD readings compared with the RN0 plants from 0 to 21 DAA.
Flag leaf SPAD readings (A) and relative water content (B) after anthesis, under different nitrogen and water treatments. Vertical bars represent the standard error (s .e.). Mean values ± s .e. (n = 15).

In general, RWC decreased gradually from 0 to 28 DAA (Fig. 2(b)) and was significantly (P < 0.05) higher in plants receiving supplemental irrigation than in those from the rainfed treatment. Application of N improved RWC of wheat under rainfed conditions from 0 to 21 DAA. However, no significant differences were observed in RWC of plants between WN1 and WN2 at 14 to 28 DAA. This suggests that abundant N fertilizer application does increase RWC.
Flag leaf temperature and canopy temperature depression
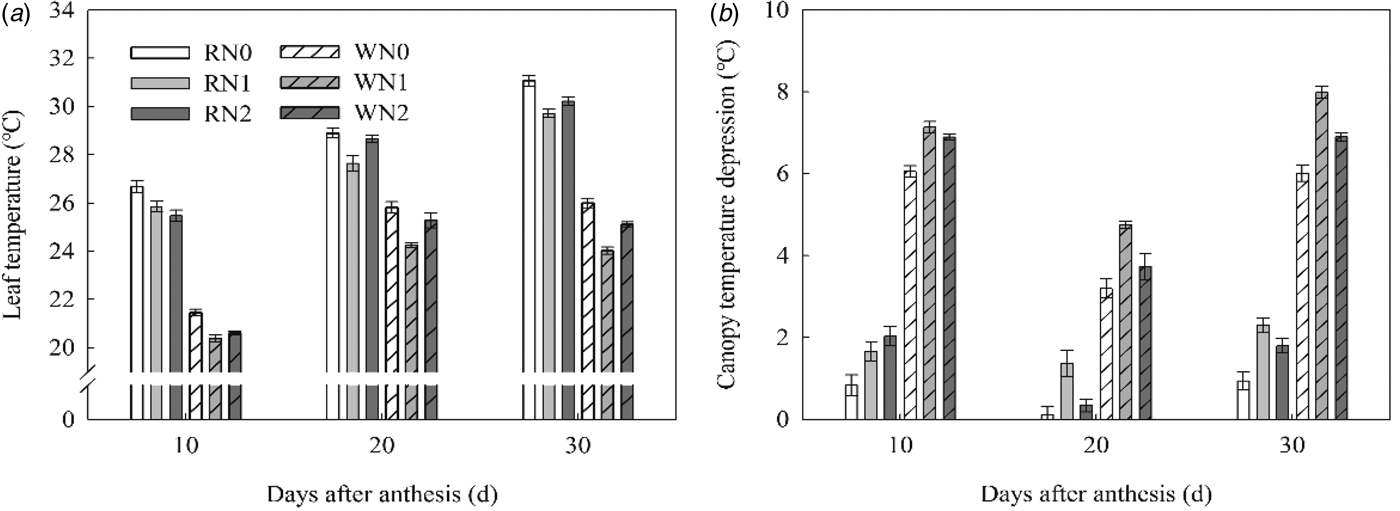
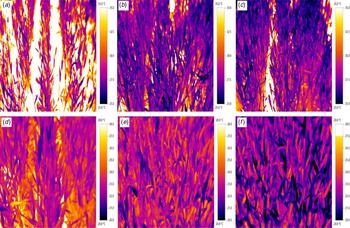
Flag leaf temperature increased gradually after anthesis (Fig. 3(a)). In addition, leaf temperatures were higher in the rainfed treatment. For example, leaf temperature in WN0 was 19.6% lower than RN0 at 10 DAA. Furthermore, N application decreased leaf temperature. In comparison with RN0, leaf temperature for RN1 and RN2 were 3.1% and 4.5% lower at 10 DAA, respectively. Additionally, in comparison with WN0, leaf temperature for WN1 and WN2 were 5.1% and 4.0% lower at 10 DAA, respectively. Compared with the rainfed treatment, supplemental irrigation significantly decreased canopy temperature, consequently increasing the canopy temperature depression (Fig. 3(b)). In addition, N application obviously increased canopy temperature depression under both rainfed and supplemental irrigation conditions. Overall, the thermal images showed significant (P < 0.05) differences in canopy temperature of plants among various treatments at 10 DAA (Fig. 4).
Flag leaf temperature (A), and canopy temperature depression (B) after anthesis under different nitrogen and water treatments. Vertical bars represent the standard error (s .e.). Mean values ± s .e. (n = 15).

Thermal images of the canopy under different nitrogen and water regime treatments at 10 days after anthesis. Colour online.

Gas exchange parameters
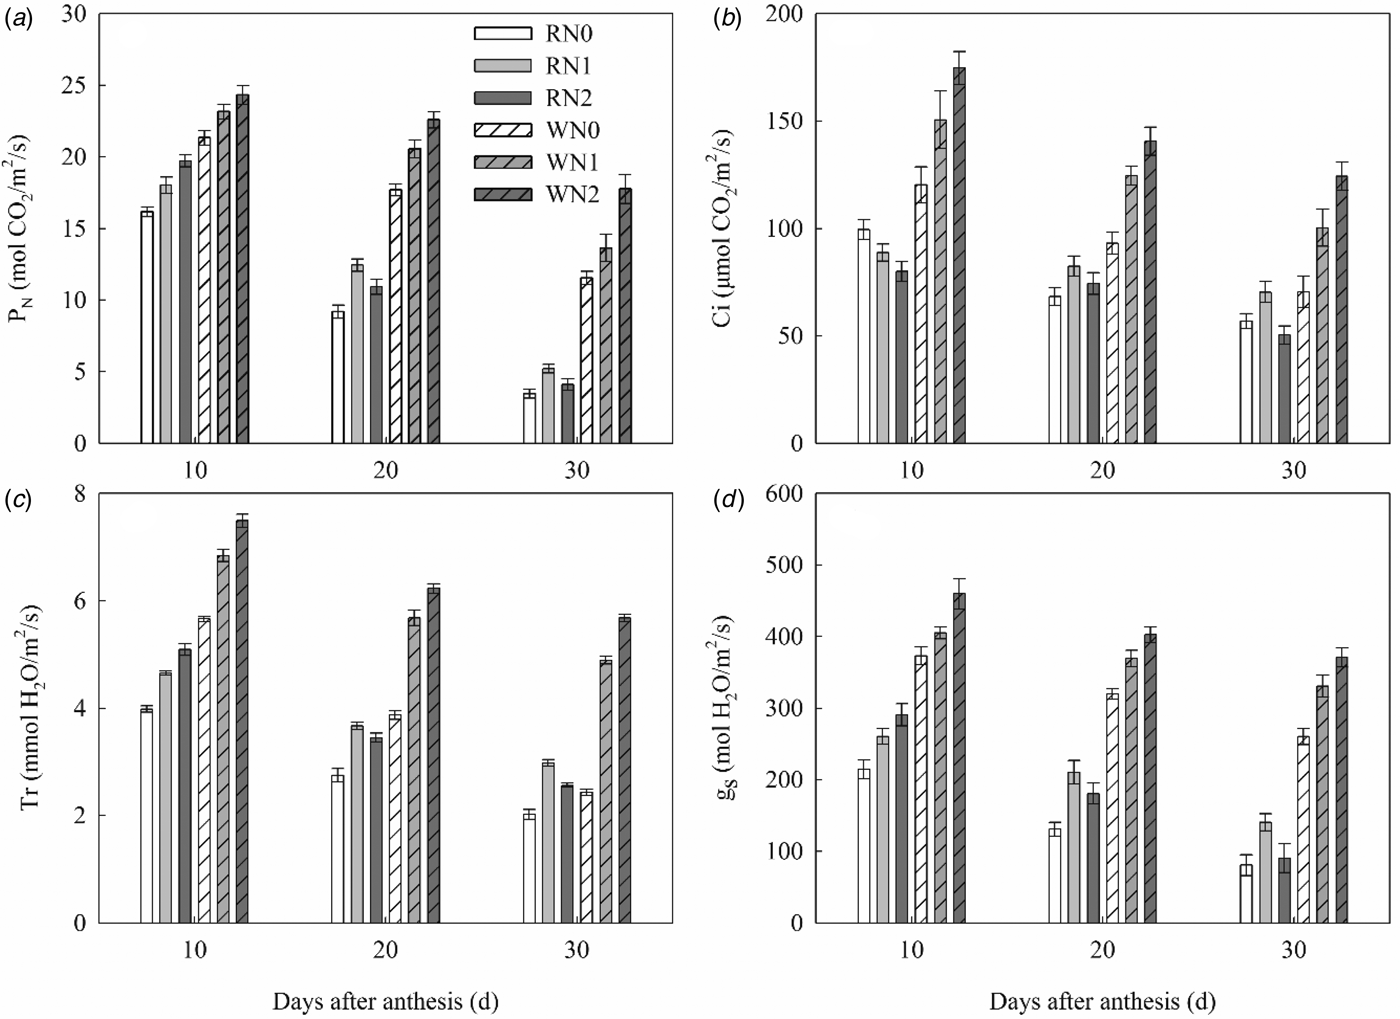
Net photosynthesis rate (PN), intercellular carbon dioxide (CO2) concentration (Ci), transpiration rate (Tr) and stomatal conductance (gs) of all treatments decreased gradually after anthesis (Fig. 5). All these variables were increased by supplemental irrigation. In addition, N application increased the PN, Ci, Tr and gs values significantly (P < 0.05) under both water regimes. Flag leaf PN, Ci, Tr and gs increased in the order of WN2>WN1>WN0 at 10 to 30 DAA. The RN2 treatment showed higher PN than the RN1 and RN0 treatments at 10 DAA. For Tr and gs, a similar pattern was observed, although the PN, Tr and gs values of RN1 were significantly (P < 0.05) higher than those of RN2 at 20 to 30 DAA. Overall, this indicates that, at later growth stages, large applications of N fertilizer actually decreased photosynthesis under water deficit conditions.
The effects of nitrogen application and water irrigation on photosynthetic parameters. Vertical bars represent the standard error (s .e.). Mean values ± s .e. (n = 15).

Flag leaf chlorophyll fluorescence parameters
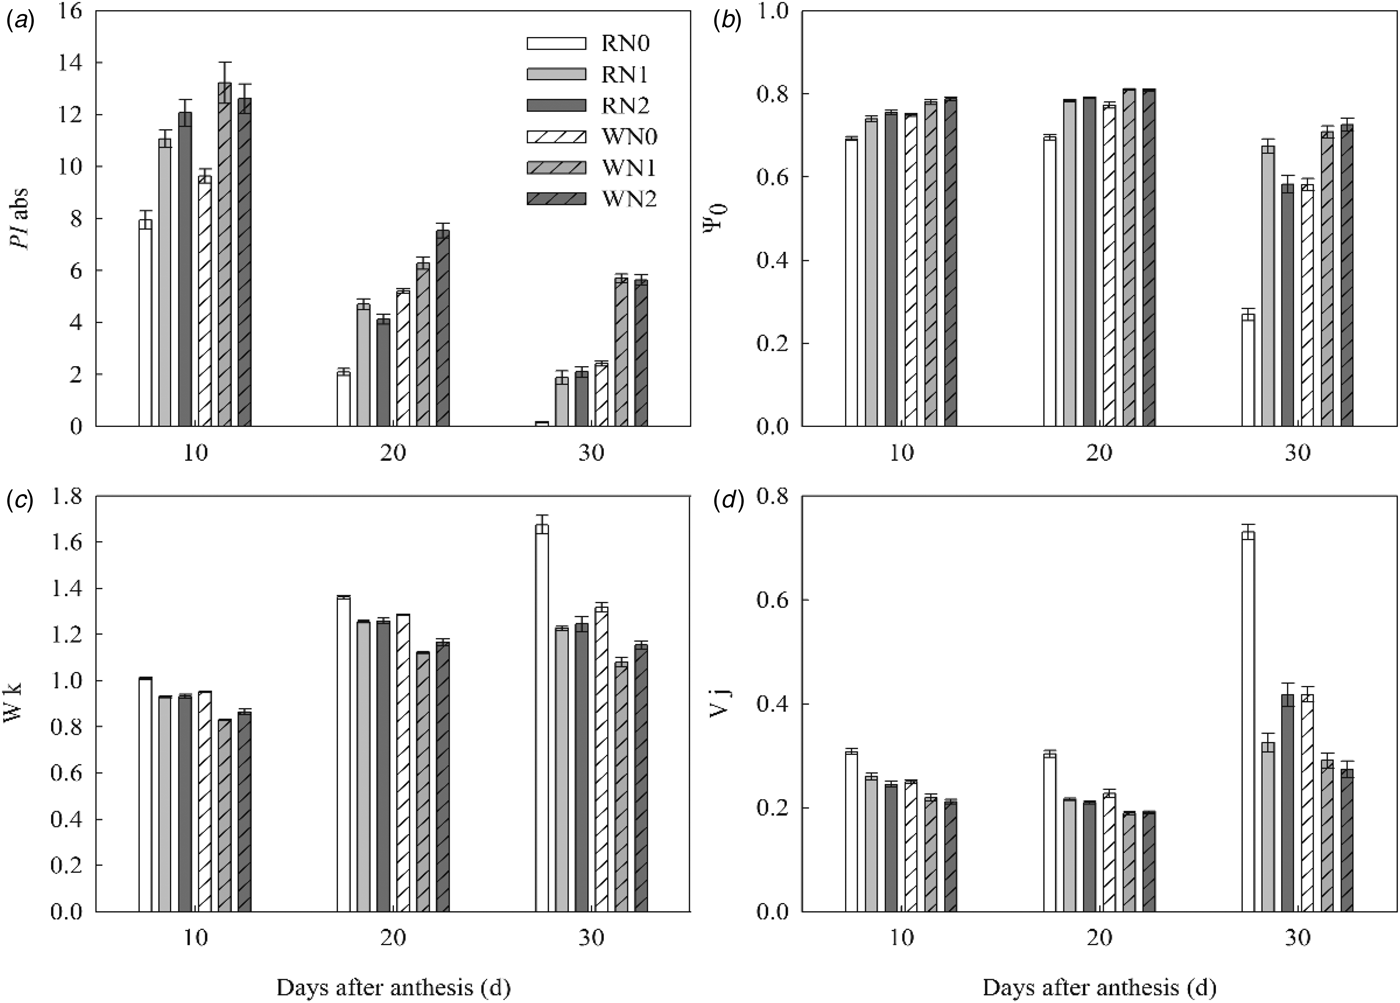
The photosynthetic performance index (PIabs) decreased gradually after anthesis (Fig. 6(a)). Supplemental irrigation increased flag leaf PIabs significantly (P < 0.05) from 10 to 30 DAA, because compared with RN0, WN0 PIabs values were 17.6, 59.7 and 93.2% higher at 10, 20 and 30 DAA, respectively. Nitrogen application also significantly (P < 0.05) increased PIabs for both water regimes. Nonetheless, no significant differences of PIabs were observed between the N2 and N1 applications.
The effects of nitrogen application and irrigation on chlorophyll fluorescence parameters. Vertical bars represent the standard error (s.e.). Mean values ± s .e. (n = 15).

Furthermore, N application and supplemental irrigation increased the probability that a trapped exaction transfers an electron into the electron transport chain beyond QA (Ψo) (Fig. 6(b)). At 30 DAA, Ψo in the RN1 and RN2 treatment were significantly (P < 0.05) higher, by 60.1 and 53.8%, respectively, compared with plants from RN0. From 10 to 30 DAA, the normalized relative variable fluorescence at the K-step (Wk) and relative variable fluorescence at the J-step (Vj) from RN1 and RN2 plants were significantly (P < 0.05) lower than observed in plants from the RN0 treatment (Fig. 6(c, d)). Compared with RN0, Wk and Vj in RN1 were 26.8 and 55.5% lower, respectively, at 30 DAA. In addition, N application also decreased Wk and Vj under supplemental irrigation conditions. Compared with WN0, Wk and Vj in WN1 and WN2 were 21.9 and 30.3% lower, respectively, at 30 DAA.
Ribulose diphosphate carboxylase activity
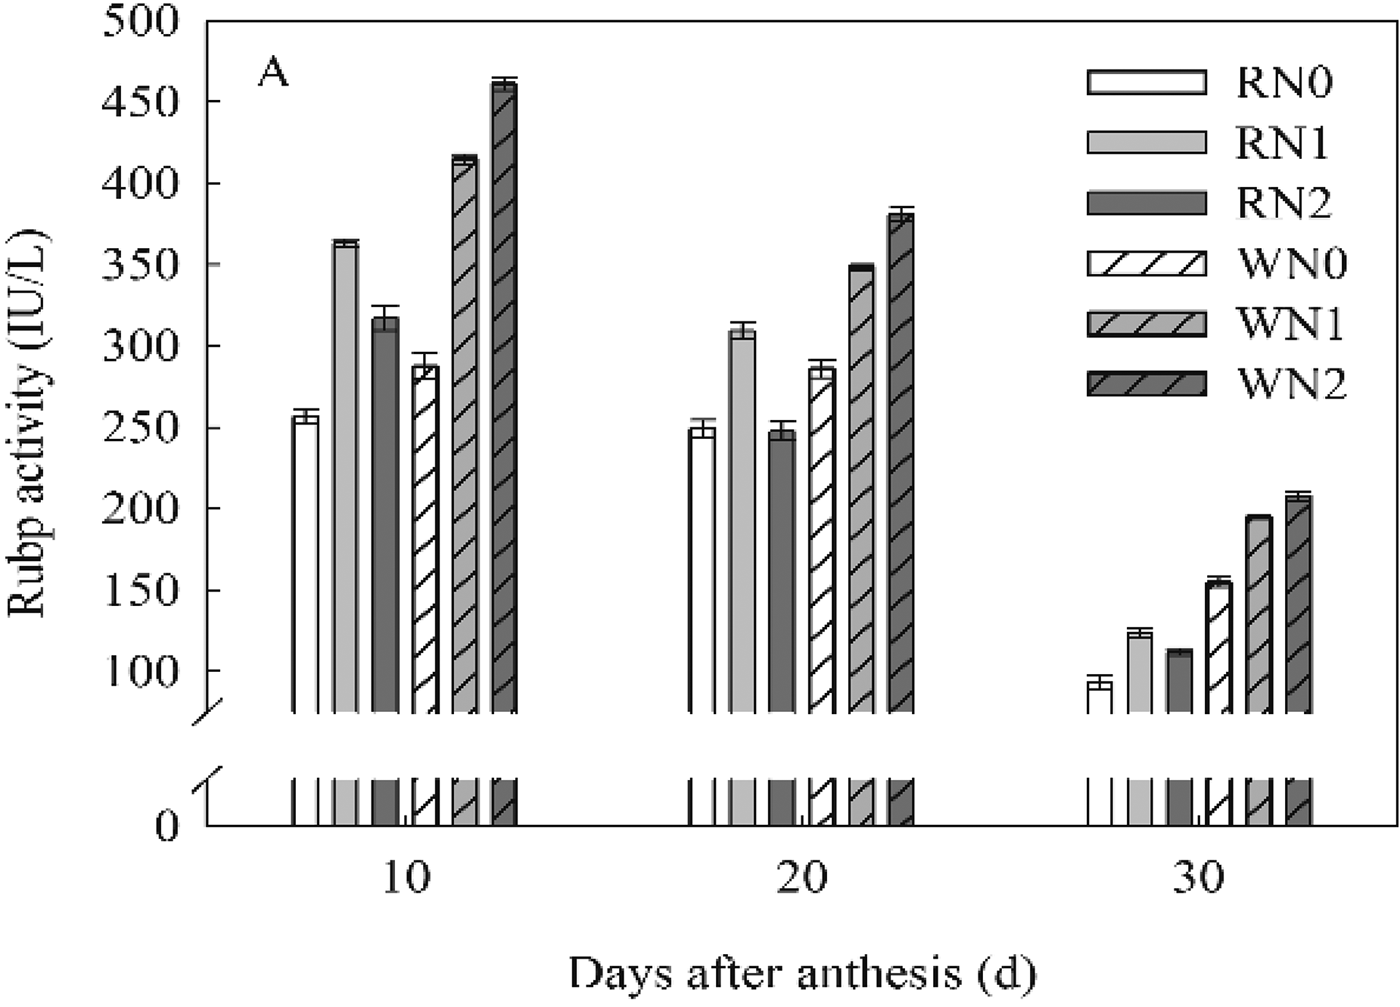
After anthesis, RuBP activity decreased gradually (Fig. 7), and showed significant (P < 0.05) differences among all treatments. Supplemental irrigation increased RuBP activity in flag leaves compared with those from rainfed plants. In addition, N application increased RuBP activity under both water regimes. However, the increase of RuBP activity was higher in the RN1 than in the RN2 treatment. For the supplemental irrigation treatment, there were significant (P < 0.05) differences in RuBP activity among all N addition levels, resulting in the following trend of WN2>WN1>WN0 from 10 to 30 DAA.
The effects of nitrogen application and irrigation on ribulose diphosphate carboxylase (RuBP) activity. Vertical bars represent the standard error (s .e.). Mean values ± s .e. (n = 3).

Correlation analyses
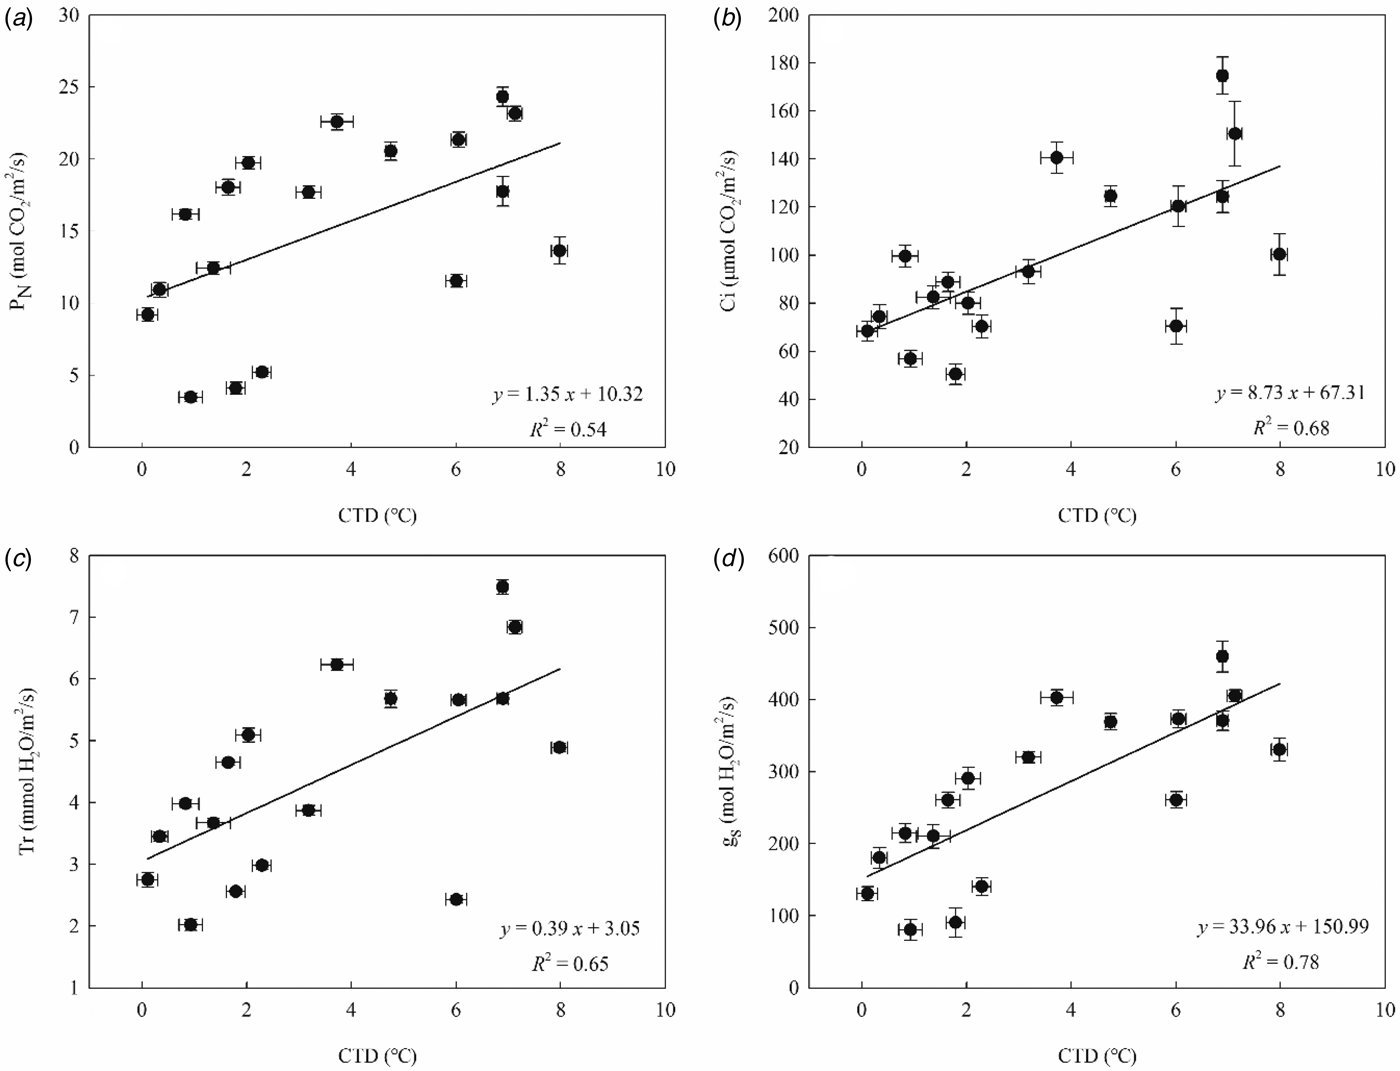
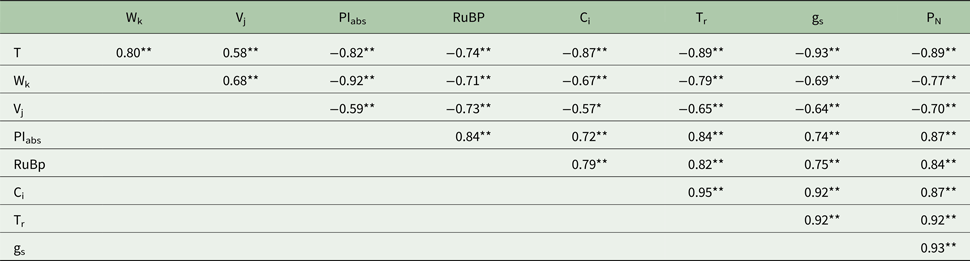
There were significant (P < 0.05) positive relationships between leaf temperature (T), the normalized relative variable fluorescence at the K-step (Wk) and relative variable fluorescence at the J-step (Vj) (Table 4). In contrast, leaf temperature showed significant (P < 0.05) negative correlations with PIabs, RuBP activity, PN, Ci, Tr and gs. Both Wk and Vj also showed significant (P < 0.05) negative correlations with PIabs, RuBP activity, Ci, Tr, gs and PN. In addition, there was a significant (P < 0.05) positive relationship between RuBP activity and PN, and PN was positively correlated with Ci, Tr and gs. Regression analyses indicated that net PN, Ci Tr and gs were significantly (P < 0.05) and positively correlated with CTD (Fig. 8).
The relationship between photosynthetic parameters and canopy temperature depression (CTD). Regression functions and coefficients of determination are given in each panel.

Correlation coefficients between leaf temperature (T) and fluorescence parameters and photosynthetic parameters

*Significant correlation at P < 0.05. **Significant correlation at P < 0.01.
Discussion
To ensure food security and environmental protection in future decades, a substantial increase in grain yield is required, along with resource use efficiency (Fan et al. Reference Fan, Shen, Yuan, Jiang, Chen, Davies and Zhang2012). Yield variability is profoundly controlled by water and fertilizer use (Mueller et al. Reference Mueller, Gerber, Johnston, Ray, Ramankutty and Foley2012; Elliott et al. Reference Elliott, Deryng, Muller, Frieler, Konzmann, Gerten, Glotter, Flörke, Wada, Best, Eisner, Fekete, Folberth, Foster, Gosling, Haddeland, Khabarov, Ludwig, Masaki, Olin, Rosenzweig, Ruane, Satoh, Schmid, Stacke, Tang and Wisser2014; Trost et al. Reference Trost, Ellmer, Baumecker, Meyer-Aurich, Prochnow and Drastig2014). Drought and high-temperature stresses usually increase pollen sterility and decrease the number of fertile florets, resulting in lower grain number (Ferrante et al. Reference Ferrante, Savin and Slafer2013). Moreover, drought and N deficiency stop tiller production and reduce the number of tillers, thereby decreasing spike number per unit area (Jeuffroy & Bouchard Reference Jeuffroy and Bouchard1999; Duggan et al. Reference Duggan, Domitruk and Fowler2000). Thus, optimum temperature, soil moisture and N are required for wheat grain production (Stone & Nicolas Reference Stone and Nicolas1998; Denčić et al. Reference Denčić, Kastori, Kobiljski and Duggan2000). Developing an optimal management practice for N application and supplemental irrigation can increase crop yield and simultaneously reduce fertilizer and irrigation costs (Albrizio et al. Reference Albrizio, Todorovic, Matic and Stellacci2010; Wang et al. Reference Wang, Zhang, Liu, Zhang, Shao, Sun and Chen2013). It was found in the current study that water, N and their interactions affected GY significantly. Also, grain yield was increased dramatically by supplemental irrigation and N application, which can be explained by the increase in GN and SN, mediated by supplemental irrigation and application of N (Barnabás et al. Reference Barnabás, Jäger and Fehér2008; Prasad & Djanaguiraman Reference Prasad and Djanaguiraman2014). However, extra high levels of N application had no additional effects on tiller growth under rainfed conditions, since there was no significant difference of SN between RN1 and RN2.
The photosynthetic products that are supplied to the grains originate from both current assimilation and from the remobilization of assimilates stored temporarily in vegetative plant parts (Masoni et al. Reference Masoni, Ercoli, Mariotti and Arduini2007). The reason why TGW in the supplemental irrigation and N application treatment significantly increased may be related to improved leaf photosynthetic capacity after anthesis. Water stress and N deficiency can induce leaf senescence and reduce photosynthesis (Zhao et al. Reference Zhao, Reddy, Kakani and Reddy2005; Yang & Zhang Reference Yang and Zhang2006). The current study measured SPAD readings and RuBP activities to investigate leaf chlorophyll concentration and photosynthetic capacity, respectively (Ling et al. Reference Ling, Huang and Jarvis2011; Parry et al. Reference Parry, Reynolds, Salvucci, Raines, Andralojc, Zhu, Price, Condon and Furbank2011). The results showed that flag leaf area, SPAD readings and RuBP activities were increased significantly under the supplemental irrigation and N application treatments, indicating that supplemental water and N not only increase photosynthetic area but also reduce chlorophyll degradation and improve photosynthetic capacity.
Enhanced grain yields have been reported to be consistently associated with changes in photosynthetic characteristics, such as PN, Tr and gs (Dahal et al. Reference Dahal, Knowles, Plaxton and Huner2014). Increasing PN, Tr and gs improved grain filling and consequently increased grain weight (Rajala et al. Reference Rajala, Hakala, Mäkelä, Muurinen and Peltonen-Sainio2009). The current study found that the PN, Tr and gs were increased significantly by supplemental irrigation and N application. Analysis of chlorophyll fluorescence induction curves allows the evaluation of the physiological condition of photosystem and photosynthetic electron transport chain components (Kalaji et al. Reference Kalaji, Jajoo, Oukarroum, Brestic, Zivcak, Samborska, Cetner, Łukasik, Goltsev and Ladle2016). It was found that supplemental irrigation and N application decreased Wk and Vj values, and increased Ψo values. The Wk values represent the damage to oxygen-evolving complexes (OEC), while Vj and Ψo represent changes in the acceptor side of photosystem (PSII; Wang et al. Reference Wang, Xu, Lv, Wu, Cai, Liu, Song, Chen and Lv2016). The current results indicated that supplemental irrigation and N application reduced OEC damage, and improved the electron transfer capability of both the donor and the acceptor sides at the PSII reaction centre. Additionally, PIabs is more sensitive to environmental stress and has been used to study the responses of the plant to abiotic stresses including natural senescence (Wang et al. Reference Wang, Xu, Lv, Wu, Cai, Liu, Song, Chen and Lv2016). Results showed that plants from the rainfed and no N application treatments had lower PIabs values, compared with the supplemental irrigation and N application treatments. Correlation analysis indicated that Wk and Vj showed significant negative correlations while PN, while PIabs showed significantly positive correlation with PN. These suggested that the photosynthetic rate increased by supplemental irrigation and N application could have resulted partially from improved PSII performance.
Wang et al. (Reference Wang, Xu, Zhang, Lin and Zhao2015) reported that supplemental irrigation increased canopy relative humidity but decreased canopy temperature, resulting in increased leaf photosynthetic rate. Thermal imagery showed that supplemental water decreased leaf temperature and canopy temperature, and therefore increased CTD. Moreover, application of N decreased leaf temperature and increased CTD. This is mainly because N application increases Tr and gs, and more heat can be taken away from leaves through increased water evaporation. Canopy temperature depression is positively correlated with Tr and gs, indicating that N application increased Tr and gs resulting in improved gas-exchange between leaf and air. Moreover, N application increased spike number per unit area and leaf area, i.e., more stems and leaves were produced. More leaves will decrease light interception by shading each other (Falster & Westoby Reference Falster and Westoby2003). Leaf temperature was negatively correlated with RuBP activity, PIabs and PN, but positively correlated with Wk and Vj. Based on the current results and those reported in previous studies, it can be concluded that supplemental irrigation and N application protected the photosynthetic apparatus by lowering the leaf temperature and increasing CTD, resulting in an increased PN, ultimately, more photosynthetic products that are supplied to the wheat grains.
Conclusions
Supplemental irrigation and N application increased grain yield significantly, due to increased grain weight and numbers/m2. The increased grain weight was related to the enhanced photosynthetic capacity. Most importantly, the current results indicated that supplemental irrigation and application of N improved gas-exchange resulting in a decrease in leaf temperature and increase in canopy temperature depression that caused the better PSII performance and higher activities of RuBP, leading to the stability of the photosynthetic apparatus and enhanced CO2 fixation in the Calvin cycle.
Acknowledgements
The research was supported by the National Key Research and Development Program of China (2016YFD0300400), the National Basic Research Program of China (973 Program, NO. 2015CB150404), the Special Fund for Agro-scientific Research in the Public Interest of China (No. 201203100), National Natural Science Foundation of China (31601257), the Shandong Province Mount Tai Industrial Talents Program, the Shandong Province Natural Science Foundation (Doctoral Fund, ZR2017BC106) and the Opening fund of State Key Laboratory of Crop Biology (2016KF04).