Introduction
Despite years of health and medical advancement, children still suffer from various vaccine-preventable infectious diseases. It is estimated that worldwide approximately 6.3 million children under the age of five years died in 2013, 22% of which occurred in India (WHO, 2014). However, most of these under-five child deaths can be attributed to diseases that were preventable and treatable through simple and affordable interventions (WHO & UNICEF, 2005). Pneumonia, diarrhoea, malaria, measles, tetanus, HIV/AIDS and malnutrition are the primary causes of death in the developing world (World Bank, 1993). Immunization is regarded as the most effective public health intervention to fight such diseases (World Bank, 1993; WHO & UNICEF, 2005).
India was one of the first nations to react to vaccine-preventable diseases (VPDs) by launching the Expanded Programme on Immunization (EPI) back in 1978. Over the years, India has made remarkable progress in child immunization. As reported by the NFHS reports I, II and III, during the 1980s full child immunization coverage was below 20%, increasing to 36% in the early 1990s and further to 44% in 2005–06 (IIPS & Macro International, 2014). Recently, the Indian Government’s Ministry of Health and Family Welfare declared that the country had reached 61% full immunization coverage in 2012. These figures, though they look impressive, do not say anything about disparities in the prevalence of immunization. The available evidence suggests that there are disparities in child immunization by economic status in India (Sahoo, Reference Sahoo2012). But what is the explanation for this wealth-based inequality in immunization? Surprisingly, despite the importance of the question, very few studies have been conducted in India to understand and identify the factors associated with inequality in child immunization (see Lauridsen & Pradhan, Reference Lauridsen and Pradhan2011; Mathew, Reference Mathew2012). These limited studies have made a major contribution to the literature, but they suffer from several drawbacks. For instance, Mathew (Reference Mathew2012) conducted a systematic review of the literature to identify and explore factors associated with inequalities in child immunization, but the study did not employ any empirical data analysis to arrive at its conclusion. Similarly, the study of Lauridsen and Pradhan (Reference Lauridsen and Pradhan2011) had a number of flaws. Firstly, they considered only 9582 children, which is far lower than the number reported in the NFHS-3, and they did not justify the reason behind choosing that sub-sample. Secondly, the study used data from different sources pertaining to different time points (NFHS-3, Census 2001, Central Statistical Organization and National Sample Survey, 2004–05), which were highly questionable (Bailey, Reference Bailey2008; McLeod, Reference McLeod2010). Thirdly, they considered per capita income, poverty ratio and economic status as three independent variables in the same regression model. But the inclusion of these three variables, which roughly act as proxies for standard of living, simultaneously in the model is not scientific and invites an additional problem of multicollinearity. Fourth, the study excluded some key variables from the analysis, such as region, availability of an immunization card and mother’s awareness. Given this background, the present study attempted to identify the determinants of wealth-based inequality in child immunization using a modified and new method in India.
Methods
Data source
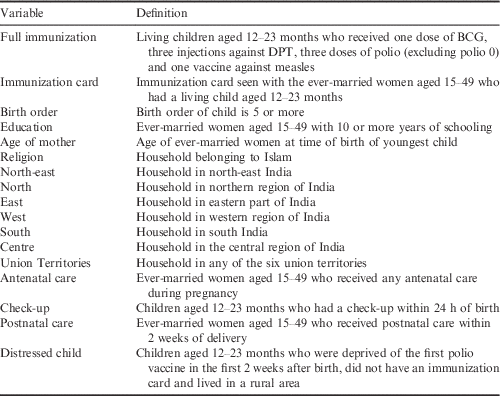
Data were taken from the third District Level Household and Facility Survey (DLHS-3) on Reproductive and Child Health (RCH) conducted in 2007–08, which provides national-level estimates of maternal and child health, family planning and other reproductive health indicators. The DLHS-3 gathered information from around seven lakhs (720,320 households) from 601 districts all over India. Respondents comprised both ever-married women aged 15–49 and unmarried women aged 15–24. However, the present study was based on 11,001 eligible ever-married women aged 15–49 and their children aged 12–23 months. Details of the survey design are available in the DLHS-3 national report (IIPS, 2015). A list of variables used in the study, along with their definitions, is given in Table 2.
Construction of the Concentration Index
The Concentration Index (CI) quantifies the degree of income-related inequality in a specific health variable and can be used to measure the degree to which health subsidies can better target the poor. There are various ways by which the CI can be calculated (Kakwani, Reference Kakwani1980), but there is an intense debate regarding the appropriateness of any given method. Most studies analysing health sector inequalities have adopted the method proposed by Wagstaff et al. (Reference Wagstaff, Paci and van Doorslaer1991); this was originally recommended for binary variables and takes the form:
 $$C\,{\equals}\,2{\rm cov}\left( {x,h} \right)/\mu $$
where cov(x,h) is the covariance between the relative rank of the variable (x) and the health variable itself (h) and µ is the average level of health.
However, this index (C) has some limitations (Wagstaff, Reference Wagstaff2005) and does not satisfy all the conditions of rank-dependent indices (see Kjellsson & Gerdtham, Reference Kjellsson and Gerdtham2012). Wagstaff himself maintained that since the bounds of the CI are probably dependent on the mean of the health variable, the Concentration Index should be normalized by dividing it either by the reciprocal of the mean of the variable or the bound of the Concentration Index. Another problem is that rankings of indices are sensitive to the type of health variable. Thus, different rankings are observed for inequalities in ill health and inequalities in health variables (Clarke et al., Reference Clarke, Gerdtham and Johannesson2002). Furthermore, the value of the index is arbitrary to a great extent when the health variable is of a qualitative nature (Erreygers, Reference Erreygers2006; Zheng, 2006). Fortunately, these loopholes have largely been resolved by the work of Erreygers (Reference Erreygers2009). The index proposed by Erreygers (generally denoted by E), which satisfies all the four properties desirable for a good rank-dependent index, has two versions: one for a binary variable and the other for continuous variable. Erreygers defined the corrected concentration index for a binary variable as:
 $$E\left( h \right)\,{\equals}\,{\rm }{8 \over {n^{2} }}\mathop \sum\limits_{i\,{\equals}\,1}^n Z_{i} h_{i} $$
where h
i
is a binary variable that is equal to 1 if the i
th child is fully immunized and 0 otherwise, and
 $ Z_{i} \,{\equals}\,{{n{\plus}1} \over 2}{\minus}\gamma _{i} , $
where n is the number of individuals in a given population and γ
i
denotes the socioeconomic rank of the individual ranging from the richest (γ
i
=1)to the poorest (γ
i
=n). The expression of the Concentration Index for a continuous variable (Erreygers, Reference Erreygers2009) is defined as:
 $$E\left( h \right)\,{\equals}\,{\rm }{8 \over {n^{2} \left( {b_{h} \,{\minus}\,a_{h} } \right)}}\mathop \sum\limits_{i\,{\equals}\,1}^n Z_{i} h_{i} $$
where bh is the maximum value of h and a h is the minimum value. In case of a binary variable (1, 0), the difference (b h −a h ) eliminates.
Decomposition analysis
Wagstaff et al. (Reference Wagstaff, van Doorslaer and Watanabe2003) proposed a procedure for decomposing the causes of health sector inequalities into the contributions of explanatory factors in the context of a linearly additive explanatory model. However, for a binary dependent variable the linear decomposition does not directly apply (Chen et al., Reference Chen, Eastwood and Yen2007). As a solution to this problem, Doorslaer et al. (Reference Doorslaer, Koolman and Jones2004) suggested the ‘marginal effects’ representation for the decomposition technique in the case of non-linear models with binary dependent variables. However, the problem with Doorslaer’s formulation is that it is based on an original formula of the Concentration Index, which itself is not free from flaws (see Wagstaff, Reference Wagstaff2005). To fix this technical fallacy, Erreygers (Reference Erreygers2009) provided a decomposition technique based on his corrected concentration index given by the following expression:
 $$E\left( h \right)\,{\equals}\,4\left[ {\mathop \sum\limits_{j\,{\equals}\,1}^q \theta _{j}^{{\asterisk}} V\left( {X_{j} } \right){\plus}V\left( {{\varepsilon}^{{\asterisk}} } \right)} \right]{\rm }$$
where
 $\theta _{j}^{{\asterisk}} $
represents the regression coefficient of the j
th variable, V(X
j
) is the Generalized Concentration Index of X
j
and V(ε*) is the generalized concentration index of the errors (Kjellsson & Gerdtham, 2013), where:
 $$V\,{\equals}\,{2 \over {n^{2} }}\mathop \sum\limits_{i\,{\equals}\,1}^n Z_{i} h_{i} $$
However, the problem still persists when the health variable depends on both binary and continuous explanatory variables, as is the case in the present study. Therefore, the formula provided by Erreygers (Reference Erreygers2009) is not strictly applicable here and needs further modification. An attempt was therefore made to derive the decomposition formula for a combination of continuous and binary explanatory factors. To begin with, for dependent variables that are binary in nature, the corrected Concentration Index is given by:
 $$E\left( h \right)\,{\equals}\, {8 \over {n^{2} }}\mathop \sum\limits_{i\,{\equals}\,1}^n Z_{i} h_{i} $$
Now, assuming h=f(x 1,x 2,x 3), the above expression is re-written as:
 $$E\left( h \right)\,{\equals}\, {8 \over {n^{2} }}\mathop \sum\limits_{i\,{\equals}\,1}^n Z_{i} f\left( {x_{{1,}} x_{{2,}} x_{3} } \right)$$
Where x 1 and x 2 are binary variables and x 3 is a continuous variable. For a linear model then the expression would be:
 $$E\left( h \right)\,{\equals}\, {8 \over {n^{2} }}\mathop \sum\limits_{i\,{\equals}\,1}^n Z_{i} \left( {a_{0} {\plus} a_{1} x_{1} {\plus} a_{2} x_{2} {\plus}a_{3} x_{3} {\plus}e_{i} } \right) $$
Here,
 $a_{i} $
values are the coefficients of the model, which are equivalent to a marginal effect. Since ∑Z
i
a
0=0:
 $$E\left( h \right)\,{\equals}\, {8 \over {n^{2} }}\mathop \sum\limits_{i\,{\equals}\,1}^n Z_{i} \left( {a_{1} x_{1} {\plus} a_{2} x_{2} {\plus}a_{3} x_{3} {\plus}e_{i} } \right)$$
or:
 $$E\left( h \right)\,{\equals}\,{8 \over {n^{2} }}a_{1} \sum Z_{i} x_{1} {\plus}{8 \over {n^{2} }}a_{2} \sum Z_{i} x_{2} {\plus}{8 \over {n^{2} }}a_{3} L\sum Z_{i} x_{3} {\plus}{8 \over {n^{2} }}\sum Z_{i} e_{1} $$
where
 $L\,{\equals}\,{1 \over {\left( {b_{h} {\minus}a_{h} } \right)}}$
(since
 $x_{3} $
is continuous in nature).
This equation gives the distribution of inequality in health variables across different explanatory variables when the model is linear. However, it requires some modifications to make it usable for non-linear models. This is because in a non-linear model coefficients are not equivalent to the marginal effect (Brooks, 2014). Thus, the marginal effect for each variable was derived using the following formula:
 $$a_{i}^{{\asterisk}} \,{\equals}\, \alpha _{{i }} p_{i} $$
Here a
i
, p
i
and
 $a_{i}^{{\asterisk}} $
stand for the coefficients, probabilities and marginal effects of the k
th variable. Thus, the relationship for a non-linear model for n cases is defined as:
 $$E\left( h \right)\,{\equals}\, {8 \over {n^{2} }}a_{1} p_{1} \sum Z_{i} x_{1} {\plus}{8 \over {n^{2} }}a_{2} p_{2} \sum Z_{i} x_{2} {\plus}{8 \over {n^{2} }}a_{3} p_{3} L\sum Z_{i} x_{3} {\plus}{8 \over {n^{2} }}\sum Z_{i} e_{1} $$
Substituting
 $a_{i}^{{\asterisk}} $
for a
i
,p
i
yields:
 $$E\left( h \right)\,{\equals}\, {8 \over {n^{2} }}a_{1}^{{\asterisk}} \sum Z_{i} x_{1} {\plus}{8 \over {n^{2} }}a_{2}^{{\asterisk}} \sum Z_{i} x_{2} {\plus}{8 \over {n^{2} }}a_{3}^{{\asterisk}} L\sum Z_{i} x_{3} {\plus}{8 \over {n^{2} }}\sum Z_{i} e_{1} $$
The following expressions were deduced using Eqns (1) and (2):
 $$\eqalignno{ & {8 \over {n^{2} }}\sum Z_{i} x_{1} {\equals}\,E\left( {x_{1} } \right) \cr & {8 \over {n^{2} }}\sum Z_{i} x_{2} {\equals}\,E\left( {x_{2} } \right) \cr & {8 \over {n^{2} }}\sum LZ_{i} x_{3} {\equals}\,E\left( {x_{3} } \right) $$
Thus, Eqn
 $(11)$
can be re-written as:
 $$E\left( h \right)\,{\equals}\left[ {a_{1}^{{\asterisk}} E\left( {x_{1} } \right){\plus}a_{2}^{{\asterisk}} E\left( {x_{2} } \right){\plus}a_{3}^{{\asterisk}} E^{'} \left( {x_{3} } \right){\plus}E\left( e \right)} \right]$$
Here,
 $ a_{1}^{{\asterisk}} E\left( {x_{1} } \right)\,$
and
 $a_{2}^{{\asterisk}} E\left( {x_{2} } \right)$
are contributions of binary variables, while
 $$a_{3}^{{\asterisk}} E^{'} \left( {x_{3} } \right)$$
reflects the contribution of continuous variables.
Results and Discussion
Spatial variation in full immunization of children
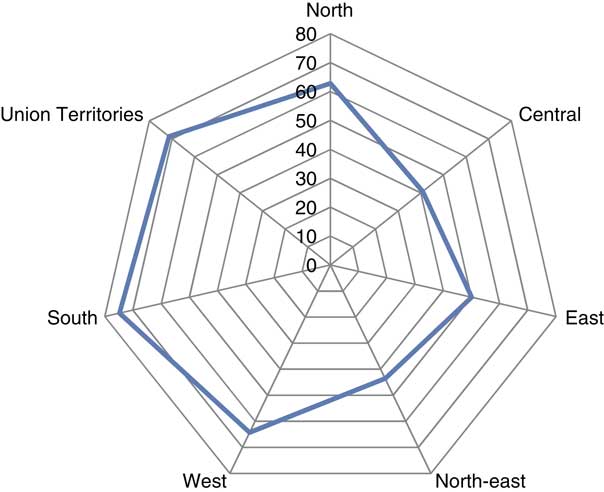
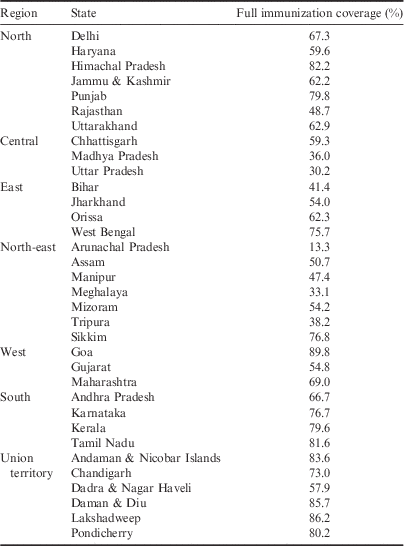
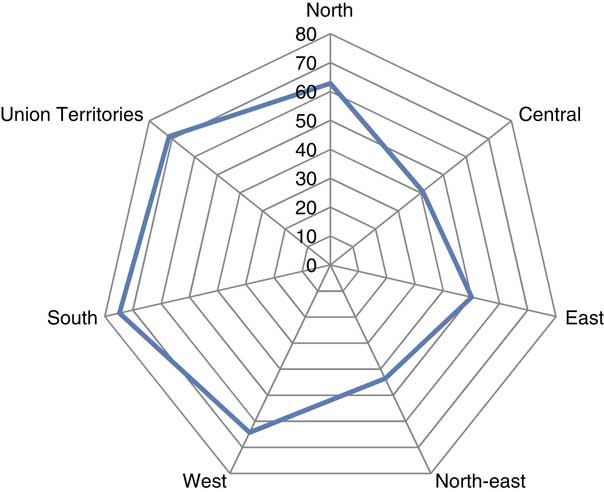
Considerable variation in full immunization coverage was found across the regions and states of India using the 2007–08 DLHS-3 data. Figure 1 shows that southern India had the highest coverage (74%), while the central region (40.8%) had the worst performance in terms of full immunization coverage. Table 1 shows that Tripura has been facing the worst situation with only 21.9% of children covered by full immunization, while Tamil Nadu was found to have the highest coverage at 79.6%. It was also found that more than 70% of children were vaccinated in Himachal Pradesh, Delhi, Punjab, Karnataka, Goa, Kerala and Tamil Nadu; however, Uttar Pradesh, Bihar, Orissa, Madhya Pradesh, and the states in the north-east, with the exception of Sikkim and Mizoram, had a coverage of less than 50%. Furthermore, immunization coverage was not uniform across union territories, and was found to be lowest (51.9%) in Dadra and Nagar Haveli, and highest in Pondicherry (80.6%).
Regional variation in full immunization of children aged 12–23 months. See Table 1 for regional classification of Indian states. Data source: DLHS-3, 2007–08. F=5.9 (p<0.01).
Full immunization coverage for states and union territories of India of children aged 12–23 months DLHS-3, 2007–08

Definition of selected variables

Inequality in coverage of specific components of full immunization
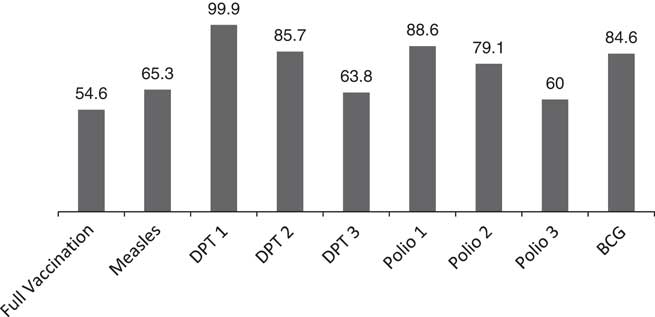
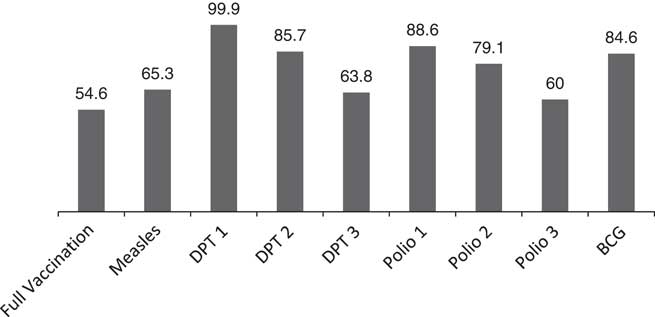
No uniformity was observed in the coverage of specific doses of vaccines required for full immunization among those who had had at least one vaccine (see Fig. 2). The percentage of children receiving a vaccine against measles was 65%, while the BCG, which is primarily used against tuberculosis, had a coverage of 85%. It is important to note here that the percentages of children receiving at least one dose of DPT and one dose of Polio were as high as 99.9% and 88.6%, respectively, but those figures for ‘three doses of DPT’ and ‘three doses of Polio’ fell drastically to 64 % and 60 % respectively. This indicates that some children who initiated the immunization schedule did not complete it successfully.
Percentage of children aged 12–23 months who received specific vaccine. Source: DLHS-3, 2007–08.
Wealth-based inequality in immunization
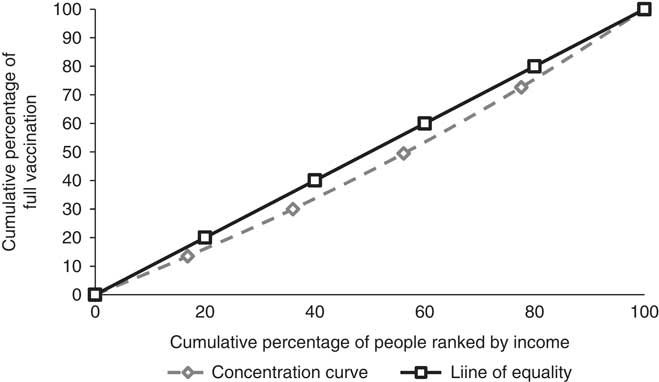
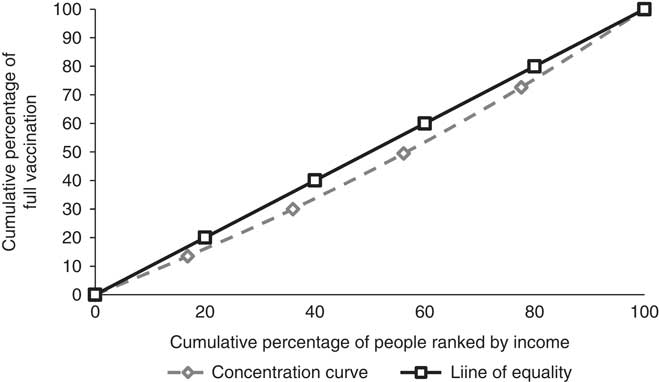
Figure 3 shows a concentration curve demonstrating the wealth-based inequality in immunization in the study sample. To draw this curve, the cumulative proportion of children aged 12–23 months with full immunization (ranked by wealth quintile, beginning with the lowest quintile) was plotted against the cumulative percentage of population (ranked by wealth quintile). The concentration curve lies below the line of equality. This implies that full immunization coverage is concentrated towards the richer section of the population.
Concentration curve. Source: DLHS-3, 2007–08.
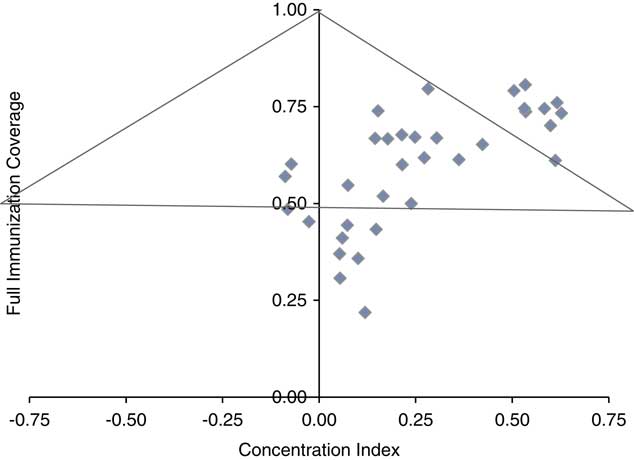
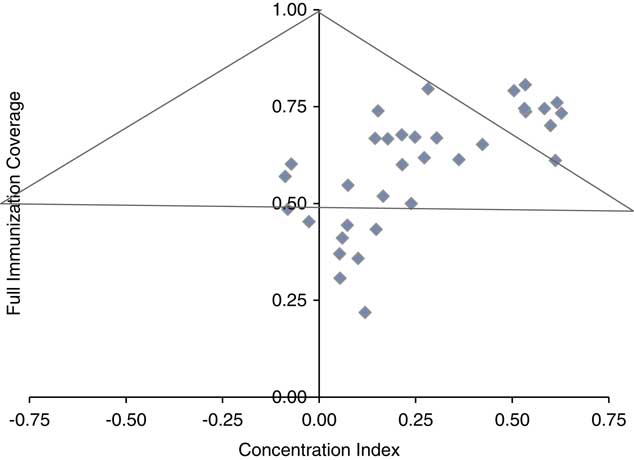
To see if there was any relationship between immunization coverage and the degree of its inequality across the states of India, the Concentration Indices for the different states were used as an indicator of inequality and the percentage of children covered by full immunization was plotted against this (Fig. 4). States were classified into four categories (I–IV) depending on their location. Most states were placed in the first quadrant (I), where inequality favouring the rich was accompanied by a high coverage of full immunization of children. This implies that, in most states, fully immunized children tended to belong to the higher income group. The states in the second quadrant (II) exhibited inequality favouring the richer segment but relatively lower immunization coverage. Thus, full immunization was less in such states and most of the children who were fully immunized were from a good economic background. These states included Arunachal Pradesh, Assam, Tripura, Meghalaya, Manipur, Uttar Pradesh and Madhya Pradesh. In these locations, lower coverage of full immunization was probably due to factors such as structural and institutional set up rather than economic status. Moving towards the third quadrant (III), it is observed that in Bihar and Orissa immunization coverage was less than 50%, but the inequality favoured the poor, implying that although full immunization coverage was less, it was concentrated in the poorer children. Finally, in Chattisgarh and Jharkhand (in the fourth quadrant IV) around 60% of children were immunized and it was concentrated in the lower income group. Therefore, in most parts of India it was observed that immunization coverage became high when it remained skewed towards the richer section of the community.
Inequalities in full immunization of children aged 12–23 months and its coverage by state. Source: DLHS-3, 2007–08.
Decomposition of inequality in full immunization
As a first step towards decomposition, it is necessary to identify the factors affecting child immunization in India. For this purpose, the following non-linear model was estimated:
 $$FI_{i} \,{\equals}\,{1 \over {1{\plus}e^{{{\minus}\left( {\alpha _{0} {\plus}\beta ^{'} Z^{'} {\plus}\gamma ^{'} V^{'} {\plus}{\varepsilon}_{i} } \right)}} }}$$
Here, Z ′ represents the vector of the key determinants of full immunization that were identified in a survey of the literature. It is important to note here that in addition to the key variables, a set of regional dummies were also included, which were captured by V ′. This model was estimated using the Generalized Linear Model approach. The results of the estimated model, along with decomposition measures, are given in Table 3.
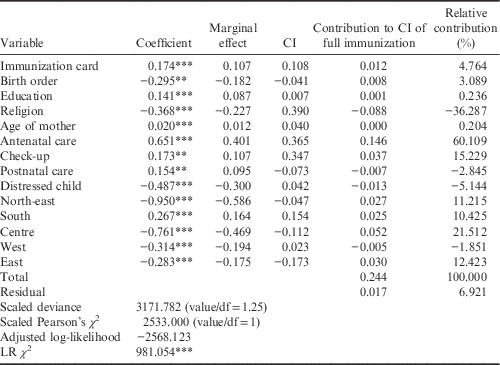
Decomposition of inequality in full immunizationof children aged aged 12–23 months, DLHS-3, 2007–08

Since the value of the intercept term is not required to estimate the contribution, it is not reported here.
The study could not include place of residence, working status of mother and population covered by health centre as these are highly correlated with other explanatory variables and hence invite a multicollinerity problem.
*p<0.1; **p<0.05; ***p<0.01.
It is important to note that various diagnostic tests, as reported in the final row of Table 3, justify the appropriateness of the model. Regression coefficients and their marginal effects are reported in the second and third columns, respectively, while the fourth and fifth columns report the CI and the contribution of the CI. Finally, the relative contribution of each explanatory variable in explaining inequality in complete immunization is presented in the sixth column. It may be noted that benchmark regions in this case include the northern region and union territories. The equation was estimated several times, including and excluding regional dummies, to find the appropriate benchmark regions. Though there is no hard and fast rule regarding the decision about benchmark regions, those regions were used as benchmark regions to reduce the degree of multicollinearity in the best possible manner.
Table 3, column 3, shows that the coefficient for possession of an immunization card was positive and statistically significant, indicating that the probability of full immunization was higher for children with an immunization card. This result is obvious because parents with a child immunization card will find this useful to follow the immunization schedule, and hence get their children vaccinated on time. Secondly, consistent with other studies (Pande, Reference Pande2003), it was observed that immunization status had a strong association with birth order. The negative sign of the coefficient indicates that higher birth order had a discouraging effect on child immunization. Similarly, mothers with at least 10 years of formal education are associated with a higher likelihood of child immunization. This can be attributed to changes that accompany maternal education, such as better communication and understanding, and changes in mind-set and superstitious beliefs, which enhance health-care-seeking activities.
These findings are consistent with those of other studies, which have emphasized the importance of maternal education for child immunization (Thang et al., Reference Thang, Bhushan, Bloom and Bonu2007). Consistent with Kumar and Ram (Reference Kumar and Ram2013) this study also found that the chance of childhood immunization increased with maternal age. This may be due to the effects of factors like knowledge and experience, which are accumulated over time, on the perceived importance of immunization and also on child fatalities that occurred due to poor immunization. The positive coefficients for antenatal and postnatal care suggest that for mothers, the seeking of pregnancy-related health care was associated with a higher likelihood of their children being fully immunized, compared with their counterparts who did not seek such health care. In the same way, newborn check-up, another health-care-related variable, was also found to be positively related to full immunization. This can be attributed to learning sessions that mothers are exposed to during healthcare, where the importance of the timely immunization babies is emphasized.
These results are in agreement with the previous literature concerning the importance of prenatal care utilization (Sahoo, Reference Sahoo2012). However, distressed children were found to be more likely to drop out of immunization schedules. Thus, children residing in rural areas, without an immunization card and not having received the first dose of polio were at highest risk of not completing the full course of immunization. There is also evidence of differences due to religious affiliation. The present study found that children from Muslim families had a lower probability of receiving full immunization compared with their counterparts in non-Muslim families. Finally, a significant regional difference was found in the immunization coverage of children in India. Compared with the benchmark regions (Union Territories), the chance of immunization drop-out was observed to be relatively higher among the children residing in the North-East, East, West and Central regions, and relatively lower for the children residing in the South region of India.
From the decomposition analysis, the CI value of having an immunization card was positive, indicating that availability of an immunization card is concentrated in the richer section of the community. Given this value of CI, using Eqn (3) it was found that the contribution of this variable was around 5%. That is, the existing inequality in availability of an immunization card contributed 5% inequality in full immunization across economic class. Similarly, differences in mother’s age and education also contributed positively to the biased distribution of child immunization. This result is quite expected because mothers belonging to higher income groups tend to have higher education and are slightly older at first delivery, and have better knowledge of health care and its benefits. Thus, they are more conscious of the need for immunization, and hence avail the immunization doses appropriately. Also, high birth order is concentrated towards the poorer sections of society, which is found to bring about an increase in inequality in the coverage by around 3%.
Antenatal care turned out to be the most vital factor, contributing 60% of the variation in full immunization. The probable justification for this finding may be that those women who receive antenatal care remain in touch with the institutional health care arrangements during pregnancy, and thus can easily be convinced about the need for immunization. This finding is further supported by the work of Srivastava and Saksena (Reference Srivastava and Saksena1998), who found that antenatal care promotes the acceptance of immunization. In addition, the composite effect of not having an immunization card, living in a rural area and deprivation of the first dose of polio (interaction term) was identified as another culprit, whose relative contribution was estimated to be approximately 5%. Thus, those children getting their first dose may be more likely to be fully immunized because their parents, through this course, are expected to believe that immunization is a basic need for their child, provided they are not deprived of the immunization card and urban facilities.
Moreover, the study also revealed that child immunization was less concentrated in Muslims and this inequality negatively contributed around 36% inequality in immunization. Furthermore, concentration of postnatal care and check-ups of newborns towards the richer section positively contributes to unequal access to immunization. Lastly, inequality in accessing immunization as a consequence of dwelling in the Eastern and Southern regions increased inequality in full immunization, whereas, residing in North-east, West and Central regions of India negatively contributed to this inequality. In short, it was observed that inequalities in antenatal care were the key factors behind the inequality in child immunization in India that existed in the country in 2007–08.
Policy recommendations
The results of this study clearly indicate that immunization coverage in India in 2007–08 was biased in favour of children who belonged to the economically better-off part of the population. The decomposition analysis revealed that antenatal care, medical check-up of children immediately after birth, availability of an immunization card and birth order contributed more than 80% of the total socioeconomic inequalities in full immunization coverage. Of these determinants, antenatal care alone stands out, with a contribution of about 60%. Thus, the obvious policy suggestion is to develop strategies to reduce the rich–poor inequality in uptake of antenatal care. Since it is not sensible to cut down the antenatal care of economically better-off women, this inequality should be minimized by increasing the participation of the poorer section of the community. Thus, the early registration of potential mothers for antenatal care may play an important role. In addition, personal interaction with pregnant women on the part of Accredited Social Health Activists (ASHAs) could bring about successful changes in behaviour.
Secondly, rich–poor inequality in the medical care of newborn babies was found to explain 15% of the inequality in immunization. The problem of inequality in medical care mainly arises because of a low institutional birth rate, especially in rural areas, which is mainly caused by high travel and subsistence costs for pregnant women and their accompanying family members. Therefore, the existing government policy to promote institutional delivery by providing cash transfers should be continued and the amount of transfer should be increased periodically.
Thirdly, inequality in possession of an immunization card mainly arises from a careless approach by poorer families to keeping the card well maintained. Therefore, there is a need to educate targeted parents about the importance of the immunization card for timely completion of immunization. In addition, parents who are below the poverty line (in the BPL category) could be given small financial incentives to keep the immunization card well maintained until their child is fully immunized.
Finally, relatively higher birth order of children among mothers belonging to poor families was found to be yet another reason for immunization inequality. Thus, there is a need to encourage these mothers to extend the gap between pregnancies. In this context, easy access to modern contraceptives and making them affordable for poorer families play a crucial role.