Introduction
Among adults aged 65 years and over, falls are a leading cause of unintentional injuries (Pointer et al., Reference Pointer, Harrison and Bradley2003; Scott, Reference Scott2005; Stevens et al., Reference Stevens2008), and in those aged 75 years and over, falls are among the leading causes that contribute to the burden of disease and injury (Begg, Reference Begg2007). Falls in elderly people can often result in a wide range of injuries, including soft tissue damage, head trauma, dislocations and fractures, restriction of activity, and a reduced quality of life – injuries that are exacerbated with increased age (Covinsky et al., Reference Covinsky2001; Rubenstein, Reference Rubenstein2006), particularly as risk of falling increases with age and between 10% and 15% of falls are injurious (Rubenstein, Reference Rubenstein2006). Consequently, injurious falls are a leading cause of hospitalization in people aged 65 years and over, accounting for over 80% of all injury admissions to hospital (Kannus et al., Reference Kannus2006). Furthermore, falls account for 40% of all injury-related deaths (World Health Organization, Ageing and Life Course Unit, 2008), and in elderly people, the 12-month risk of mortality after hospitalization following a fall is 50% (Rubenstein, Reference Rubenstein2006). Among elderly people, head injuries specifically account for 46% of fatal falls (Stevens et al., Reference Stevens2006). Repeated falls and physical instability are common indicators of nursing home admissions (Rubenstein, Reference Rubenstein2006). This has important implications for health-related policy, since in Australia, for example, by 2051 one-quarter of the Australian population will be aged 65 years and over (Australian Bureau of Statistics, 1998), a pattern that may be replicated across the globe. Rates of falling appear to vary markedly. For those adults aged over 65 years and living in the community, estimates for those who report falling once per year range from 20% to 40% (Tinetti et al., Reference Tinetti1988; Anstey et al., Reference Anstey, Sanden and Luszcz2006; Shumway-Cook et al., Reference Shumway-Cook2009) in comparison with 40% to 50% of residents in aged care facilities (Kron et al., Reference Kron2003). There is substantial economic burden associated with fall-related injuries. One recent international review indicated that between 0.85% and 1.5% of national healthcare expenditure in the developed world was associated with the costs of post-fall treatment (Heinrich et al., Reference Heinrich2010).
A range of factors have been identified as risk factors for falling in older adults (Covinsky et al., Reference Covinsky2001). These factors include physical characteristics that include having experienced a previous fall, impaired balance and gait and decreased grip strength, sedative use, and stroke (Tinetti et al., Reference Tinetti1988; Nevitt et al., Reference Nevitt1991; Graafmans et al., Reference Graafmans1996; Covinsky et al., Reference Covinsky2001). Psychological characteristics that have been identified as risk factors for falling include cognitive impairment, mental ill health, and poor self-referent attitudes relating to physical capacity (Tinetti et al., Reference Tinetti1988; Studenski et al., Reference Studenski1994; Graafmans et al., Reference Graafmans1996). Recently, the role of positive psychological constructs like morale and control has been identified as a significant predictor of falling (Anstey et al., Reference Anstey2008). In comparison with the effects of depression, comparative effects of control and morale were identified. While Anstey et al. (Reference Anstey2008) analyzed the effects of positive and negative psychological functioning independently, an examination of the concurrent effects of both positive and negative psychological functioning on the risk of falling remains to be explored. There is increasing evidence for the independent effects of positive and negative psychological functioning on both mental and physical health outcomes (Ryan and Deci, Reference Ryan and Deci2001; Huppert and Whittington, Reference Huppert and Whittington2003; Burns et al., Reference Burns, Anstey and Windsor2011). While those factors that predispose individuals to increased risk of falling, such as increased age and poor physical and mental ill-health, are well demonstrated, the role of positive psychological function as a protective mechanism to reduce falling risk remains to be explored. This study assessed the combined contribution of positive and negative psychological and physical functioning toward predicting the likelihood of falls and determining whether positive or negative dimensions report comparative effects on the likelihood of falls.
Methods
Participants
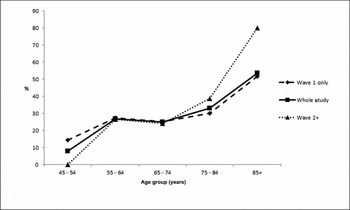
Data were drawn from the Dynamic Analyses to Optimize Ageing (DYNOPTA) project (Anstey et al., Reference Anstey2010) that involves pooling data from nine Australian longitudinal studies of aging. The harmonization of existing studies, by pooling data or parallel analysis, is increasingly recognized as an important method that contributes to and addresses the limitations of investment in individual longitudinal studies (Noale et al., Reference Noale2005). Overall, there were 50,652 respondents, aged 45–103 years, in the pooled DYNOPTA dataset at baseline, which was collected between 1990 and 2001. Of the four contributing studies to DYNOPTA that provided the necessary variables, one was the female-cohort study, the Australian Longitudinal Study of Ageing old cohorts. Consequently, a significant proportion of participants were female (93%), so we restricted our analyses to females (n = 13,223) only. Also, at baseline, the reported rate of falls ranged from 14%, for those aged 45–54, to 51%, for those aged 85 years and older (see Figure 1). This was consistent across the 13 years of available data. However, at subsequent observations it was clear that those who remained younger than 55 years of age over the duration of the study reported far fewer falls than those who were aged over 55 years. Subsequently, we excluded those who were younger than 55 years of age from our analyses. Therefore, our final sample size comprised women (n = 11,340) aged 55 years and over (Mean = 73.68; SD = 4.31) at baseline, who were observed for up to four occasions over 13 years (Mean = 5.30; SD = 2.53).
A comparison of the percentage of fallers by age group.

Measures
Vitality and Mental Health
We derived variables from the Short-Form Health Survey-36 (SF-36) (Ware et al., Reference Ware1998). The vitality and mental health indexes comprise the SF-36 mental health component score. The vitality subscale comprises four items, including “feel full of life,” “have a lot of energy,” “felt worn out,” and “felt tired.” The mental health subscale has been validated against clinical measures of depression (Rumpf et al., Reference Rumpf2001; Yamazaki et al., Reference Yamazaki, Shunchi and Green2005) and used in epidemiological studies worldwide (Skapinakis et al., Reference Skapinakis2005; Gill et al., Reference Gill2006). It comprises five items, including “been a nervous person,” “felt so down in the dumps nothing could cheer you up,” “felt calm and peaceful,” “felt down,” and “been a happy person.” For both the vitality and mental health subscales, participants indicated the extent to which they experienced each statement on a 6-point Likert-type scale, ranging from “0, none of the time” to “6, all of the time”, over the preceding four weeks.
To explore the dimensional nature of the vitality and mental health subcomponents of the SF-36 mental health scale component, we undertook a principal axis factor analysis with a Direct Oblimin rotation to determine whether the vitality and mental health items could discriminate between their parent factors. A Kaiser–Meyer–Olkin's measure of sampling adequacy score of 0.879 and the Bartlett's test of sphericity (χ 2 = 172830.499, df = 36, p < 0.001) revealed these items as adequate for factor analysis. Our factor analysis revealed two factors with eigenvalues >1, explaining 66% of the variance. A review of the loadings for each item reveals that the items loaded onto their respective parent scales at a level ≥0.32, the level at which the latent factor explains 10% of an item's variance. Two exceptions were for two mental health items, “felt calm and peaceful” and “been a happy person,” which reported cross-loadings of 0.34 and 0.35, respectively, on their non-parent scale. These cross-loadings were ignored since their loadings only met our inclusion criteria given the far stronger propensity of the vitality and mental health items to discriminate the two factors. We concluded that the factors were discriminate. In the DYNOPTA study, moderate cross-sectional correlations between vitality and mental health, with reported magnitudes of between r = 0.57 and r = 0.61, were consistently reported. Similarly, correlations between self-rated health with both vitality (r = 0.60 to 0.62) and mental health (r = 0.41 to 0.44), and correlations between physical health with both vitality (r = 0.62 to 0.65) and mental health (r = 0.23 to 0.26) were consistently reported. Despite these moderate associations, a significant amount of variance remains unexplained in either construct such as to warrant treating these variables as independent indicators of positive and negative dimensions of well-being.
Falls
At each wave of observation, falls were ascertained from self-reports of falling to the ground in the past 12 months.
Covariates
Socio-demographics: We controlled for participant gender and age.
Smoking: Baseline smoking consumption was assessed in terms of never-smoker, former-smoker, or current-smoker.
Alcohol: Following the guidelines of the National Health and Medical Research Council (Australia) (NHMRC) (2001), we categorized participants’ quantity and frequency of alcohol consumption to assess baseline levels of alcohol consumption as either low-risk, risky/high-risk, and abstinent.
Physical health and self-rated health: Physical Health was assessed with the SF-36 physical component score, which comprises a summation of physical function, role-physical, bodily pain, and general health (Ware et al., Reference Ware1998). Self-rated health was measured using the global health item from the SF-36 which requires participants to describe their general health on a 5-point rating scale from “1, excellent” to “5, poor.” Correlations between the SF-36 health variables over the four measurement occasions are reported in Table 1. Despite the reported strong correlations between some of our variables of interest, we judged correlates not to be significantly high to reflect possible multi-collinearity.
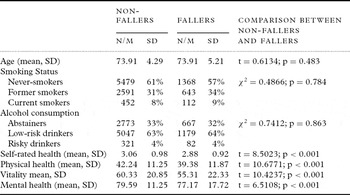
Baseline descriptive statistics by baseline falling status

Statistical analyses
Statistical analyses were undertaken using STATA v.10. Vitality, mental, physical, and self-rated health were coded so that high scores reflected positive health status and transformed into z-scores. We implemented random intercept logistic regression to determine the effects of vitality and mental health on likelihood of falls, adjusting for sex and time as years from baseline. Further adjustments were made with the inclusion of smoking (ref: nonsmoker) and alcohol (ref: low-risk drinker) consumption, physical health, and self-rated health. We considered implementing random effects for slope of time, but when specified, very little of the variance, between 2% and 5% for our various models, was indicated at the random slope level. Most of the random variances were accounted for at the intercept.
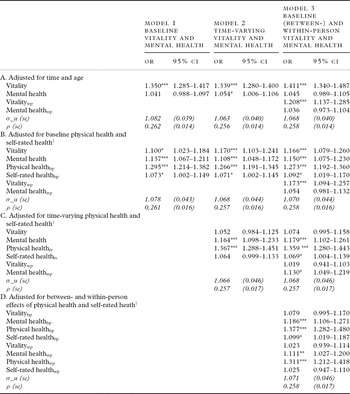
We tested three models; all were adjusted for age and time. All models except 1a, 2a, and 3a were adjusted for smoking and alcohol consumption. Model 1a tested the effects of baseline mental health and vitality on the likelihood of reporting falls after adjustment for age and time, while model 1b included an adjustment for baseline physical and self-rated health. Model 2a tested the effects of time-varying predictors on the likelihood of reporting falls, with further adjustments for baseline physical and self-rated health (model 2b) and for time-varying physical and self-rated health (model 2c). Models 3a to 3d incorporated between- and within-person effects for mental health and vitality. The between-person effects are constant that reflect participants’ scores at baseline. To assess the within-person change, a time-varying variable was created that reflects each individual's change from his or her baseline score. Model 3b was adjusted for baseline physical and self-rated health; model 3c was adjusted for time-varying physical and self-rated health; while model 3d was adjusted for between- and within-person effects for physical and self-rated health.
Results
Descriptive statistics for the whole sample and by falling status are detailed in Table 1. Age, smoking, and alcohol were unrelated to falling status. Fallers reported poorer physical health, self-rated health, mental health, and vitality. Model 1a (Table 2) indicated low baseline vitality and mental health, which were all standardized z-scores, as associated with a 35% and 4.1% increase in odds likelihood of falling over the period of observation. Most notable is the difference in the size of effect between vitality and mental health. Similarly, in model 2a, there was only a very small statistically significant association between time-varying mental health and likelihood of falls, but low time-varying vitality was associated with an increased likelihood of falls. A one standardized point increase in vitality was associated with a 33.9% increase in the likelihood of reporting falls. In model 3a, neither between-person nor within-person change in mental health was associated with the likelihood of reporting a fall. In contrast, both the between- and within-person effects for vitality reported 41.1% and 20.8% increase in the likelihood of reporting falls, respectively. These results would suggest that vitality is a better predictor of the likelihood of falls than is mental health, and that increased positive psychological functioning is more protective of the likelihood of falling.
Results of random effects logistic regression analyses of the baseline, time-varying between- and within-person effects of mental health and vitality on falls

***p = 0.001; **p < 0.01 *p < 0.05.
† Adjusted for baseline age, alcohol, and smoking.
For ease of interpretation, all predictors are reversed scored so that increased OR indicates effects for low scores on predictor variables. tv = time-varying variables; bp = between-person variables; wp = within-person variables; se = standard error.
We extended our analyses to control for additional covariates, smoking and alcohol consumption, and physical and self-rated health. The reference category for smoking and alcohol were nonsmoker and low-risk drinker, respectively; however, in all analyses, smoking and alcohol consumption were unrelated to the likelihood of falls. In model 1b, results were consistent with model 1a, although the inclusion of baseline physical health appeared to explain around half of the effect in baseline vitality. When treating mental health and vitality as time-varying in model 2b, and controlling for baseline physical health and self-rated health, vitality again reported a strong effect on the falls likelihood with low vitality associated with 17% increase in the likelihood of reporting falls. In comparison, poor mental health was associated with a 10.8% increase in the likelihood of reporting falls. The influence of physical health appears to be the strongest in cross-sectional analyses. For example, results in model 2c, which included time-varying physical and self-rated health, reflected results for model 1b, which indicated that around half of the effect for vitality is accounted for by physical health. Consistently, either very small or nonsignificant effects for self-rated health were reported between models.
Further investigation of the between- and within-person change in vitality and mental health (model 3b) indicated that controlling for baseline physical and self-rated health, and after adjustment for smoking and alcohol, did little to change the effects for between- and within-person vitality and mental health on the likelihood of reporting falls. However, the inclusion of time-varying (model 3c) and within-person change (model 3d) in physical and self-rated health did impact on the reported effects of vitality and mental health. In most instances, half of the between- and within-person vitality effects were accounted for by the inclusion of the physical and self-reported health variables, while the mental health effects were mostly consistent across all models. For instance, by comparing model 3a and model 3d, which included the between- and within-person physical and self-rated health variables, the increased likelihood of reporting falls for between-person vitality dropped from 41.1% to 7.9%, while the within-person vitality effect dropped from 20.8% to 2.3%. In contrast, the between- and within-person mental health effect increased from 4.5% to 18.6% and 3.6% to 11.1% respectively.
Post-Hoc Analysis
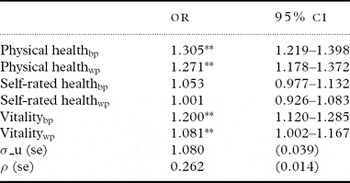
Since our earlier analyses compared the effect of vitality and mental health, a post-hoc analysis comparing the effect of vitality and physical health, excluding the mental health variable, allowed us to determine the degree to which the vitality effect is explained by physical health. A comparison of between- and within-person vitality and physical health effects, excluding mental health (Table 3), indicated an effect for vitality that was comparable with effects in models 1a, 2a, and 3a, and supports its utility as a mechanism for falls risk reduction.
Comparison of the effects of vitality and physical health on the likelihood of falling*

**p < 0.001.
*Adjusted for baseline age, alcohol, and smoking.
For ease of interpretation, all predictors are reversed scored so that increased OR indicates effects for low scores on predictor variables. bp: between-person variables; wp: within-person variables; se: standard error.
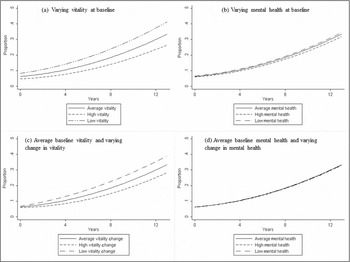
We plotted the effect of varying baseline and time-varying vitality and mental health on rates of falling in four separate scenarios (Figures 2a–d), to visually demonstrate the effect of different levels of vitality and mental health on rates of falling, over time. These plots reflect individuals who at baseline were aged 73 years of age (mean age in this sample), never smokers and low-risk drinkers, unadjusted for physical health due to the confounding effects reported in this study. In all scenarios, the proportion of fallers increases over time (increasing age). Specifically, in scenario 1, the proportion of fallers is moderated by the level (average, low, and high) of vitality at baseline (Figure 2a). In contrast, in scenario 2 (Figure 2b), moderating the level of mental health at baseline appears to have little impact on the proportion of fallers over time. Similar to scenario 1, scenario 3 (Figure 2c) again indicates the effect of different levels of vitality on proportion of fallers over time. In this case, increasing vitality was associated with lower proportions of fallers over time, while a decline in vitality was associated with higher rates of fallers. Finally, in scenario 4 (Figure 2d), change in levels of mental health was unrelated to changes in the proportion of fallers. Consequently, we would emphasize the benefit in targeting positive psychological functioning.
Plots to compare the effects of (a), varying baseline vitality (b), varying baseline mental health (c), time-varying baseline vitality, and (d) time-varying baseline mental health on the proportion who report falls over a 13-year period.

Discussion
Our primary aim was to compare the role of positive psychological vitality with indices of mental and physical health in predicting the likelihood of falling in the DYNOPTA sample over time. In all unadjusted analyses, vitality reported a much stronger protective effect on the likelihood of having a fall in comparison with the risk associated with poor mental health. In contrast, the inclusion of within-person change in physical health accounted for a large portion of the vitality effects, but we argue that this does not negate the importance of vitality. Indeed, the reduction in vitality effect can be explained by the strong inter-correlations between positive and negative mental health components and physical health. The correlations reported here (see Table 1) between the SF-36 health variables indicate strong relationships between vitality, physical, and mental health. Whilst vitality was more strongly related to mental health than to the physical health variables, vitality was more strongly related to the physical health variables than was the mental health variable. Consequently, the inclusion of both physical health and mental health variables accounted for much of the variance in vitality. That vitality should continue to report some effect after adjusting for all these covariates still needs to be highlighted.
A post-hoc analysis compared the effect of vitality and physical health, excluding the mental health variable, in order for us to determine the degree to which vitality effect is explained by physical health. Effects for vitality were comparable whether adjusting for physical or mental health only and support its utility as a mechanism for falls risk reduction. That the effect for vitality is so strongly influenced by within-person change in physical health indicates that there is a strong association between physical health and vitality that needs to be further explored. Three distinct hypotheses need to be tested: (1) Does vitality predict change in physical health? (2) Conversely, does physical health predict change in vitality? or (3) Is there a common cause that determines change in physical health and vitality concurrently?
Prior discussion on the factorial structure of the SF-36 (Ware et al., Reference Ware1998; Windsor et al., Reference Windsor2006) has indicated that the mental health and vitality scales load onto separate factors from the physical health variables and warrant distinguishing between physical and psychological health as related but independent factors. Analysis of the DYNOPTA sample supports the discrimination of physical and mental health components from their a priori structure (Bartsch et al., Reference Bartsch, Butterworth, Byles, Mitchell, Shaw and Anstey2011). Furthermore, the current authors have undertaken factorial analysis of the SF-36 vitality, mental health, and physical function items within the DYNOPTA (not reported here) and indicated that the vitality and mental health items are more related to each other, supporting the notion that the mental component is distinct from the physical health component. In a yet-to-be-published study, the authors have found that the vitality and mental health items reflect distinct lower order factors of a higher level mental component as hypothesized in the SF-36 measurement. Consequently, while there is a degree of inter-factor correlation, there is still enough distinction to warrant conclusions over the independent effects of positive and negative dimensions of psychological function (vitality and mental health) and physical health.
Limitations
While we believe that a large sample size, followed for up to four observations over a 13-year period, provides a level of robustness to our findings, a number of limitations to the study design need to be highlighted. First, due to the inclusion of two female-cohort studies, males contributed less than 10% of the sample for whom available vitality, mental, health and falls data were available. Consequently, our analyses pertain to females only. Further investigation should utilize data from male participants in the DYNOPTA study, as their sample size (n = 876) would suggest that an independent investigation of the role of positive psychological functioning on the likelihood to fall in males would still be informative. Other limitations include the reliance on self-report assessments for our variables of interest, particularly the lack of a clinical psychiatric mental health assessments, objective physical health assessments, and self-reported falls. However, the SF-36 has been validated against benchmarks of physical and mental health (Ware and Gandek, Reference Ware and Gandek1998; Rumpf et al., Reference Rumpf2001; Skapinakis et al., Reference Skapinakis2005). Also, one meta-analysis reported high specificity (91% to 95%) and acceptable sensitivity (80% to 89%) with self-reporting methods of recording falls in comparison with the prospective calendar method, the gold standard method for reporting falls (Ganz et al., Reference Ganz2005).
Conclusions
In conclusion, vitality reports stronger effects on likelihood of falling than mental health and is comparable with the effects of physical health. However, when adjusting for vitality, mental, and physical health simultaneously, much of the variance in vitality is accounted for by its strong cross-sectional associations with mental and physical health. Despite this, even when controlling for mental and physical health, between- and within-person effects for vitality are still reported and strongly indicate its utility in predicting the likelihood of falls in a sample of elderly women. We conclude that vitality and related positive psychological constructs provide individuals with a degree of protection from the likelihood of falling. Subsequent research should determine the dynamic reciprocal nature of the relationships between positive and negative psychological and physical health constructs, which are so strongly related with important health outcomes like falling.
Conflict of interest
None.
Description of authors' roles
All authors have read and approved the final version of this paper. Specifically, RAB formulated the research question, determined the analytical methods and undertook the statistical analysis, and led the writing of the paper. JB supervised the data collection, contributed to the analytical method and analyses, and contributed to the writing of the paper. PM supervised the data collection and contributed to the writing of the paper. KJA supervised the data collection, contributed to the analytical method and analyses, and contributed to the writing of the paper.
Acknowledgments
This work was supported by a National Health and Mental Medical Research Council grant (# 410215). The data on which this research is based were drawn from several Australian longitudinal studies, including the Australian Longitudinal Study of Ageing (ALSA), the Australian Longitudinal Study of Women's Health (ALSWH), the Australian Diabetes, Obesity and Lifestyle Study (AusDiab), the Blue Mountain Eye Study (BMES), the Canberra Longitudinal Study of Ageing (CLS), the Household, Income and Labour Dynamics in Australia study (HILDA), the Melbourne Longitudinal Studies on Healthy Ageing (MELSHA), the Personality and Total Health Through Life Study (PATH), and the Sydney Older Persons Study (SOPS). These studies were pooled and harmonized for the Dynamic Analyses to Optimize Ageing (DYNOPTA) project. All studies would like to thank the participants for volunteering their time to be involved in the respective studies. Details of all studies contributing data to DYNOPTA, including individual study leaders and funding sources, are available on the DYNOPTA website (http://DYNOPTA.anu.edu.au). The findings and views reported in this paper are those of the authors and not those of the original studies or their respective funding agencies. Anstey is funded by an NHMRC Fellowship #1002560.