One of the most difficult questions in economics is resolving the discrepancies between standard valuations of individual welfare and individual behaviors, choices, and stated preferences.Footnote 1 Behavioral economics provides myriad examples of standard assumptions about individual welfare maximization failing to explain actual behaviors and choices. Broad categories of behaviors and choices departing from standard assumptions include: individuals valuing losses disproportionately to gains; consumption choices which are deleterious to long-term welfare, such as smoking and drug use; and failure to take up opportunities and incentives, such as subsidies for moving to better neighborhoods or options to enroll in health insurance programs, among others.
The economics of happiness, which is based on surveys of subjective well-being, also reveals large discrepancies between stated preferences and objective measures of welfare.Footnote 2 Individuals with compromised health or in destitute conditions often report high levels of happiness; in contrast, others who have made significant income gains may report high levels of frustration (Graham & Pettinato, Reference Graham and Pettinato2002). At the macro level, there is often a “paradox of unhappy growth,” in which well-being levels fall during periods of very rapid economic growth – as in China at the height of its growth boom a decade ago (Graham, Reference Graham2011; Easterlin, Morgan, Switek & Wang, Reference Easterlin, Morgan, Switek and Wang2012). In general, people seem to be better able to adapt to unpleasant certainty than to uncertainty, even that which is associated with progress. People with difficult but stable health conditions, such as paraplegics, tend to report much higher levels of well-being than do those with unpredictable ones, such as epilepsy or anxiety (Graham, Higuera & Lora, Reference Graham, Higuera and Lora2011).
Such discrepancies pose a practical challenge to benefit-cost analysis (BCA). Benefit-cost analysis provides policymakers with a useful frame to determine the potential costs and benefits of allocating scarce resources across programs and people. Commonly used approaches underlying it assume fairly uniform responses to incentives and aversion to risk. Contingency valuations, for example, often rely on individuals’ willingness to trade off one hypothetical factor, such as years of life, for another, such as a riskier but higher paying job. Individuals’ so-called willingness to pay (WTP) is then used as the basis for calculating the value of a statistical life (VSL), which is used in a range of calculations, such as rewards for injuries or deaths in law suits, and/or assessing the potential costs of benefits of particular policy interventions designed to mitigate risky behaviors, among many others.Footnote 3
Yet precisely because of the kinds of discrepancies described above, responses to such queries are often inconsistent or biased. Individuals may mispredict risks because of weak understanding of those risks (so that they seem more remote than they actually are) or because of short-term time horizons or inconsistent time preferences, among other reasons. The implications of these discrepancies across individuals and their implications for standard WTP and VSL approaches add complexity to the challenges of accurate cost-benefit analysis (CBA), both in terms of making interpersonal comparisons and of making aggregate valuations for society as a whole. Better understanding the underlying puzzles is important to informing policy design and outcomes in BCA and beyond.
This symposium provides insights from a number of perspectives. In the remainder of this essay, I discuss what the metrics of subjective well-being can contribute, with examples from my research on the variance in distinct dimensions of well-being across individuals and socio-economic cohorts. The findings highlight the role of differences in future outlooks and related discount rates as individuals make critical choices, such as whether or not to take up incentives and opportunities or to invest in health care. These very different outlooks – and valuations – of the future are likely to affect things such as WTP responses and VSL valuations, and need to be better taken into account in the design of BCA. The findings that I review in this paper provide insights into the extent of the problem and its roots; the metrics that we use to assess these different views of the future, meanwhile, could in turn be helpful in contributing to better BCA.
Well-being metrics and questions
The measurement of well-being has developed into an increasingly accepted approach in economics and in the social sciences more generally. The metrics are particularly useful for exploring questions that revealed preferences do not provide good answers to, such as situations where respondents do not have the capacity to reveal a preference or when behaviors are driven by norms, addiction, or self-control problems. Such questions include the welfare effects of macro and institutional arrangements that individuals are powerless to change, with inequality a prime example, and of strong normative arrangements, such as discrimination and/or caste systems. They also include the explanation of behavioral choices such as excessive smoking and/or food or alcohol consumption.
The most recent research makes clear distinctions between two well-being dimensions: evaluative – which encompasses how people think of their lives as a whole – and hedonic – which captures how people experience their daily lives (Stone & Mackie , Reference Stone and Mackie2013; Graham & Nikolova, Reference Graham and Nikolova2015). Individuals with higher levels of evaluative well-being have more of a sense of what their futures look like and thus are more likely and more able to delay gratification today to make investments in those futures. Individuals with less agency or capacity to craft their futures (and lower prospects of upward mobility) may focus more on the daily experience dimension of well-being precisely because their future outlooks are far less certain and within their sphere of influence.
Another important dimension of well-being, which we know less about is eudemonia – the extent to which people have purpose or meaning in their lives. It is implicitly captured in evaluative well-being metrics. There are some new efforts underway to measure it explicitly, including in the well-being modules of the British Office of National Statistics, using a question which asks respondents the extent to which they feel that the things they do in their lives are worthwhile (Adler, Dolan & Kavetsos, Reference Adler, Dolan and Kavetsos2014; Office of National Statistics, 2013).
Not surprisingly, based on the existing evidence, eudemonic well-being tracks more closely with life satisfaction, the evaluative metric, than with the hedonic metrics. At the same time, more research work is necessary to understand how eudemonic well-being tracks with daily experiences. Paul Dolan makes the important point that there are a number of experiences which are pleasurable but not meaningful, such as watching television, and others which are meaningful but not pleasurable, such as reading the same story to a child over and over again (cited in Stone & Mackie , Reference Stone and Mackie2013). Whether or not people have the capacity to lead fulfilling and purposeful lives – and how that is linked to their future outlooks and discount rates – is an important implicit theme in this discussion.
Well-being, attitudes about the future, and behavioral outcomes
The science has developed to a point that scholars are able to tease out causal channels related to different dimensions of well-being and related attitudes. For example, individuals with higher levels of well-being (on average) tend to have higher prospects of upward mobility and, as a result, invest more in their own and in their children’s future. These investments are, in turn, reflected in better labor market and health outcomes (Graham, Eggers & Sukhtankar, Reference Graham, Eggers and Sukhtankar2004; De Neve & Oswald, Reference De Neve and Oswald2012; De Neve, Diener, Tay & Xuereb, Reference De Neves, Diener, Tay, Xuereb, Helliwell, Layard and Sachs2013).
What is less well known is the exact channel whereby this operates. Experimental economics work suggests it may be via positive emotions (Oswald, Proto & Sgroi, Reference Oswald, Proto and Sgroiforthcoming; Ifcher & Zarghamee, Reference Ifcher and Zarghamee2011). Psychologists have shown that positive emotion influences self-control and performance, as well as the capacities of choice and innovative content, memory recall, and tendency toward altruism (Isen, Reference Isen, Lewis and Haviland2000; Isen, Shalker, Clark & Karp, Reference Isen, Shalker, Clark and Karp1978). Both bodies of work, while nascent, suggest a role for intrinsic versus external motivation (see also Benabou & Tirole, Reference Benabou and Tirole2003). Recent work on well-being in the United States by Kahneman and Deaton (Reference Kahneman and Deaton2010) finds that emotional well-being and income are positively correlated only up to median levels (roughly $75K). Thus more income does not buy positive emotions – which are in large part inherently determined – but insufficient income makes it more difficult to manage and get beyond negative ones.
A related example comes from our work on the Gallup World Poll (GWP) data. We find that, when queried about well-being, the rich are more likely to highlight the role of work and good health in their lives, while poor people are more likely to highlight friends and religion as social insurance mechanisms. Work and health allow those with means to make choices and pursue the kinds of lives they want to lead. Those without means often face stressful and difficult daily existence, resulting in short-sighted and risk-averse decision making and a greater need for safety nets (Graham & Nikolova, Reference Graham and Nikolova2015; Graham & Lora, Reference Graham and Lora2009; see also Haushofer & Fehr, Reference Haushofer and Fehr2014). Another example of this is a recent study of working hours in the United States by Lambert and colleagues (Reference Lambert, Fugiel and Henly2014). They find that 41% of hourly workers learn their schedules less than a week in advance – more than know at least a month in advance, and half of hourly workers have no control over their schedules. Related studies show that unpredictable working hours exacerbate stress, harm health, and attenuate work–life conflicts (Reeves, Reference Reeves2014).
A telling insight into the very different lives and future outlooks of poor and rich cohorts in the United States comes from David Leonhart and colleagues (Reference Leonhart2014). They used social media data to show the stark differences in the lives that Americans lead, depending on where they live. The authors found that the words that stood out in “difficult” places were guns, video games, hell, diets, and diabetes – living at the moment. Those most common words in the “easiest” places to live were Ipads, Baby Bjorns, baby joggers, and exotic places like Machu Picchu. People who live in the difficult America live day to day, challenged with health and other problems, and rely on guns, games, and religion as means to surmount those challenges. Those in easy places have access to high-end technology, knowledge, travel, and exercise, and are transmitting their lifestyles and expectations to the next generation. These very different future outlooks are likely to have an influence on the differential values that respondents place on the present versus the future in the kinds of questions that underlie BCA.
A critical question, then, although one which is difficult to prove definitively, is the linkages between well-being and positive attitudes about the future and behavioral outcomes. We lack sufficient data following the same people over time, which would allow us to compare their attitudes in t-0 with their outcomes in t-1, controlling for other factors. In addition, the causal channels entail a mix of objective circumstances which determine future outlooks on the one hand, and unobservable personality traits on the other. Despite these difficulties, there is a growing body of literature that suggests that these linkages indeed exist, and that they relate to outcomes in the health, income, and individual/social behavior arenas.
Some of my very early work in this area, co-authored with Graham et al. (Reference Graham, Eggers and Sukhtankar2004), based on panel data for Russia, showed that residual or unexplained happiness in an initial period regression (in t-0) was correlated with higher levels of income and better health in later periods. The effects were greater for individuals at lower levels of income. And, indeed, one can imagine that for workers with less income and education to leverage, a positive attitude or cheery character may well have pay-offs in the labor market. Similarly, Ed Diener and colleagues, based on a study of college students, found that college students who had higher levels of cheerfulness did better in later life, in both the income and friendship realms.
Eggers, Sukhtankar, and I also found that the same individuals who had higher levels of residual happiness also had higher prospects of upward mobility for themselves and their children, as measured by questions about whether they thought that hard work would get them ahead in the future and/or whether their children would live better than they. In the empirical section of the paper, we focus on the question of whether or not individuals have high prospects of upward mobility depending on where they are in the income distribution, based on a question about whether or not hard work will get them ahead.
De Neve and co-authors (Reference De Neves, Diener, Tay, Xuereb, Helliwell, Layard and Sachs2013) conducted a review of the research on well-being and positive outcomes. They found that there were benefits in the health arena, such as longevity: reduced inflammation, improved cardiovascular health, immune and endocrine systems, lowered risk of heart disease, stroke, infection, healthier behaviors, recovery speed, survival and longevity; and also in the income and social arenas: increased productivity; peer-rated and financial performance; reduced absenteeism; creativity and cognitive flexibility; cooperation and collaboration; higher income; organizational performance; reduced consumption and increased savings; employment; reduced risk taking (seat belts study); pro-social behavior (altruism, volunteering); sociability, social relationships, and networks; and longer term time preferences and delayed gratification.
De Neve and Oswald (Reference De Neve and Oswald2012) used a large U.S. representative panel to show that young adults who report higher life satisfaction or positive affect grew up to earn significantly higher levels of income later in life. They used twins and siblings as comparison controls and accounted for factors such as intelligence and health, as well as the human capacity to imagine later socio-economic outcomes and anticipate the resulting feelings in current well-being. Ifcher and Zarghamee (Reference Ifcher and Zarghamee2011), based on experimental data, isolate the effects of mild positive affect in reducing time preferences over money and in the ability to delay gratification. Oswald et al. (Reference Oswald, Proto and Sgroiforthcoming), also based on experimental data, showed that positive affect induced by video clips resulted in subjects putting forth a greater quantity of output (10%–12%) although no difference in quality. They also found that bad moods induced by bereavement or illness in the subjects’ families had a negative effect on productivity.
Other studies isolate the effects of life satisfaction and positive affect in the health arena, effects which include reduced inflammation, better cardiovascular health and immune systems, and healthier behaviors, among others (Blanchflower, Oswald & Stewart-Brown, Reference Blanchflower, Oswald and Stewart-Brown2013; Davidson, Mostofsky & Whang, Reference Davidson, Mostofsky and Whang2010; Kubzansky, Gilthorpe & Goodman, Reference Kubzansky, Gilthorpe and Goodman2012). The same studies identify stress as a factor which can hinder healing after injury. Of course it could be that healthier people are happier and not the other way around, or that causality runs in both directions (Graham, Reference Graham2008). Some studies have been able to isolate the linkage from happiness to health, such as optimism predicting future outcomes like immune function and cancer outcomes, controlling for health and demographic factors, and optimism and positive emotions protecting against cardiovascular disease (Rasmussen, Scheier & Greenhouse, Reference Rasmussen, Scheier and Greenhouse2009; Boehm & Kubzansky, Reference Boehm and Kubzansky2012).
A related and relevant area is individual and social behaviors. As noted above, positive affect seems to be linked to less preference for consumption in the present rather than in the future, and happy individuals seem to be motivated to pursue long-term goals despite short-term costs. In contrast, lack of self-control is related to overconsumption and unhappiness, as in the case of excessive television watching, cigarette smoking, and obesity (Frey, Benesch & Stutzer, Reference Frey, Benesch and Stutzer2007; Gruber & Mullainathan, Reference Gruber and Mullainathan2005; Graham, Reference Graham2008). Greater self-control and longer term time preferences among happier people have also been linked to consumption and savings behaviors. Based on longitudinal household data from Germany and the Netherlands, Guven (Reference Guven2012) finds that happier people are more likely to consume less and save more than others, and also had higher perceived life expectancies. Goudie, Mukerjee, De Neve, Oswald and Wu (Reference Goudie, Mukerjee, De Neve, Oswald and Wu2014) find that individuals with higher levels of subjective well-being were more likely to wear seat belts and less likely to be in motor vehicle accidents, highlighting longer time preferences and less risk taking.
In short, while this is a novel area, there is sufficient and growing evidence to suggest that higher levels of well-being and optimism about the future are correlated with behavioral outcomes of interest, many of which hinge on the ability to invest in the future rather than simply living in the present. The latest developments in well-being measurement make clear distinctions between hedonic (daily experience) and evaluative (life-course) dimensions, and as such provide an additional opportunity for research to explore how the different dimensions relate to future outlooks, time preferences, and individual behaviors.
Some work suggests that respondents emphasize each of these dimensions differently because of their capabilities and abilities to plan for and determine their futures. The very poorest typically focus on the daily experience dimension of well-being, as they do not have the luxury of longer time horizons. “Poverty is a demanding, stressful, depressive, and often violent state. No one seeks it; they are born or thrust into it. In poverty, the whole of your life becomes an exercise in coping and correcting, searching for a way up and out, while focusing today on filling the pots and the plates, maintaining a roof and some warmth, and dreading the new challenges that tomorrow may bring” (Blow, Reference Blow2014).
There is increasing evidence that those individuals constrained by the scarcity of poverty have much more difficulty planning ahead and investing in their futures, in part because they have less financial capacity to make those investments and in part because they have less faith that they will pay off. Mullainathan and Shafir (Reference Mullainathan and Shafir2013) show that scarcity creates a distinct psychology for everyone struggling to manage with less than they need. Busy people fail to manage their time efficiently for the same reasons the poor and those maxed out on credit cards fail to manage their money. Recent research based on experiments on the benefits of transfer programs in Kenya finds that the stress associated with living day to day contributes to short-sighted and risk-averse decision making. Stress can limit attention, resulting in an emphasis on habitual behaviors at the expense of goal-oriented ones (Haushofer & Fehr, Reference Haushofer and Fehr2014).
New experimental work on the Affordable Care Act expansion in the United States shows that high discount rates (based on perceptions of the future) and inconsistent time preferences are significant variables in explaining the lack of take-up of health insurance by eligible participants (Barofsky, Reference Barofsky2015). That work highlights that the same respondents are more impatient than the average and have difficulty planning ahead, echoing the findings on stress.
This contrasts strongly with the perspective of those with greater capabilities and life choices. Thus when respondents with more means are asked about their own lives and well-being, they are more likely to think about their lives as a whole – the evaluative dimension. This difference shows up in the data when specific questions pertaining to each dimension are included. The above-cited Kahneman and Deaton (Reference Kahneman and Deaton2010) work shows that not having enough means is bad for both dimensions of well-being, but after a certain point more money does not make daily experience better. In contrast, the correlation between income and evaluative well-being continues up to the highest levels of income. This is because people with more income have greater capacity to lead the kinds of lives that they want to lead.
Our initial look at the differences in well-being – across dimensions and quintiles – in the United States confirms the general direction of these findings. It suggests very different future outlooks and attitudes between the poor and the rich. If these outlooks and attitudes are indeed linked to discount rates and willingness and ability to invest in the future, then the stark gaps in the lives and opportunity of the rich and poor in the United States – which stand out compared to those in other places – will only grow larger.Footnote 4
In what follows, I use well-being metrics to look at differences across rich and poor cohorts in the United States, with a comparative look at Latin America. The latter is relevant because despite its age-old image as a very unequal region, poverty rates have fallen markedly and inequality has decreased slightly in the past decade, with related changes in mobility. We find stark gaps in both dimensions of well-being across the rich and poor in the United States, gaps which are particularly large in terms of stress and in attitudes about upward mobility. Indeed, these gaps are much larger between the poor and the rich in the United States than they are in Latin America.
The data
The research is based on the GWP and the Gallup Healthways surveys. The GWP has surveyed annually in roughly 160 countries worldwide since 2005, with one wave per year. It has nationally representative coverage in most countries. Gallup weights the data in each country – and the sample size ranges from more than 4000 household interviews in China every year to 500 households in Puerto Rico. While the poll covers most existing countries around the world, with a very few exceptions, a drawback is that there are proportionately more responses for small countries than there are for large ones. Different individuals are interviewed each year and thus we have pooled cross-sections of data – including year dummies – rather than a panel.
Gallup Healthways has provided extensive daily household level data since January 2008 and running through 2013 (the last year for which we have updated data). It is a stratified sample of an average of 1000 households across the United States (all localities with land-line phones and mobile cell phone connections), surveyed almost every day for the entire period, and thus has a very large number of individual observations. The questions include the usual demographic details of the respondents (age, race, ethnicity, household size, education level); economic conditions (employment status, job security, job mobility); respondents’ perceptions about their standards of living and the state of the economy; access to services (such as health insurance, medical care, telephone and internet); geographic location (Zip code, MSA (Metropolitan Statistical Areas) and FIPS (Federal Information Processing code)), and personal health, emotional experiences, and emotional conditions, among others. It is, again, cross-section rather than panel.Footnote 5 Later stages of this work (beyond the time frame of this paper) will use panel data for the United States, such as the PSID (Panel Study on Income Dynamics), which now also includes life satisfaction data. In the instances where panel data are available, the research will explore (to the extent possible) how attitudes about inequality and mobility link to behavioral outcomes of interest, such as investments in education and in the labor market.
Empirics
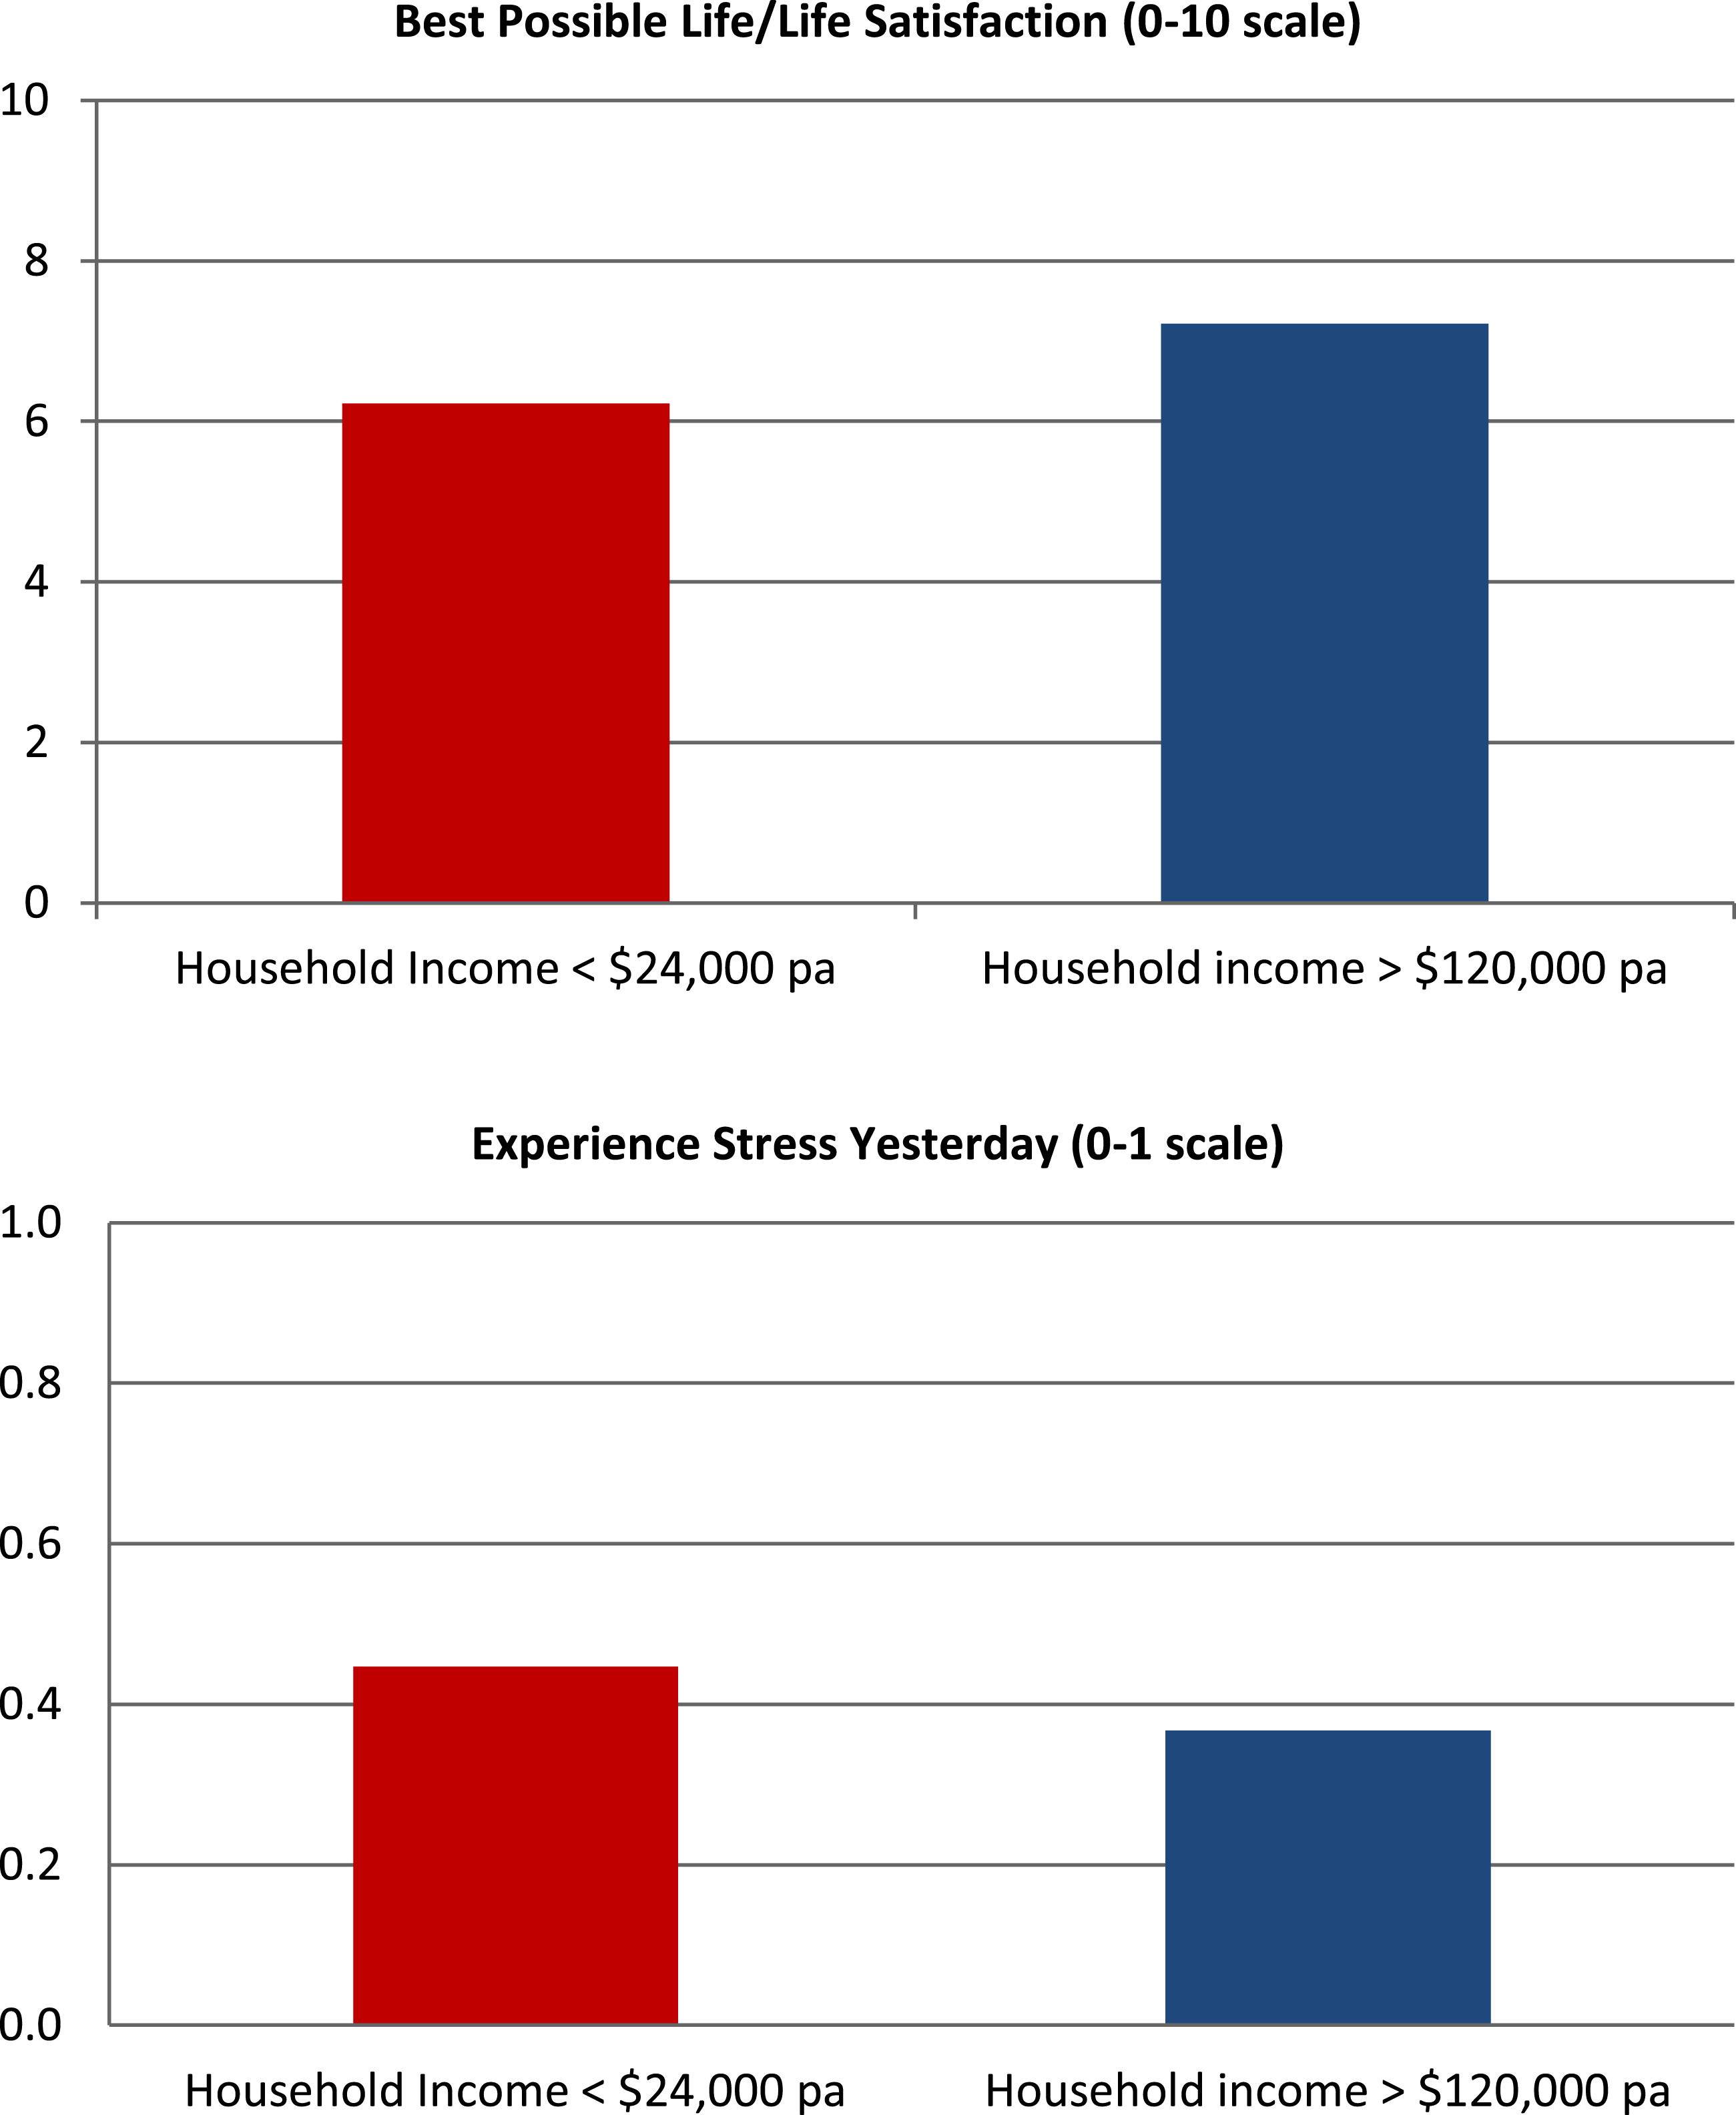
In a simple first-step exercise, we compared the well-being scores of the poorest and richest Americans based on the Gallup Daily Poll. For evaluative well-being we used the standard question in the Gallup Poll, the Cantril ladder question. This question asks respondents to compare their lives to the best possible life (BPL) they can imagine on a ladder where 0 represents the worst life and 10 represents the BPL. We also used a negative hedonic question (stress), which simply asks respondents whether or not they experienced stress the day before, with possible answers being yes/no. Respondents in the poorest income quintile experience higher levels of stress in their daily lives than do those in the highest one, and they score much lower than those in higher ones when they are asked to assess about satisfaction with their lives as a whole. The latter is a metric which captures respondents’ ability to make choices and control their lives, among other things (see Figure 1).
Life Satisfaction and Stress Differences across Rich and Poor Americans. Note: Histogram bars indicate the mean response per income category in the Gallup poll and correspond, roughly, to income quintiles 1 and 5. All differences of response means are statistically significant at the 1% level. The best possible life (bpl) question scales run from the worst possible life imaginable (0) to the best one (10); stress yesterday is a simple yes (1) or no (0) response. The 10% difference on the bpl question is large and equivalent in life satisfaction terms to moving from Denmark – the happiest country in the world – to Qatar or Belgium, or, within the United States, of getting a college degree rather than just a high school one. Source: Graham (Reference Graham2014).

We next compared the United States and Latin America – a region long known for its inequality but where inequality has been decreasing slightly in recent years – in greater detail. In this instance we are used the GWP data for 2005–2013, as it has the same survey metrics and time frame for both places.
For evaluative well-being, we again used the Cantril ladder question. We used two measures of hedonic well-being: the stress question and then another one about smiling yesterday (both are yes or no questions, on a 0–1 scale), as positive affect and negative affect do not always track together. The focus on stress is particularly relevant, due to the above-cited literature showing that high levels of stress associated with constant daily struggles and insecurity are not only related to short-time horizons but eventually even to different cognitive processes when it comes to planning for the future. And, of course, inability to plan or envision the future will result in very different valuations in responses to WTP and other VSL questions.
As a gauge of mobility attitudes, we used a question which asks respondents: “Can people in this country get ahead if they work hard or not?” (with possible answers being yes/no, 1-0). This is a question which we have used in the past as a gauge of mobility attitudes in other research, as is noted in the literature review section above.
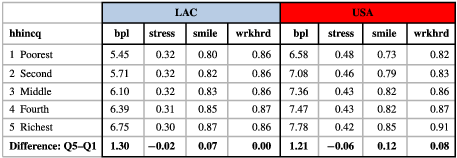
As above, a simple look at the mean responses for the lowest and highest quintiles for each sample (averaged out for 2006–2013) is telling.Footnote 6 Indeed, the scores suggest that the differences between the lives and future outlooks of poor and rich Americans are significantly larger than those between poor and rich Latin Americans (Table 1, Figures 2(a)–(d)).
Average life satisfaction, smiling, stress, and hard work beliefs, USA versus LAC (2006–2013).
Note: Calculations by Chattopadhyay and Graham, based on the Gallup World Poll, 2006–2013. Data from the Gallup World Poll survey, averaged over the period. Data for individual years is available from the author on request.
Gaps in Well-Being Scores between the Poor and the Rich: USA versus LAC. Source: Calculations by Chattopadhyay and Graham, based on the GWP, 2006–2013.
The one exception is evaluative well-being, as measured by the BPL question, where levels are higher for the United States than for the Latin American countries. This is what we would expect, as the BPL question – which introduces a relative component – is most closely correlated with income across both individuals and countries than any of the other evaluative questions (such as life satisfaction and happiness in general). The difference between the average scores of the poorest and richest quintiles in the United States is also marginally smaller than that for LAC, at least in most years, and averaged out over the period (Table 1, Figure 2(a)).
In contrast, on all of the other questions – smiling, stress, and hard work get you ahead – the difference between the scores of the poor and the rich is significantly smaller in LAC than it is in the United States (Table 1, Figures 2(b)–(d)). Both of the hedonic metrics – stress and smiling – exhibit a much larger gap between poor and rich Americans than between poor and rich Latin Americas. The working hard variable, meanwhile, tells an even more compelling story. Not only is the gap smaller between Latin American poor and rich quintiles, but in many years the poor actually score higher than the rich. At least in recent years in Latin America, the poor have faith that working hard can get you ahead. Scores on this variable in the United States, meanwhile, are on average high compared to most countries, and slightly higher than those in Latin America. But gap between the scores of the rich and the poor in the United States is much larger than it is in Latin America (Table 1, Figure 2(d)).
These are simply averages, and thus may wash out important nuances. Yet the general picture is one of significant differences in well-being and outlooks for the future between the “two Americas.” The poor are more likely to experience stress in their daily lives and less likely to believe that hard work can get them ahead. And, remarkably, the gap in the scores and attitudes of poor and rich Americans is larger than it is in Latin America, a region long known for its high levels of inequality. Indeed, the Gini coefficient for Latin America on average is 0.50 (down from 0.54 in 2000), while for the United States it is 0.47 (up from 0.40 in 1979) (Krueger, Reference Krueger2012; WDI, 2013).
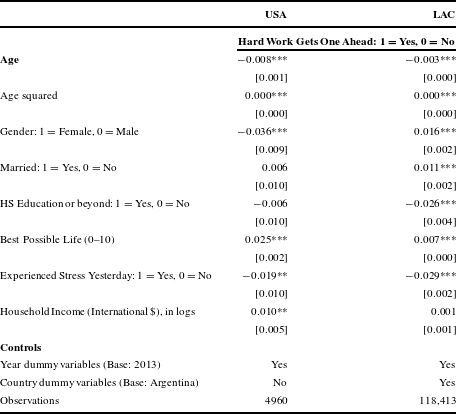
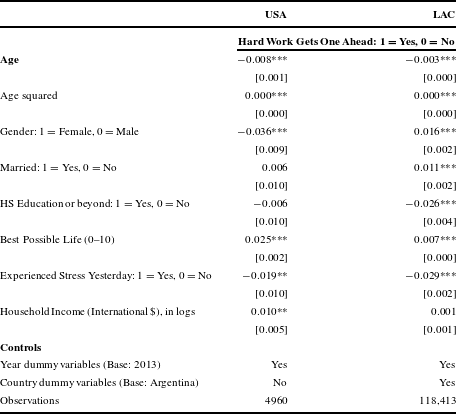
We then looked more closely at of the determinants of mobility attitudes. We ran separate regressions for each sample (USA, LAC), with mobility attitudes (e.g., belief in hard work) as the dependent variable, and the usual socio-demographic variables, income, year dummies, country dummies (for the LAC sample), and our BPL question as the independent variable. As the question is binary (yes/no) we used a probit specification.
(a) Y (hard work)it
 $=$ b1 (income) $+$ b2 (vector of socio-dem traits) $+$ b3 (bpl) $+$ b4 (stress) $+$ b5 (year dummies) $+$ b6 (country dummies for LAC specification) $+$ epsilon


Regression of belief in hard work attitudes – USA versus LAC.
Standard errors in brackets *** $p<0.01$, **
 $p<0.05$, *
 $p<0.1$. Notes: Data are from the GWP for 2005–2013.
Our econometric results essentially confirm the patterns in the averages. Most importantly, log income (measured in international dollars, where respondents place themselves in brackets based on their domestic currency and then converted into international dollar values) is positively correlated with beliefs in hard work in the United States but not in Latin America. Education plays no role in the United States but is (surprisingly) negatively correlated with hard work beliefs in Latin America (this may have to do with ongoing changes in rewards to different levels of education in the latter). Women are less likely to believe that hard work gets you ahead in the Unites States, but more likely to do so in Latin America. And innate character traits and attitudes play a strong and expected role in mobility attitudes in both contexts. Respondents with higher levels of evaluative well-being are more likely to believe in hard work, while those with higher levels of stress are less likely to;Footnote 7 see Table 2.
Another issue is whether stress varies as a “good” or “bad” influence depending on where in the income distribution respondents are. Stress which is related to daily struggles and an inability to plan ahead, as is typical for the poor (as in the case of unpredictable working hours and many other examples cited above), is both bad for well-being and a constraint on investing in the future. In contrast, stress that is related to hard work aimed at future benefit, such as going to graduate school, could have quite different and even positive effects.
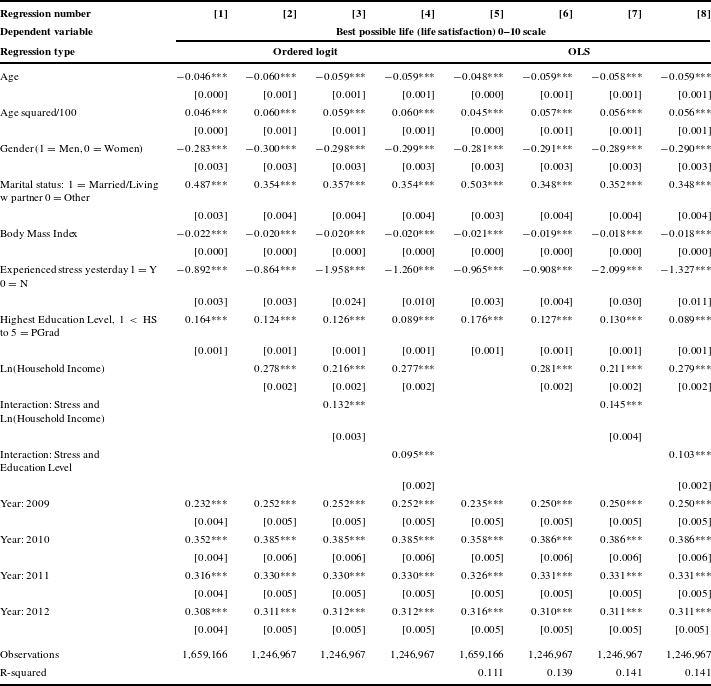
In order to test this good and bad stress influence explicitly, we ran a separate regression (ordered logit and then OLS), with life satisfaction (BPL) as the dependent variable, and the usual socio-demographic and economic controls as well as reported stress and stress interacted with income on the right hand side, based on the U.S. Gallup Healthways data.
(b) Y (life sat)it
$=$ xb1 (socio-dem vector) $+$ xb2 (log income) $+$ Xb3 (health status) $+$ xb4 (reported stress) $+$ xb5 (stress $^{\ast }$ income) $+$ epsilon


As in the above regressions, life satisfaction is measured by the BPL question in the Gallup Poll. Income in the Gallup Healthways is reported in ten brackets, with much smaller amounts of income in the bottom brackets (beginning with less than $30 per month) and the top bracket being above $10,000 per month. We took the log of the midpoint value in each bracket as the observation for each individual who reports to be in that respective bracket. We included the usual socio-demographic controls (age, age squared, gender, marital status, and education level) and then included body mass index as a proxy for health status, as it was the one objective health indicator that was reported in all years. We also included year dummies.
Good Stress, Bad Stress?
Standard errors in brackets *** $p<0.01$, **
 $p<0.05$, *
 $p<0.1$. Notes: Using Gallup Healthways Surveys 2008–2012. Household Income is in the group midpoint value, in natural logs.
Our results provide support for the idea that stress has a different relation with well-being depending on individuals’ means and capabilities (see Table 3). Not surprisingly, the coefficient on stress demonstrates a significant and negative correlation with life satisfaction – with a value that is significantly greater (in negative terms) than the main correlates of life satisfaction, such as marital status and income. Our interaction term, however, is significant and positive, suggesting that at a certain level of income, the negative effects of stress are mitigated. Stress even becomes positive for life satisfaction at the very highest part of the distribution.Footnote 8 Stress is also negatively correlated with positive hedonic well-being (smiling yesterday), which is not a surprise, but income does not have a similarly strong negative effect in the relationship.Footnote 9
Implications for benefit-cost analysis
What do these findings imply for BCA? A critical point is that individuals who are compromised in their ability to either believe in or plan for their future will make very different valuations of future benefits than will those who have more means and capabilities. These valuations could apply across a wide spectrum, from health care and insurance to investments in education to retirement savings. As such, any data based on time trade-offs and other hypothetical questions will lead to large gaps in contingency valuations which, taken at face value, would lead to regressive outcomes. The results also suggest that the poorest and most compromised individuals may also have difficulty making calculations that entail trading off present for future values.
In addition, individuals with very high discount rates are also more likely to engage in risky behaviors, such as not wearing seat belts or motorcycle helmets, or the consumption of a range of substances leading to perverse health outcomes. Individuals who discount the future are unlikely to be responsive to information intended to mitigate risk or to nudges designed to guide behavior away from risky choices. For example, these differential responses result in particular preventive policies having much less than the intended benefit values.
Subjective well-being metrics can help circumvent the problem by comparing the reported well-being of individuals who are actually in different arrangements, such as those who have taken up health insurance or not, or who have participated in programs such as moving to opportunity or not, in contrast to data based on hypothetical choices. The metrics can also be used to calculate the well-being costs or benefits of particular behaviors, such as smoking, exercising, or volunteering, and over very large samples of individuals. The metrics can also be used to calculate the well-being loss of serious injury or of losing a spouse or family member, something that is surely relevant to a range of legal deliberations pertaining to the appropriate level of compensation.
These costs and benefits can be assessed along experienced and evaluative dimensions, depending on which is more relevant to the context. Experienced metrics are more suited to assessing the day-to-day effects of things such as different care-giving arrangements or end of life care, while evaluative metrics are more suited to assessing interventions which are designed to enhance opportunity and long-term outcomes. Meanwhile, our results suggest that stress, while a hedonic metric, also reflects individuals’ capacity to plan for the future, depending on whether or not it is associated with circumstances beyond their control or with goal achievement.
The moving to opportunity program provides an example. While evaluations of the results are mixed, there was a clear positive effect on the subjective well-being of those who participated and moved (Ludwig et al., Reference Ludwig, Duncan, Gennetian, Katz, Kessler and Kling2012). Another example is our recent research on late life work. We compared the reported well-being of those individuals who stayed in the labor force (either full or part-time) after retirement age versus those who retired, and found a positive effect for those who remain active, controlling for self-selection by education and skills, among other things (Graham & Nikolova, Reference Graham and Nikolova2015). Other recent work on the well-being effects of receiving transfer payments (either from the government or from private sources) as opposed to earned income finds that they are largely negative, suggesting a large stigma effect (Swenson, Reference Swenson2015). Other studies highlight how standard metrics fail to value activities that are subtractive in income but additive in well-being, such as volunteering, charitable giving, and other altruistic behaviors (Moynihan, DeLeire & Enami, Reference Moynihan, DeLeire and Enami2015).
There are many other examples of how subjective well-being metrics can assess the welfare costs or benefits of different income, health, or other arrangements or interventions, as well as the costs and benefits of particular behaviors, such as smoking or television watching. As such, they provide a complementary tool to inform BCA. The metrics cannot, of course, resolve the problems of irrational decision making, short-time horizons, or the stress and other markers of ill-being associated with poverty. Yet they provide important information by assessing the costs and benefits of choices and behaviors resulting from those conditions. These assessments often contradict the information that is in the revealed preferences of respondents, precisely because they are making choices or behaving irrationally due to compromised conditions and constrained time horizons. For example, well-being research persistently finds that smokers are consistently less happy than nonsmokers (even though they reveal a preference by purchasing cigarettes) and that individuals who watch excessive hours of television are less happy than the average (even though they are choosing to do so), providing a case in point.
Valuations based on subjective well-being metrics should be considered complementary to standard tools such as WTP and VSL. Neither approach is perfect. Replacing an approach which assumes a rational and fairly uniform basis for calculating preference for risk, life years, and aggregate societal outcomes, among other things, with one that demonstrates remarkable heterogeneity in all of these parameters would introduce an unmanageable level of complexity into CBA.
At the same time, the information that well-being metrics provide could be incorporated into CBA. Metrics demonstrating different preference parameters for particular age, income, and other cohorts and their associated well-being costs and benefits, for example, could serve as useful complements to the information that is in standard valuations. Understanding why some disadvantaged cohorts undervalue the future and/or underestimate risk, such as the very high discount rates discussed above, would likely result in a very different calculation of an equitable valuation than would standard WTP. Indeed, this information might be useful in resolving the tension between positive (based on revealed individual preferences) and normative (which incorporate broader social objectives such as equity, equality of opportunity, and fair process) justifications for BCA.Footnote 10
Meanwhile, the consistent patterns that are detectable in the relationship between subjective well-being and a range of policy arrangements across large samples, as in the case of preference for work/income versus leisure, or specific public goods versus levels of taxation (which, in turn often vary across cohorts, societies, and countries) might be particularly useful in making the more complex assumptions necessary for calculations of individuals’ aggregate willingness to accept changes in social policies. Similarly, information on the differential well-being effects of different care-giving or other arrangements related to health care could help in assessing the broader social value of supporting one health care policy intervention over another.
No one approach provides a magic bullet to the challenge of accurately assessing human welfare and well-being and its relation to heterogeneity in individual preferences. A range of approaches is necessary to deepen our understanding of the challenge and its potential solutions. Subjective well-being metrics are a promising tool and one which has the potential to directly inform the valuations that underpin BCA.