INTRODUCTION
Many large terrestrial mammals are at risk of extinction, and a growing number have been eliminated from significant portions of their historic ranges (Ceballoa et al. Reference Ceballoa, Ehrlich, Soberon, Salazar and Fay2005). Large carnivores have been particularly impacted (Ripple et al. Reference Ripple, Estes, Beschta, Wilmers, Ritchie, Hebblewhite, Berger, Elmhagen, Letnic, Nelson, Schmitz, Smith, Wallach and Wirsing2014), and tigers (Panthera tigris) are among the world's most at-risk large carnivores (Tilson & Nyhus Reference Tilson and Nyhus2010).
One conservation measure is to re-establish species within their historical ranges (Fischer & Lindenmayer Reference Fischer and Lindenmayer2000; IUCN/SSC 2013). Large carnivores are frequent targets of reintroduction efforts because of expanding knowledge about their biological requirements, ecological functions and public appeal (Seddon et al. Reference Seddon, Soorae and Launay2005; Jule et al. Reference Jule, Leaver and Lea2008). However, large carnivore reintroductions can be particularly lengthy, expensive, complex and more challenging than herbivore or omnivore reintroductions because of their specialized trophic level, low density, demand for large home ranges, elusive nature and complex relationships with humans (Griffith et al. Reference Griffith, Scott, Carpenter and Reed1989; Breitenmoser et al. Reference Breitenmoser, Breitenmoser-Würsten, Carbyn, Funk, Gittleman, Funk, Macdonald and Wayne2001; Hayward & Somers Reference Hayward, Somers, Hayward and Somers2009; IUCN/SSC 2013).
The outcome of large carnivore reintroductions is influenced by a complex network of factors, including biological and technical, organizational and socioeconomic factors, in which uncertainty prevails (Reading et al. Reference Reading, Clark and Griffith1997; Fischer & Lindenmayer Reference Fischer and Lindenmayer2000; Breitenmoser et al. Reference Breitenmoser, Breitenmoser-Würsten, Carbyn, Funk, Gittleman, Funk, Macdonald and Wayne2001; Hayward & Somers Reference Hayward, Somers, Hayward and Somers2009; IUCN/SSC 2013).
The South China tiger (P. t. amoyensis) is the most critically endangered tiger subspecies (Nyhus Reference Nyhus2008). Native to the provinces of Fujian, Guangdong, Hunan, Zhejiang and Jiangxi in South Central China, South China tiger populations suffered dramatic declines in the twentieth century (State Forestry Administration of China 1998; Tilson et al. Reference Tilson, Defu, Muntifering and Nyhus2004). South China tigers are now considered extinct in the wild, constituting the first documented case of a tiger subspecies disappearing from the wild since the Java tiger in the 1970s (Tilson et al. Reference Tilson, Defu, Muntifering and Nyhus2004).
In 2010, representatives of tiger range countries signed the Saint Petersburg Declaration, a commitment to double the world's wild tiger population by 2022 (Wikramanayake et al. Reference Wikramanayake, Dinerstein, Seidensticker, Lumpkin, Pandav, Shrestha, Mishra, Ballou, Johnsingh, Chestin, Sunarto, Thinley, Thapa, Jiang, Elagupillay, Kafley, Pradhan, Jigme, Teak, Cutter, Aziz and Than2011). As part of this commitment, the government of China and international conservation organizations are working to identify one or more existing protected area(s) within the tiger's historical range large enough to reintroduce the subspecies (Breitenmoser et al. Reference Breitenmoser, Tilson and Nyhus2006; Nowell Reference Nowell, Tilson and Nyhus2010; State Forestry Administration of China 2010). Potential target reintroduction sites have been identified (Qin et al. Reference Qin, Nyhus, Larson, Carroll, Muntifering, Dahmer, Jun and Tilson2015) and captive South China tigers that have been released into semi-wild conditions in Africa have learned how to hunt (Fàbregas et al. Reference Fàbregas, Fosgate and Koehler2015). Serious questions remain regarding the potential for such a reintroduction programme to succeed, including whether such a programme is feasible, and clarity is needed regarding the major biological, social and political concerns that might be necessary to address in order to facilitate a successful tiger reintroduction.
The aim of this study was to query international conservation and reintroduction professionals about their attitudes and concerns regarding a possible tiger reintroduction effort in South Central China, with particular attention paid to the feasibility and potential success of such a programme. We asked whether respondents would support a tiger reintroduction, identified possible roadblocks to success, identified plausible minimum release sites and assessed important organizational, political and societal factors. Our hope is that these results will provide guidance regarding a possible tiger reintroduction effort. To our knowledge, this is the first global survey related to a potential large carnivore reintroduction in Asia.
METHODS
Survey design
We designed a survey instrument with 10 questions, including several multi-part questions. The content and structure of the questionnaire were derived from a literature review of large carnivore reintroductions in order to identify factors generally recognized as influencing the outcomes of these efforts. The survey covered seven major topics: basic professional profile; attitude towards a potential South China tiger reintroduction; habitat size; organizational and political factors; socioeconomic factors; challenges and opportunities in China; and large carnivore reintroduction experience. The survey included both multiple-choice questions and open-ended questions. For multiple-choice questions on attitude, opinion and perception (Q4, Q6 and Q7), a five-point Likert format of response options along with a ‘no opinion’ choice was used. The survey encouraged respondents to explain their answers to the multiple-choice questions.
Respondents were asked to self-describe their affiliation, nature of work, major work location(s) and involvement in conservation in China (Q1–Q3). They were queried on their support for a possible South China tiger reintroduction (Q4) and a plausible minimum release area recognizing the constraints and uncertainties regarding land availability in China (Q5). The choice for release area size was categorized into nine 250-km2 intervals ranging from 0 to >2000 km2 with an option to indicate other values.
Respondents were asked to state their opinions on the favourability of China's organizational and political factors towards a South China tiger reintroduction (Q6) by responding to a series of positive statements on conservation framework, technical and organizational capacity, collaboration and communication in wildlife conservation, international support and potential impact of a South China tiger reintroduction. Respondents were also asked to evaluate the favourability of current societal factors in China towards a potential reintroduction, including public attitude, political will and political climate, cultural significance of the tigers and economic status and its population growth trend (Q7).
A final series of qualitative questions enabled respondents to comment on what they perceived to be the major biological, societal and organizational factors needed for effective reintroductions. These included respondent opinions on the greatest potential challenges and opportunities to reintroducing South China tigers (Q8a and b), experiences with large carnivore reintroductions and perceptions of the most important factors affecting outcomes (Q9a–c). Respondents were also asked if they had any additional comments (Q10).
Survey implementation
Invitations were sent in February–March 2012 to 287 conservation professionals representing three broad areas of self-identified professional expertise: felids, mammal reintroduction and conservation experience in Asia. Surveys were sent to members of the International Union for Conservation of Nature (IUCN) Cat Specialist Group (CSG), the IUCN Re-introduction Specialist Group (RSG) and corresponding authors of top-cited publications from the global database Web of Knowledge (WoK; Thomson Reuters Reference Reuters2012). CSG and RSG are part of the IUCN Species Survival Commission (SSC) and bring together leading scientists, wildlife managers and conservationists in order to advance the understanding and conservation of species.
CSG participants were identified from the 2009–2012 public member database. Invitations were sent to members who had expertise in Asia and at least one large cat species. Members whose primary expertise was evolution were not included. Biographies and the contact information of the members are available from the CSG public website (CSG 2009). RSG participants were selected from members who indicated that their specialty was in mammal and/or carnivore reintroduction. RSG members who worked exclusively in primate or ungulate reintroductions were excluded. A database of member information is available from the RSG public website (RSG 2007). We also conducted a literature search in WoK using keywords ‘reintroduction’ or ‘re-introduction’ and ‘carnivore’. We obtained 72 email addresses of corresponding authors of publications cited at least once from 1990 to 2012. Studies on aquatic ecosystems and non-carnivore programmes were excluded.
The survey instrument was developed and administered using Qualtrics (www.qualtrics.com). A cover letter containing a link to the survey and a downloadable Microsoft Word version of the survey were sent by email to each respondent. Respondents were instructed to fill out the survey online or to email their completed surveys. Reminder emails were sent after 2 weeks. Qualtrics indicated that all 287 invitations were sent successfully.
Data analysis
Independent variables coded as ‘check all that apply’ items were coded using binary variables (Box 1). Each option was treated as a separate dichotomous variable using 1 if the item was applicable and 0 if inapplicable. Variables were combined for statistical analysis when the sample size was smaller than 5.
List of independent variables used in the research survey, requiring either a ‘yes’ or ‘no’ response.

Responses to multiple-choice questions on attitude, opinion and perception (Q4, Q6 and Q7) used a Likert format on a 1–5 scale, where the most negative response was 1 and the most positive was 5 (e.g. for Q6, ‘strongly disagree’ = 1 and ‘strongly agree’ = 5). Responses to Q5 on habitat size were ranked on a 1–10 scale, where the smallest class (0–250 km2) received a score of 1, the largest class (>2000 km2) received a score of 9 and ‘other’ received a score of 10. These questions were in a forced-response format and ‘no opinion’ options were offered. ‘No opinion’ responses were treated as no data. Dependent variables are described in Table 1.
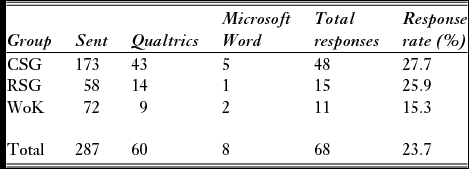
Summary of survey response statistics, including total sent, format of response, total responses and response rate. Some participants were members of multiple groups (CSG/RSG – three sent/two received; CSG/WoK – eight sent/three received; RSG/WoK – three sent, one received; CSG/RSG/WoK – one sent, none received). CSG = member of Cat Specialist Group; RSG = member of Reintroduction Specialist Group; WoK = corresponding authors of top-cited publications from Thomson Reuters Web of Knowledge.

Stata 12 (StataCorp 2011) was used to generate non-parametric statistics. We present response summaries using medians and interquartile ranges as measures of statistical dispersion of the data. For items with subgroups, we calculated medians based on the subgroup of each participant. Wilcoxon rank-sum (Mann–Whitney U) tests were used to test for significance among independent variables in order to assess whether affiliation, nature of work, work location and experience affected survey participants’ answers. Open-ended questions (Q8–Q10) and comments allowed respondents to complement and explain their responses.
RESULTS
We received 68 (23.7%) responses from 287 conservation professionals. Response rates from our target populations ranged from 15.3% to 27.7% (Table 1). The majority of responses came from members of CSG, and the fewest were from authors identified from WoK; some respondents were members of multiple groups (Table 1).
Respondent characteristics
Almost all (n = 65; 95.6%) respondents self-identified with work experience in the field of natural sciences, seven (10.3%) had work experience in social sciences and humanities and four (5.9%) had work experience in administration. Respondents were commonly affiliated with university/research institutions (n = 35; 51.5%), non-governmental/non-profit organizations (n = 21; 30.9%) and government agencies (n = 16; 23.5%). In addition, eight (11.8%) self-identified as conservation managers and two (2.9%) as freelancers. The respondents’ major work locations included Africa (n = 19; 27.9%), Central and South America (n = 16; 23.5%), North America and the Caribbean (n = 16; 23.5%), East and South Asia (n = 24; 35.3%), West Asia (n = 9; 13.2%), East Europe, North and Central Asia (n = 12; 17.6%), West Europe (n = 19; 27.9%) and Oceania (n = 3; 4.4%). Among the respondents, 12 (17.6%) indicated that they had some form of involvement in conservation work in China. Over half of all respondents had direct work experience with large carnivore reintroduction (n = 36; 62.1%), and some had indirect involvement (n = 11; 19.0%). Carnivore species with which respondents self-identified as having reintroduction experience included: Eurasian lynx (Lynx lynx), wolf (Canis lupus), brown bear (Ursus arctos), Iberian lynx (Lynx pardinus), swift fox (Vulpes velox), Florida panther (Puma concolor), lion (Panthera leo), African wild dog (Lycaon pictus), cheetah (Acinonyx jubatus) and jaguar (Panthera onca).
Attitudes, opinions and perceptions
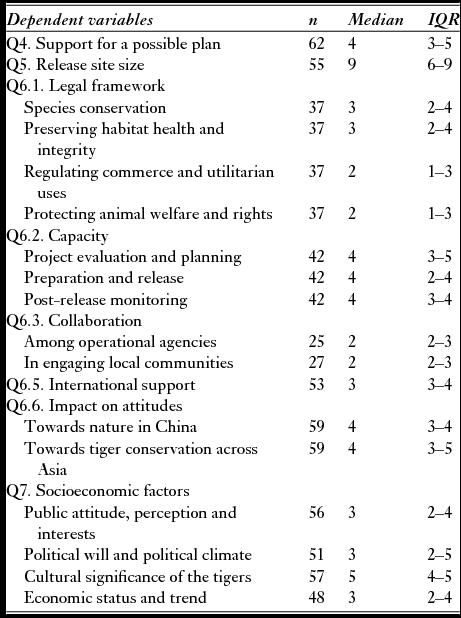
Summary statistics of the dependent variables (Q4–Q7) are listed in Table 2. For Q4, Q6 and Q7, a higher median value indicates a more positive response than a lower median value. For Q5, the value indicates the median release site size range.
Summary statistics of dependent variables. For Q4, Q6 and Q7, responses were based on a five-point Likert format, where the most negative received a score of 1 and the most positive received a score of 5. Responses to Q5 were ranked on a 1–10 scale, where the smallest class (0–250 km2) received a score of 1, the largest class (>2000 km2) received a score of 9 and all responses that indicated a value significantly greater than 2000 km2 in ‘other’ received a score of 10. IQR = interquartile range (25th–75th percentile).

Forty-four respondents were supportive or strongly supportive of a potential South China tiger reintroduction project (71.0%), but 23 (37.1%) held that this was contingent on how the project would be planned and implemented, especially in relation to human–wildlife conflict, poaching, source animals, habitat and prey. Many respondents stressed the importance of the IUCN Reintroduction Guidelines and the need to eliminate the original causes of species decline. Among the 22 strongly supportive (category 5) responses, there was unanimous agreement on the significance of reintroduction as a necessary proactive conservation measure to recover the species and restore natural habitats. Fourteen respondents (22.6%) were neutral, typically commenting that more information on the reintroduction plan was needed because of the complex, difficult nature of large carnivore reintroduction programmes and concerns with China's poor track record regarding wildlife utilization. All opposing responses (n = 4; 6.5%) were from members of CSG who had been involved in conservation in East and South Asia and had work experience with large carnivores and/or reintroduction. Opposition mainly stemmed from concerns over finding a suitable release site, poaching and the genetic viability of the founding stock.
Thirty-five respondents (61.9%) indicated that a plausible minimum release site should be greater than 2000 km2, and seven suggested a minimum release site should be significantly greater than 2000 km2. No respondent considered 0–250 km2 to be a plausible site for reintroduction. Responses on a plausible release site were mainly based on considerations of prey density, tiger home range, carrying capacity, geography and genetic variability, of which, however, different standards were used. For example, estimations of numbers of tigers per 100 km2 ranged from one to four. Several respondents addressed the uncertainty of land availability in China, while others suggested meta-population management and the creation of corridors among release sites.
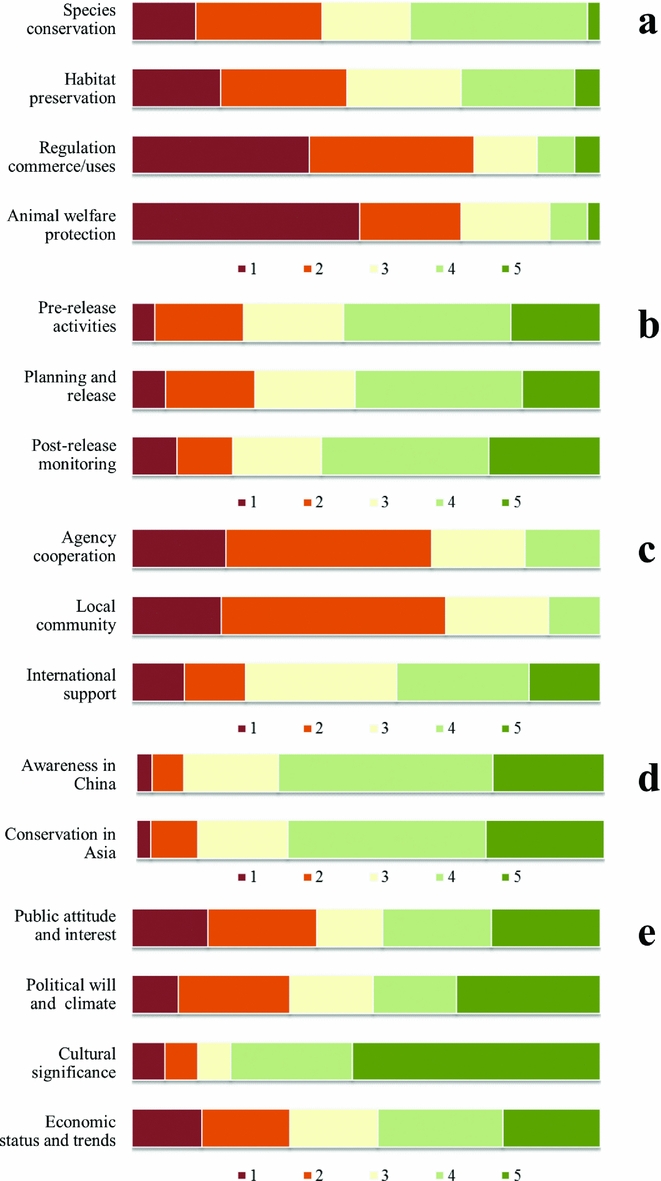
The statements on organizational, political and societal factors (Q6 and Q7) that required knowledge about China had fewer respondents. The effectiveness of the legal framework, regulation of commerce and utilitarian uses and protection of animal welfare and rights (Q6) were evaluated on average less favourably than species conservation and habitat protection (Fig. 1). Responses with low medians across the four categories (response = 1, 2) were mainly based on China's performance in terms of regulating the trading of tiger parts and protecting animal rights, and thus overall perceptions that biodiversity conservation was low on the national agenda. While some respondents acknowledged China's effort to create laws in this area, they also pointed out weak historic implementation of these laws.
Percentage of responses to positive statements on: (a) legal framework on wildlife conservation in China; (b) China's technical and organizational capacity to carry out a South China tiger reintroduction; (c) collaboration and communication domestically in China and internationally; (d) future impact of a possible South China tiger reintroduction; and (e) the societal and political environment to carry out a South China tiger reintroduction (responses: ‘strongly disagree’ = 1, ‘disagree’ = 2, ‘neither agree nor disagree’ = 3, ‘agree’ = 4 and ‘strongly agree’ = 5).

Respondents generally believed that China has the capacity to carry out a reintroduction (Q6.2) (Fig. 1(b)). Positive responses were mainly based on the respondents’ direct and indirect interactions with Chinese scientists and reviews of other conservation efforts, especially with the giant panda (Ailuropoda melanoleuca) (Liu et al. Reference Liu, Linderman, Ouyang, An, Yang and Zhang2001). Conversely, responses with low medians across the subgroups were due to the suspicion that such capacity is not available based on China's lack of experience and perceived unsatisfactory outcomes of the giant panda project. Overall, a majority of the respondents recognized China's potential to gain experience in this area and the value of collaboration with international experts.
Participants expressed the most concern regarding the highly centralized Chinese government's perceived lack of interest in working with local people and achieving effective collaboration with them (Q6.3) (n = 27) (Fig. 1(c)). Positive responses acknowledged the recent improvement in agency collaboration. Q6.4 on international support received mixed responses (Fig. 1(c)). Negative responses (response = 1, 2; n = 14) were mainly based on issues with wildlife trade and tiger farms and the lack of information and transparency regarding project progress. Of the 53 responses, 23 (43.4%) were positive (response = 4, 5) and 17 (32%) were negative (response = 3).
Respondents generally felt that tiger reintroduction would have a positive impact (Q6.5) (Fig. 1(d)). Respondents who favoured reintroduction argued for the high visibility of large carnivore reintroduction programmes in general and the increasing international influence of China. Those who opposed reintroduction expressed concern that a reintroduction project would distract attention and be used as a cover-up for existing problems in tiger conservation, such as poaching and the existence of tiger farms. A majority of respondents noted that a reintroduction would have a positive impact if done well, but would have a negative impact if done poorly.
The cultural significance of tigers received unanimously positive responses, despite the concerns regarding traditional medicinal uses of tiger parts (Fig. 1(e)). Mixed views were expressed towards public attitude, political will and economic status and growth trends. A number of respondents pointed out the very likely negative perception of local communities towards large carnivore reintroductions unless such efforts were well received on a broad scale. China's growing prosperity was viewed on the one hand as promising for project funding, while on the other hand as fuelling growing demand for tiger parts and related products. Additionally, economic growth was perceived as being China's main priority, rather than tackling environment and conservation issues.
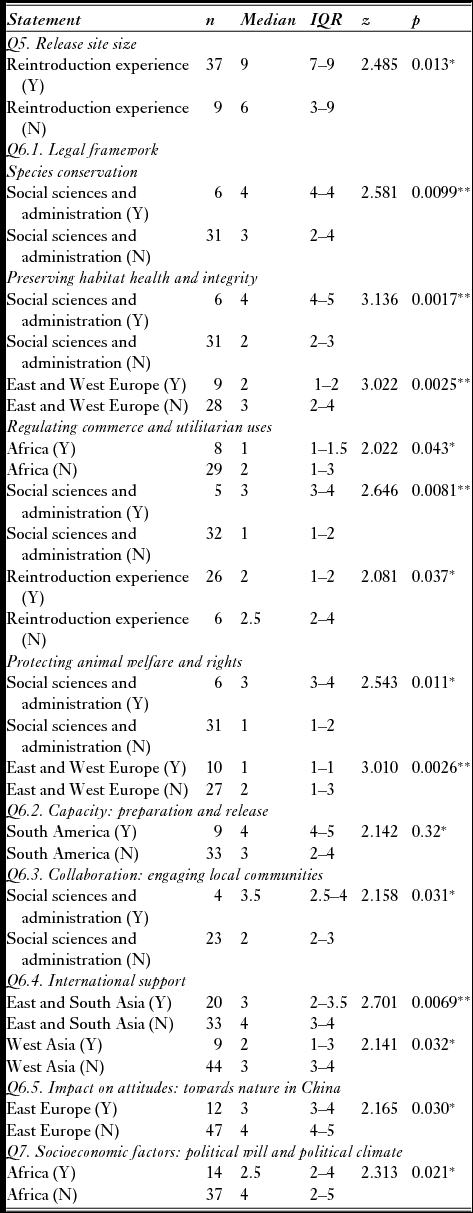
Nature of the work, work location and reintroduction experience all appeared to influence participants’ responses (Table 3). Respondents who self-identified as having worked in social sciences and administration responded significantly more favourably to all four aspects of the legal framework and collaboration and communication with local communities than others who had not worked in such fields. Participants who had work experience in Africa responded significantly less positively regarding China's legal system regulating commerce and utilitarian uses of wildlife, as well as the current political will and climate for a potential South China tiger reintroduction project. Respondents who had worked in East, South and West Asia felt that there was not sufficient international support for such a reintroduction project. People who had worked in East and West Europe responded less favourably to China's legal framework for preserving habitat health and integrity and protecting animal welfare and rights. Communication with local communities and the future impact on China's attitude towards nature were also viewed less positively by respondents who had worked in East Europe. Respondents who had worked in South America had more confidence in China's capacity to carry out a potential South China tiger reintroduction project. Respondents with direct or indirect experience in reintroduction also responded less positively on China's legal system being able to regulate commerce and utilitarian uses of wildlife and identified plausible release sites as being significantly larger than participants who had no such experience. Additionally, participants who had worked in Africa (z = 1.905, p = 0.057) and East and South Asia (z = 1.916, p = 0.055) tended to predict a less favourable future impact of a South China tiger reintroduction on tiger conservation across Asia.
Significant Wilcoxon rank-sum test results between participants who had a positive (Y) or negative (N) association within independent variable groups. *p < 0.05; **p < 0.01. IQR = interquartile range (25th–75th percentile).

DISCUSSION
The survey participants generally agreed that any South China tiger reintroduction would encounter a complex mix of challenges and considerations, but there was also recognition that a well-developed programme might be a necessary, proactive conservation measure in order to recover tigers and their habitat. The following factors emerged as particularly important considerations.
Biological and technical factors
Many respondents considered current lack of a sufficient prey base, limited and fragmented habitat and the captive and genetically impoverished founder stock to be the most fundamental challenges in a potential South China tiger reintroduction. Prey availability largely determines the density, abundance, movements and viability of large carnivores (Fuller & Sievert Reference Fuller, Sievert, Gittleman, Funk, Macdonald and Wayne2001) because there is a positive relationship between prey abundance and carnivore density, and the presence of specific prey species is also important (Karanth & Stith Reference Karanth, Stith, Seidensticker, Christie and Jackson1999). A reintroduction release site should be within the species’ historical range and the quality and size of the habitat is crucial in order to fulfil the species’ needs, such as feeding, breeding and social behaviour (IUCN/SSC 2013).
Currently, potential restoration sites in China are spatially separated by a matrix of sprawling rural settlements, extensive agriculture and degraded habitat (Qin et al. Reference Qin, Nyhus, Larson, Carroll, Muntifering, Dahmer, Jun and Tilson2015). Within the historical range of the South China tiger, the sizes of reserves established by the Chinese government range from c. 100 km2 to 700 km2; few contiguous reserve complexes approach 1000 km2 (Nowell Reference Nowell, Tilson and Nyhus2010). Prey abundance is low in historical tiger ranges as a result of illegal harvesting, habitat conversion and logging (Tilson et al. Reference Tilson, Defu, Muntifering and Nyhus2004; Dahmer et al. Reference Dahmer, Xiaojie and Shurong2014). Given the small reserve sizes and low prey density, without major habitat and prey restoration efforts, even the largest reserves currently have the potential to support only a few tigers.
The source of the founder stock directly affects reintroductions. Projects using captive-born animals may be less likely to succeed than those using wild-caught animals (Griffith et al. Reference Griffith, Scott, Carpenter and Reed1989; Jule et al. Reference Jule, Leaver and Lea2008). Animals in captivity often show a loss of natural behaviours like hunting, social interactions and breeding (Snyder et al. Reference Snyder, Derrickson, Beissinger, Wiley, Smith, Toone and Miller1996; Vickery & Mason Reference Vickery and Mason2003). Also, captive-born animals are more susceptible to viruses and diseases than their wild counterparts (Cunningham Reference Cunningham1996; Jule et al. Reference Jule, Leaver and Lea2008). Genetic variability is also essential for future evolution and long-term persistence; inbreeding depression negatively affects juvenile survivorship, reproduction rate and the health of the animals (Frankham Reference Frankham1995).
As of October 2011, there were 108 South China tigers representing c. five generations in captivity, and using gene drop pedigree analysis, these were estimated to represent 67.6% of the genetic diversity of the original wild population (Yin & Traylor-Holzer Reference Yin and Traylor-Holzer2011). This small captive population is based on six successfully reproducing tigers captured between 1958 and 1970 (Traylor-Holzer et al. Reference Traylor-Holzer, Zhong, Yuzhong, Tilson and Nyhus2010). The captive South China tiger population has suffered from unstable age and sex structures, low reproductive rates and increased inbreeding (Traylor-Holzer et al. Reference Traylor-Holzer, Zhong, Yuzhong, Tilson and Nyhus2010). Potential removal of any South China tiger individuals from the captive population for reintroduction should be carefully assessed and must not jeopardize the genetic needs of the captive population (IUCN/SSC 2013). Measures such as genetic supplementation from closely related taxa should be explored in order to improve the viability of the inbred captive South China tiger population (Breitenmoser et al. Reference Breitenmoser, Tilson and Nyhus2006).
Organizational factors
Among all organizational factors, China's legal framework on regulating commerce and utilitarian uses and protection of animal welfare and rights, as well as communication and collaboration, were perceived least favourably (Table 2). China's poor track record in regulating the trading of tiger parts (Nowell & Jackson Reference Nowell and Jackson1996) was a major concern. In 1993, China banned all trade of tiger bones in response to the Convention on International Trade in Endangered Species of Wild Flora and Fauna (CITES) directives and threats of international trade sanctions, but continued to condone the breeding of tigers in farms that supply markets for tiger products (Nowell Reference Nowell, Tilson and Nyhus2010). In 2006, China's attempt to reopen the trade in tiger parts and products from captive-bred animals was widely criticized by conservationists (Nowell Reference Nowell, Tilson and Nyhus2010).
Other legislation related to tiger conservation include the Law for Wildlife Conservation (1989), Criminal Law (1997), Forest Law, Law for Environmental Protection (1989), Custom Law (1987) and the 1984 Constitution. The Law for Wildlife Conservation grants special protection to rare and endangered species identified under Class I and Class II State Protection and those listed in Appendices I and II of CITES, which China ratified in 1981 (Sharma Reference Sharma2005). The tiger is currently listed under Class I State Protection and Appendix I of CITES. Wildlife authorities, forest police, China Customs anti-smuggling police and industrial and commercial authorities are responsible for enforcing these laws and regulations (Jahiel Reference Jahiel1998). While some respondents and scholars (Li Reference Li2007; Turvey Reference Turvey2008) acknowledged China's effort in creating such laws, all respondents called for improvements in legal enforcement.
Many respondents also voiced concerns about collaboration and communication among operational agencies and with local communities in China. Many international, high-profile conservation projects have been reported to have experienced extended decision-making processes, misunderstandings and lack of action, leading to failures of various degrees (Turvey Reference Turvey2008). Scientific and administrative inaction is particularly problematic in conservation as time is often limited. Conservation of the baiji (Lipotes vexillifer), a river dolphin species that is likely already extinct, was partly plagued by persistent time delays when the species was very rare (Turvey Reference Turvey2008). Some respondents also pointed out a lack of effective communication and collaboration in the giant panda project (Liu et al. Reference Liu, Linderman, Ouyang, An, Yang and Zhang2001).
Survey participants overall believed China has the capacity to carry out a South China tiger reintroduction (Table 2 and Fig. 1). Nevertheless, a majority of the respondents also recognized China's potential to learn from – and the value of collaboration with – international conservation organizations, including CSG and RSG. Many respondents pointed out that China will have the best chance of carrying out a successful tiger reintroduction if the effort is based on criteria developed by the international conservation community, rather than compromises from political pressure. Survey participants pointed out that international support would depend on whether China shows genuine interest and effort to address the issues of human–wildlife conflict, poaching, source animals, habitat and prey in planning and implementing a possible South China tiger reintroduction.
Societal factors
Among the societal factors, the cultural significance of the tiger received unanimously positive responses (Fig. 1(e)). The tiger has long been held in awe and admiration in China (Wang Reference Wang2007). Throughout history, the tiger has elicited profound cultural, historical and political interest in Chinese society, and reverence for the tiger infuses Chinese art, literature, folklore and medicine (Coggins Reference Coggins, Tilson and Nyhus2010). A crisis facing an animal that defines much of Chinese culture is likely to elicit passionate responses from the Chinese public. However, the traditional uses of tiger parts for medicine and decoration – a major force that drove wild tigers to extinction 20 years ago – is also likely to compete with conservation interests. Surveys in China on the wildlife and tiger trade, consumption and conservation awareness suggest that tiger and other wildlife consumption in Chinese urban areas is still considerable, despite the trade being illegal (Gratwicke et al. Reference Gratwicke, Mills, Dutton, Gabriel, Long, Seidensticker, Wright, Wang and Li2008).
Implications
In 2010, Prime Minister Wen Jiabao of China joined the leaders of the 13 tiger-range countries at the International Tiger Conservation Forum in Saint Petersburg (Russia) in committing to double the population of Asia's wild tigers (Wikramanayake et al. Reference Wikramanayake, Dinerstein, Seidensticker, Lumpkin, Pandav, Shrestha, Mishra, Ballou, Johnsingh, Chestin, Sunarto, Thinley, Thapa, Jiang, Elagupillay, Kafley, Pradhan, Jigme, Teak, Cutter, Aziz and Than2011).
As of 2016, the government of China is preparing to return some of the 22 South China tigers currently in South Africa. Twelve of these captive-born tigers were able to hunt free-range prey, suggesting the potential for similar behaviour if they can be reintroduced in China (Fàbregas et al. Reference Fàbregas, Fosgate and Koehler2015). The State Forestry Administration of China has identified provisional locations to place the returning tigers in Meihuashan (Fujian Province), Qingyuan (Guangdong Province) and Houhe National Nature Reserve (Hubei Province) (L. Jun, personal communication 2016). None of these sites are presently capable of sustaining a viable wild population of reintroduced tigers because the habitats are too small, they lack adequate prey (a topic not directly addressed in our survey) and they have high human population densities. The founding tiger population would still be genetically constrained, and successful hunting behaviour is not guaranteed. For this ambitious and unprecedented programme to succeed, and to ensure the reintroduction is not simply relegated to a highly managed safari park captive experience, significant work is still needed in order to identify sufficient habitats, to develop a programme to reintroduce and manage tiger prey populations, to reduce poaching of prey, to prepare a soft release programme, to coordinate across institutions and to address the needs and safety of local communities (IUCN/SSC 2013; Qin et al. Reference Qin, Nyhus, Larson, Carroll, Muntifering, Dahmer, Jun and Tilson2015).
Since the survey was undertaken, China has made strides that suggest that such a reintroduction could soon be feasible. China is proposing a new national park in Northeast China to protect Amur tigers (P. t. altaica) (McLaughlin Reference McLaughlin2016) and has announced new conservation commitments, such as a ban on all ivory trade and processing by the end of 2017. There is also precedent elsewhere in Asia: Tigers were translocated to Panna (2009) and Sariska Tiger Reserves (2008) in India after poachers killed off tigers in these reserves (Sankar et al. Reference Sankar, Qureshi, Nigam, Malik, Sinha, Mehrotra, Gopal, Bhattacharjee, Mondal and Gupta2010). However, these were translocated wild tigers, and the reserves had an existing infrastructure for tiger and habitat protection and monitoring, an abundant prey base, community support, park management leadership, political support and funding.
CONCLUSION
Global conservation and restoration professionals largely agree that a South China tiger reintroduction programme would benefit tigers and that China has the resources and capacity to succeed at such a project; however, the results of our survey identify important biological, technical, organizational and societal factors that would have to be overcome. Asia has experienced a period of significant decline in carnivore and large mammal populations and habitats. Asian range state commitments to tiger population recovery may signal a new era in large carnivore reintroduction and recovery, not unlike similar efforts in North America and Europe (Chapron et al. Reference Chapron, Kaczensky, Linnell, von Arx, Huber, Andrén, López-Bao, Adamec, Álvares, Anders, Balčiauskas, Balys, Bedő and Bego2014), but our findings suggest significant hurdles may remain before similar success is possible in cases such as the South China tiger, for which suitable land is limited, local human population densities are high and cultural and administrative constraints remain.
ACKNOWLEDGEMENTS
We appreciate the support of the Environmental Studies Program, Colby College. This paper benefited from helpful feedback from F. Russell Cole, Travis Reynolds, Manny Gimond and three anonymous reviewers. Lu Jun, National Wildlife Research and Development Center, State Forestry Administration of China, provided helpful updated information. We thank the survey respondents for their participation. This study was inspired by Dr Ronald Tilson, who passed away before this study was published.
ETHICAL STANDARDS
The authors assert that all procedures contributing to this work comply with the ethical standards of the relevant national and institutional committees on human experimentation and with the Helsinki Declaration of 1975, as revised in 2008.