Implications
Animal welfare is of great importance in animal production systems nowadays and it is usually evaluated using different indicators of stress. The use of salivary biomarkers as a non-invasive method to monitor animal welfare has been in increasing demand during the last decade, according to European guidelines on animal well-being. Currently, only a few biomarkers could be quantified in saliva samples. We have developed an assay to measure salivary chromogranin A, a new stress marker that improves animal stress monitoring at farms, using minimally stressful collection techniques.
Introduction
Chromogranin A (CgA) is a 49 kDa acidic soluble protein. It is the major protein found at the core of catecholamine's storage vesicles of the adrenal medulla and sympathetic nerves chromaffin cells, from which it is co-released with epinephrine and norepinephrine (Takiyyuddin et al., Reference Takiyyuddin, Cervenka, Sullivan, Pandian, Parmer, Barbosa and O'Connor1990). Although initially detected in chromaffin granules, this protein was later found to be distributed ubiquitously in secretory vesicles of endocrine, neuroendocrine and neuronal cells (Winkler and Fischer-Colbrie, Reference Winkler and Fischer-Colbrie1992; Hendy et al., Reference Hendy, Bevan, Mattei and Mouland1995).
Salivary CgA was shown to be produced and stored by the human submandibular gland (Saruta et al., Reference Saruta, Tsukinoki, Sasaguri, Ishii, Yasuda, Osamura, Watanabe and Sato2005), and has also been described in the salivary gland of animals such as rats and horses (Sato et al., Reference Sato, Kanno, Nagasawa, Yanaihara, Ishida, Hasegawa and Iwanaga2002). Its liberation from the salivary gland is mediated by the secretion of catecholamines (Kanno et al., Reference Kanno, Asada, Yanase, Iwanaga, Ozaki, Nishikawa, Iguchi, Mochizuki, Hoshino and Yanaihara1999), and it has been postulated that the measurement of salivary CgA could be used as a sensitive and reliable quantitative tool for monitoring the activity of the sympathetic nervous system, which constitutes the initial alarm in stress response (Kanno et al., Reference Kanno, Asada, Yanase, Iwanaga, Nishikawa, Hoshino and Yanaihara1998; Nakane et al., Reference Nakane, Asami, Yamada, Harada, Matsui, Kanno and Yanaihara1998). Although the physiological role of CgA is still under investigation, the accumulated evidence provides convincing support for a role of CgA in counteracting sympathetic activity (Gallina et al., Reference Gallina, Di Mauro, D′Amico, D′Angelo, Sablone, Di Fonso, Bascelli, Izzicupo and Di Baldassarre2011). In veterinary medicine, the measurement of canine plasma CgA concentrations has also been proposed as a useful index for evaluation of an acute stress response (Akiyoshi et al., Reference Akiyoshi, Aoki, Shimada, Noda, Kumagai, Saleh, Sugii and Ohashi2005a). In addition, salivary CgA has been indicated as a possible marker of stress response in cows (Ninomiya and Sato, Reference Ninomiya and Sato2011), although its physiological role in saliva and in the stress response is still debated.
In human medicine, there are numerous articles based on the increase of salivary CgA in response to different stressors, such as noise (Miyakawa et al., Reference Miyakawa, Matsui, Kishikawa, Murayama, Uchiyama, Itoh and Yoshida2006), social or emotional stress (Toda et al., Reference Toda, Den, Nagasawa, Kitamura and Morimoto2007), psychosomatic stress (Lee et al., Reference Lee, Shimizu, Iijima, Obinata, Yamashiro and Nagasawa2006) or even in psychological stressful situations (Rai and Kaur, Reference Rai and Kaur2011). In contrast, in veterinary medicine, there is only one study on salivary CgA, which was evaluated as a marker of social isolation stress in cows (Ninomiya and Sato, Reference Ninomiya and Sato2011).
The development and implementation of saliva diagnostics in veterinary medicine has been strongly supported by the literature (Prickett and Zimmerman, Reference Prickett and Zimmerman2010). Saliva sampling has the advantages of being non-invasive and it is stress-free in comparison with blood sampling. Furthermore, repeated sampling over short-time intervals can be carried out by individuals following modest levels of training, which facilitates ongoing animal monitoring. Therefore, saliva is considered to be an ideal material for evaluating the stress condition in pigs, by using salivary stress markers, such as cortisol (Van Der Staay et al., Reference Van Der Staay, De Groot, Van Reenen, Hoving-Bolink, Schuurman and Schmidt2007), alpha-amylase (Fuentes et al., Reference Fuentes, Tecles, Gutiérrez, Martínez-Subiela and Cerón2011) or immunoglobulin A (IgA) (Muneta et al., Reference Muneta, Yoshikawa, Minagawa, Shibahara, Maeda and Omata2010). A significant advantage with respect to other salivary markers of stress, such as cortisol (Ruis et al., Reference Ruis, Te Brake, Engel, Ekkel, Buist, Blokhuis and Koolhaas1997) alpha-amylase (Harmon et al., Reference Harmon, Towe-Goodman, Fortunato and Granger2008) and IgA (Muneta et al., Reference Muneta, Yoshikawa, Minagawa, Shibahara, Maeda and Omata2010), is that it is not influenced by circadian variation. This fact has been demonstrated in dogs (Kanai et al., Reference Kanai, Hino, Hori, Nakao, Hoshi, Itoh and Higuchi2008). It has also been shown that in humans salivary CgA is probably not affected by food intake (Toda et al., Reference Toda, Morimoto, Nagasawa and Kitamura2004).
The purpose of the present study was twofold: first, to develop and validate a novel time-resolved immunofluorometric assay (TR-IFMA), by using species-specific polyclonal antibodies, for the determination of CgA in the saliva samples of pigs, and second, to evaluate the behaviour of CgA levels in the saliva after applying an experimental acute stressor in growing pigs.
Material and methods
Animal and sampling procedures
At the beginning of the fattening period, male (Duroc ×(Landrace × Large White)) pigs from the experimental farm unit of the University of Murcia, Spain were used. Animals were housed in groups of seven and had access to a nutritionally balanced commercial diet with water continuously available. Each pen had an area of 1.139 m2 per animal, being in concordance to the legislation (Council Directive 2001/88/CE). The temperature in the pens was kept between a minimum of 15°C and a maximum of 25°C.
Saliva samples were collected using Salivette tubes (Sarstedt, Nümbrecht, Germany) and sponges, as reported before (Gutiérrez et al., Reference Gutiérrez, Martínez-Subiela and Cerón2009). Each pig was allowed to gently chew on a sponge, which was clipped to a flexible thin metal rod, until the sponge was thoroughly moistened (∼1 min).
Production of polyclonal antibody
A synthetic fragment from porcine CgA protein conjugated to Keyhole Limpet Hemocyanin (KLH) was selected as immunogen to produce polyclonal antibodies. Particularly, the fragment used was the CgA359−379 region and the sequence was obtained from the database (UniProt; http://www.uniprot.org/uniprot/P04404). The whole process of synthesis, conjugation and purification of the CgA fragment was performed commercially (EnoGene Biotech, New York, NY, USA).
The specific polyclonal antibodies against porcine CgA were produced in our laboratory according to standard protocols (University of California Berkley Animal Care and Use Committee, 2009). In brief, two 3-month-old New Zealand rabbits were immunized every 2 weeks for 2 months with 200 μg of synthetic porcine CgA359−379 (as antigen) emulsified 1/1 in Freund's complete adjuvant (Sigma-Aldrich, Madrid, Spain) (for the first immunization) and in Freund's incomplete adjuvant (Sigma-Aldrich, Madrid, Spain) (for the remaining immunizations).
One week following the last immunization, blood was extracted and the antiserum was evaluated by indirect ELISA. The animal that gave the best response was selected and its IgG content was purified using a HiTrap™ Protein G HP column, according to the manufacturer's instructions (GE Healthcare Life Sciences, Munich, Germany). The purity of the immunoglobulins was assessed by 4% to 12% SDS-PAGE and quantified using RC/DC protein assay (Bio-Rad Laboratories, Madrid, Spain).
Antibody labelling
An aliquot of 1 mg of the polyclonal antibodies produced (rabbit anti-synthetic CgA359−379) was used as a capture antibody in the immunoassay and was labelled with biotin using a commercial kit (No weigh Sulfo-NHS-biotin, Pierce, Thermo Fisher Scientific, Barrington, IL, USA). An additional aliquot of 1 mg of the same polyclonal antibodies was used as a detection antibody (anti-synthetic CgA359−379) and was labelled with a Eu chelate (DELFIA Eu-labeling kit, PerkinElmer Life and Analytical Sciences, Turku, Finland), following the manufacturer's instructions.
Immunoassay development
For the measurement of CgA levels in porcine saliva, a TR-IFMA was developed. To perform the assay, saliva samples were diluted 1/4 in assay buffer (DELFIA assay buffer, PerkinElmer Life and Analytical Sciences). The concentration range of the standard curve was obtained by taking into account the upper and lower detection limit of quantification of the assay, and was performed by diluting the standard peptide of known CgA concentration in assay buffer (DELFIA assay buffer, PerkinElmer Life and Analytical Sciences).
In brief, streptavidin microtitration strips (DELFIA streptavidin microtitration strips, PerkinElmer Life and Analytical Sciences) were covered with 100 μl of biotinylated antibody (100 ng/well), and were incubated for 1 h at room temperature with continuous shaking. Then the strips were washed four times with 200 μl of wash buffer (DELFIA wash concentrate, PerkinElmer Life and Analytical Sciences), and 100 μl of diluted samples or standard were added. Plates were incubated for 1 h, and after a second wash cycle, 100 μl of the Eu-labelled antibody (200 ng/well) was added to each well. The strips were incubated for 1 h and then washed again. Finally, 200 μl/well of enhancement solution (DELFIA enhancement solution, PerkinElmer Life and Analytical Sciences) was added, and strips were shaken for 5 min. The enhanced fluorescence, proportional to the quantity of CgA in the sample, was measured in a VICTOR2 1420 multilabel counter (Multilabel counter VICTOR2 1420, PerkinElmer Life and Analytical Sciences, Turku, Finland), and concentrations were calculated by the Wallac MultiCalc program (MultiCalc function software, PerkinElmer Life and Analytical Sciences, Wallac Oy, Turku, Finland).
Analytical validation
Assessment of intra-assay and inter-assay precision
The intra-assay precision, expressed as the coefficient of variation (CV), was calculated after analysis of two pools of saliva samples containing high and low levels of CgA, respectively, six times in a single analytical run. These pools were prepared by mixing samples from six animals with similar CgA concentrations, and the CgA content was measured using the assay described above.
The same pools were used to determinate the inter-assay precision by analyzing them on six different days within 1 week. The samples were frozen in aliquots, and vials were only thawed as required for each analytical run in order to prevent any possible variation as a result of repeated freeze-thaw cycles.
Calculation of the analytical limit of detection
The detection limit was defined as the lowest concentration of CgA that could be distinguished from a specimen of zero value. It was calculated for the immunoassay on the basis of date from 10 replicate determinations of the zero standard (assay buffer) as mean value plus two standard deviations.
Estimation of the lower and upper limit of quantification
The lower and upper limit of quantification was calculated based on the lowest and highest CgA concentration, respectively, that could be measured in the linear part of the calibration curve with a CV <20%, and above the limit of detection in the case of the lower limit. To estimate the lower limit of quantification, a saliva sample was serially diluted in assay buffer and each dilution was analyzed in five replicates in the same run. In the case of the upper limit of quantification, purified CgA was added to a saliva sample, because the CgA concentrations in the saliva samples were not high enough to calculate it.
Evaluation of assay accuracy
As no reference assay is available to quantify CgA in porcine saliva, the accuracy was indirectly investigated by linearity under dilution and recovery experiment as follows:
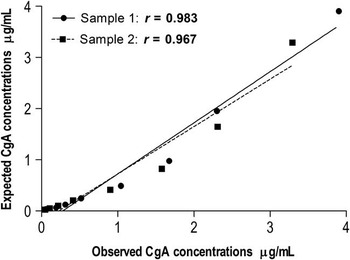
Linearity under dilution was determined by using two porcine saliva samples with high levels of CgA serially diluted with assay buffer, and the CgA concentration was measured by the TR-IFMA. Afterwards, curves representing measured CgA concentration v. concentration-expected CgA were constructed, and the coefficient of correlation (r) was calculated.
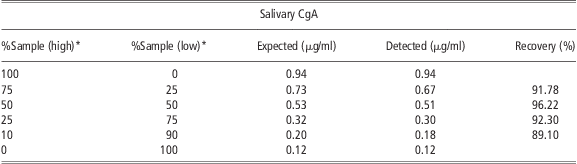
The recovery experiment was conducted, as previously reported (Parra et al., Reference Parra, Tecles, Martínez-Subiela and Cerón2005). One saliva sample containing a high level of CgA and one containing a low level of CgA were selected. The high CgA level sample was diluted twofold (50%), fourfold (25%) and 10-fold (10%) with the low CgA level saliva sample (50%, 75% and 90%, respectively). In addition, the low CgA level saliva sample was diluted fourfold (25%), with the high CgA level saliva sample (75%). Detected and expected cortisol levels for each diluted saliva sample were compared, and the percentages of recovery were calculated.
Monitoring of CgA concentrations in a model of experimental acute stress
For this purpose, 30 animals were sampled for saliva (at 800 h in the morning), 15 pigs that were subjected to an immobilization of 3 min with a nose snare (stress group), and another 15 pigs that were not subjected to any stressor stimulus (control group). Saliva samples were collected in both groups of animals, stressed and control pigs, before (Baseline) and after 15 min (T 15 min) and 30 min (T 30 min) of the stressor stimulus, respectively.
The animals set for stress induction were from different pens in order to avoid the possible psychological stress that the animal could suffer because of the observation of nasal snare application to others. In addition, the animals of the control group were sampled in a different room of the stressed animals to avoid the possible stress due to noise. The procedure was approved by the Murcia University Ethical Committee according to the European Council Directives regarding the protection of animals used for experimental purposes.
Salivary concentrations of cortisol were used as a control biomarker of stress in our experimental study and the results were correlated to the levels of CgA. Cortisol was analyzed with an immunoassay system (Immulite, Siemens Health Diagnostics, Deerfield, IL, USA) that has been validated in the authors’ laboratory for cortisol measurements in porcine saliva samples (Escribano et al., Reference Escribano, Fuentes and Cerón2012).
Statistical analysis
Intra- and inter-assay CVs and detection limits were calculated using routine descriptive statistical procedures. Ordinary regression analysis was used to investigate linearity under dilution. For the study, the Shapiro–Wilk test was conducted to assess the normality of data, giving a parametric distribution. Two-way ANOVA using the mixed model of repeated measures and Bonferroni post-test were used for statistical processing. Time (baseline, T 15 min and T 30 min), group effect (control v. stress group) and their interaction were included as factors. Pearson correlation coefficient was calculated between salivary CgA and cortisol concentration. All statistical analyses were performed using a statistical package (GraphPad Software, La Jolla, CA, USA) and a spreadsheet (Microsoft Corporation, Redmond, WA, USA). The significance level was set at P < 0.05.
Results
Production of polyclonal antibody
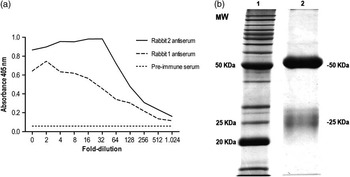
Both immunized rabbits exhibited different immunological responses, as indicated by indirect ELISA (Figure 1a). Antiserum from rabbit number 2 was chosen for IgG isolation, given its greater response. SDS-PAGE of the purified IgG revealed only two bands at 50 and 25 kDa (Figure 1b), respectively, corresponding to the heavy and light Ig chain and indicating a very high degree of purity of the polyclonal antibody produced.
(a) Immune response of the two rabbits to synthetic porcine chromogranin A (359–379) sequence relative to pre-immune serum. (b) Purity of the polyclonal antibody produced by SDS-PAGE. Lane 1: molecular weight markers (Invitrogen, Barcelona, Spain). Lane 2: purified immunoglobulin G (5 μg) from the selected rabbit number 2.

Calibration curve
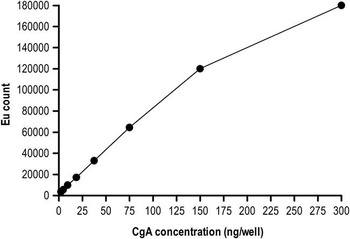
For calibration curve, six standard concentrations were chosen for routine use: 4.68, 9.37, 18.75, 37.5, 75 and 150 ng/well (Figure 2). The standard curve in this range of concentration was completely linear with a coefficient of determination (R 2) of 0.99. All samples with a degree of dilution 1/4 were within this measurement range. The highest concentration of CgA measured in a saliva sample was 123.25 ng/well, whereas the lowest was 10.4 ng/well.
Calibration curve for an optimized time-resolved immunofluorometric assay developed to measure chromogranin A (CgA) concentration in saliva samples of pigs. Notice that the calibration curve is linear until the measured CgA concentration reaches 150 ng/well (1.5 μg/ml). At a higher CgA concentration, the loss of linearity is more.

Analytical validation
Intra-assay and inter-assay precision
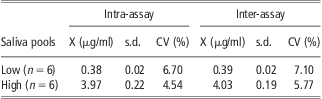
Results from the precision study are shown in Table 1. The intra-assay variation showed CVs that ranged between 6.36% and 4.54% for pool with low and high CgA concentration, respectively, whereas the inter-assay variation provided CVs that ranged between 7.10% for the pool with low level of CgA and 5.77% for the pool with high protein content.
Intra-assay and inter-assay precision obtained for TR-IFMA to the measurement of CgA in porcine saliva pool
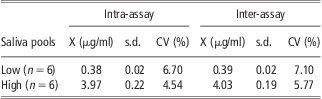
TR-IFMA = time-resolved immunofluorometry assay; CgA = chromogranin A; X = mean concentrations; s.d. = standard deviation; CV = coefficient of variation.
Limit of detection
The analytical limit of detection calculated gave a result of 4.27 × 10⁻³ μg/ml. The mean of 10 replicates was 1.415 × 10⁻³ μg/ml and standard deviation was 1.428 × 10⁻³ μg/ml.
Lower and upper limit of quantification
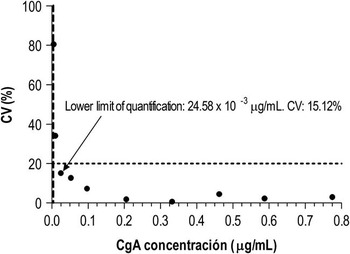
The lower limit of quantification was 24.5 × 10⁻³ μg/ml (Figure 3). In the case of upper limit of quantification, although the CVs were always below 20%, the linearity was progressively worse when higher CgA concentrations were added: 3 μg/ml showed a R 2 of 0.97; 6 μg/ml showed a R 2 of 0.95; 12 μg/ml showed a R 2 of 0.90; and 24 μg/ml showed a R 2 of 0.83. Therefore, the upper limit of quantification was established above 12 μg/ml. The lowest concentration of CgA measured in the current study was 0.416 μg/ml, whereas the highest was 4.93 μg/ml (without adding peptide of CgA).
Limit of quantification profile for the detection of salivary chromogranin A (CgA) by time-resolved immunofluorometric assay. Horizontal line illustrates the highest coefficient of variation (CV) accepted (20%) for the limit of quantification calculation. The vertical line shows the analytical limit of detection (4.27 × 10 to 3 μg/ml).

Assessment of assay accuracy
The dilution of two porcine saliva samples with high CgA concentrations resulted in linear regression equations (Figure 4), where ‘x’ represented the expected CgA level at the particular dilution and ‘y’ represented the measured CgA level. The coefficients of correlation obtained were of r = 0.983 and r = 0.967 for samples 1 and 2, respectively.
Investigation of linearity under dilution of two saliva samples containing high levels of chromogranin A (CgA; 3.90 and 3.29 μg/ml, respectively). r = correlation coefficient.

Results of the recovery study are shown in Table 2. The amount of salivary CgA detected in the diluted sample decreased in proportion to the amount of sample with low concentration added. Similarly, when the saliva with high concentration was used to spike the sample containing low levels of CgA, a rise in CgA levels of the former sample was observed. The recovery average was 92.35%.
Recovery of CgA in saliva samples
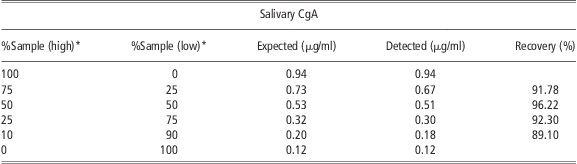
CgA = chromogranin A.
*High = high concentration of salivary CgA; Low = low concentration of salivary CgA.
Model of experimental acute stress
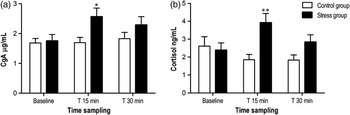
Statistical analysis in stress group showed that both the CgA and salivary cortisol increased significantly (P < 0.05 and P < 0.01, respectively) at 15 min after the stressor stimulus (immobilization with nose snare) compared with those obtained in baseline. The mean saliva CgA concentration increased from levels of 1.75 μg/ml at baseline to 2.56 μg/ml (31%), whereas that saliva cortisol concentration increased from levels of 2.39 ng/ml at baseline to 3.92 ng/ml (39%) at 15 min after immobilization. When comparing the values individually in the stress study, it can be observed that two animals did not show increased stress after 15 min, with respect to baseline in any of the two markers. The comparisons of the same period (baseline, T 15 min and T 30 min) between stress and control groups showed significant differences at 15 min after immobilization with respect to control group, in both CgA and cortisol (Figure 5). For both markers, significant interactions between time and group were found (P < 0.05 and P < 0.01, CgA and cortisol, respectively). When the CgA and cortisol concentrations in saliva were compared, a slight positive correlation (r = 0.535; P < 0.0001) was identified.
Salivary chromogranin A (CgA) levels (a) and salivary cortisol levels (b) in control and stress group (n = 15) before (Baseline) and after 15 min (T 15 min) and 30 min (T 30 min) of the stressor stimulus (immobilization by nose snare). Asterisk indicates statistically significant difference (*P < 0.05, **P < 0.01) in relation to control group using two-way ANOVA mixed model of repeated measures and Bonferroni post-test. Values are mean ± s.e.

Discussion
The major advantages of the use of saliva to measure a marker are that the sampling procedure is non-invasive and it can be performed in non-stressful conditions. Unlike the blood sampling method, it does not provide an additional stress, which could be a confounding factor in stress models (Noto et al., Reference Noto, Sato, Kudo, Kurata and Hirota2005).
The stress response system includes the sympathoadrenal-medullary (SAM) system and the hypothalamus–pituitary–adrenal (HPA) axis (Akiyoshi et al., Reference Akiyoshi, Aoki, Shimada, Noda, Kumagai, Saleh, Sugii and Ohashi2005a). The activities of the SAM system and the HPA axis can be biochemically evaluated by measuring catecholamines and cortisol, respectively (Lee et al., Reference Lee, Shimizu, Iijima, Obinata, Yamashiro and Nagasawa2006). Unfortunately, the salivary catecholamines concentrations are several folds lower than those of venous blood and do not reflect short-term changes in blood. For this reason, the salivary catecholamine concentrations are poor indexes of acute changes in SAM activity (Takai et al., Reference Takai, Yamaguchi, Aragaki, Eto, Uchihashi and Nishikawa2004). In addition, the measurement of salivary catecholamines is rather difficult (usually using a high-performance liquid chromatography procedure with electrochemical detection or a radioenzymatic method) because of its low concentration and rapid degradation (Miyakawa et al., Reference Miyakawa, Matsui, Kishikawa, Murayama, Uchiyama, Itoh and Yoshida2006). It has been reported that salivary CgA could be a useful biochemical marker of stress in human medicine (Lee et al., Reference Lee, Shimizu, Iijima, Obinata, Yamashiro and Nagasawa2006) and it may be considered as a possible alternative for the evaluation of SAM activity (Dimsdale et al., Reference Dimsdale, O'Connor, Ziegler and Mills1992) for the measurements of catecholamines in saliva.
Analytes in saliva are generally present in small quantities, drawbacks which can be circumvented by using highly sensitive detection techniques such as TR-IFMA. This technology uses highly specific lanthanide chelate labels that facilitate the use of non-competitive immunoassays with superior detection limits and dynamic ranges. The advantage in these assays is the possibility to resolve the background fluorescence (due to biological fluids) from the assay (Darwish, Reference Darwish2006).
In the present study, we have developed and validated a TR-IFMA for the measurement of salivary CgA in pigs. The validation of the assay has been carried out as an essential step before establishing a new protocol in a new laboratory or animal species (Tecles et al., Reference Tecles, Fuentes, Martínez-Subiela, Parra, Muñoz and Cerón2007).
The CVs for the TR-IFMA indicated a good precision for measuring salivary CgA concentrations being <8%, and it is generally accepted that the CVs must be lower than 20% for immunological assays if absorbance value of the analyte is close to the detection limit (Guidance for Industry: Bioanalytical Method Validation, 2001). The precision obtained in our assay was higher to those established for ELISA techniques for CgA measure in human saliva (<9% for intra-assay CV and <13% for inter-assay CV; Filaire et al., Reference Filaire, Dreux, Massart, Nourrit, Rama and Teixeira2009) and much better than those reported for canine CgA measurements by ELISA (<16% for intra-assay CV and <17% for inter-assay CV; Akiyoshi et al., Reference Akiyoshi, Aoki, Kumagai, Saleh, Noda, Shimada, Sugii and Ohashi2005b). Such a low intra-assay variation makes assays of duplicate samples unnecessary, yielding savings in time and sample volume required to perform the assay.
The high sensitivity of the assay for CgA measurement in porcine saliva samples was demonstrated by the low limit of detection (4.27 × 10⁻³ μg/ml) and lower limit of quantification (24.5 × 10⁻³ μg/ml). This technique has sufficient sensitivity to quantify salivary CgA concentrations in this species, as the median concentrations of CgA in the saliva, which were quantified in our study in all animals, were much higher than the limits of the quantification of the method developed. Moreover, the good accuracy of the assay was determined indirectly by the high correlation coefficients that were obtained for CgA concentrations in serially diluted samples of saliva. This high accuracy was additionally supported by the results found in the recovery experiment, as in all cases the recovery was close to 100%.
The overall results of the analytical validation of immunoassay that were assessed, namely, precision, sensitivity (limit of detection and lower limit of quantification) and accuracy (linearity under dilution and recovery), indicated that the assay developed was able to detect porcine CgA in saliva samples.
To monitor CgA levels under a stress condition, we used an experimental acute stress model that has been proved to increase salivary cortisol concentration in saliva samples (Geverink et al., Reference Geverink, Schouten, Gort and Wiegant2002) and the sympathetic activation (Merlot et al., Reference Merlot, Mounier and Prunier2011). When the acute stress model was applied in our study, significant increases at 15 min were obtained in both salivary cortisol, as reported before (Geverink et al., Reference Geverink, Schouten, Gort and Wiegant2002; Merlot et al., Reference Merlot, Mounier and Prunier2011), and CgA concentrations. The mean increase of CgA was of 31%, a value that is between the increases described in several human studies about acute stress for the effect of examination (26%; Takatsuji et al., Reference Takatsuji, Sugimoto, Ishizaki, Ozaki, Matsuyama and Yamaguchi2008) and after venipuncture in children (49%; Lee et al., Reference Lee, Shimizu, Iijima, Obinata, Yamashiro and Nagasawa2006). Moreover, in the study about social isolation stress using saliva sampling in cows was described as a mean increase of 50% after 30 min of social isolation (Ninomiya and Sato, Reference Ninomiya and Sato2011). To the authors’ knowledge, there are no studies about the use of salivary CgA as a marker of stress in pigs that could be compared with our results. These data described herein provide the first evidence of the usefulness of salivary CgA as a biomarker for an acute stress in pigs.
An individual variability in responses of salivary stress markers, cortisol and CgA, between animals was observed. This variability may be explained by the differences in sensitivity of each individual animal against the stress (Fazio and Ferlazzo, Reference Fazio and Ferlazzo2003), and it is also described in humans (Miyakawa et al., Reference Miyakawa, Matsui, Kishikawa, Murayama, Uchiyama, Itoh and Yoshida2006). Salivary CgA is considered as a reliable marker of SAM activation in humans (Gallina et al., Reference Gallina, Di Mauro, D′Amico, D′Angelo, Sablone, Di Fonso, Bascelli, Izzicupo and Di Baldassarre2011), whereas salivary cortisol is considered as a good indicator of the HPA axis response to stressors in pigs (Merlot et al., Reference Merlot, Mounier and Prunier2011). However, more studies are needed to evidence the fact that salivary CgA reflects sympathetic activation in pigs. Although the salivary CgA levels have been increased after to apply our experimental acute stressor in growing pigs, further studies using others stress conditions are needed to evaluate, for example, the time that salivary CgA remain elevated after a stressful stimulus or their physiological range of variation.
Conclusions
Overall, from our study, it could be concluded that the immunofluorometric assay developed for porcine CgA determinations would be suitable for its use in saliva samples with a good precision, sensitivity and accuracy. In addition, we have observed that salivary CgA levels increase after applying a model of acute stress in growing pigs and could be used as a marker of stress in this species.
Acknowledgements
This study was supported by a grant from the University of Murcia, Spain.