


Hypocalcemia occurs in cows when their blood calcium (Ca) concentration decreases below the normal physiological range due to their inability to adjust to the sudden increase in Ca demand following calving (Seely et al., Reference Seely, Leno, Kerwin, Overton and McArt2021). Although data from modern dairy farms indicate a low incidence of clinical hypocalcemia (Goff, Reference Goff2008), subclinical hypocalcemia (SCH) is still prevalent in commercial dairy farms, affecting a significant proportion of early-lactation cows (McArt and Neves, Reference McArt and Neves2020; Serrenho et al., Reference Serrenho, DeVries, Duffield and LeBlanc2021).
Owing to the considerable variability in blood Ca dynamics within a few days after calving, a single blood sample obtained shortly after calving for SCH classification may be a poor predictor of postpartum illness (Neves et al., Reference Neves, Leno, Bach and McArt2018; Seely et al., Reference Seely, Leno, Kerwin, Overton and McArt2021; McArt and Neves, Reference McArt and Neves2020). A temporary drop in blood Ca may occur immediately after parturition as a normal physiological response to the sudden surge in Ca demand (McArt and Neves, Reference McArt and Neves2020). In contrast to transient blood Ca reductions, delayed or persistent blood Ca reductions may indicate failure to maintain the Ca homeostatic system and, thus, be a better predictor of postpartum diseases, notably metritis in dairy cows (Seely et al., Reference Seely, Leno, Kerwin, Overton and McArt2021). For example, Neves et al. (Reference Neves, Leno, Bach and McArt2018) reported that in primiparous Holstein cows, there was no association between blood Ca concentration at 1 DIM and the risk of metritis development. However, they identified a significant association between blood Ca concentration at 2, 3, and 4 DIM and the risk of metritis. More information is required, particularly under commercial management systems, to identify the most reliable time point for SCH diagnosis (Rodríguez et al., Reference Rodríguez, Arís and Bach2017; Venjakob et al., Reference Venjakob, Pieper, Heuwieser and Borchardt2018; McArt and Neves, Reference McArt and Neves2020).
Creation of a negative dietary cation–anion difference (DCAD) by adding anionic salts to a close-up diet has been adopted as an effective nutritional strategy to help alleviate Ca deficit, and thus prevent clinical and subclinical hypocalcemia in dairy cows (Megahed et al., Reference Megahed, Hiew, El Badawy and Constable2018; Lean et al., Reference Lean, Santos, Block and Golder2019; Santos et al., Reference Santos, Lean, Golder and Block2019). Feeding an acidogenic diet causes the blood pH to decrease, allowing the bones to release Ca into the extracellular fluid to counteract the high anion concentration in the blood (Goff and Horst, Reference Goff and Horst2003; Caixeta and Omontese, Reference Caixeta and Omontese2021). Martinez et al. (Reference Martinez, Rodney, Block, Hernandez, Nelson, Lean and Santos2018) reported a 30% reduction in the incidence of SCH in cows fed negative vs. positive DCAD diets during the prepartum period. However, less information is available to assess the association of DCAD status of prepartum diet and SCH classification according to DIM of blood Ca assessment. The first objective of this investigation was to identify the association between serum Ca concentration at 1, 2, and 4 DIM and the likelihood of cows being diagnosed with metritis. The second objective was to assess the association of risk factors, including prepartum serum magnesium (Mg), phosphorus (P) and Ca concentration as well as the DCAD status of the close-up diet and parity with SCH dichotomized into normocalcemic (>8.82 mg/dl) and subclinical hypocalcemic (≤8.82 mg/dl; Seely et al., Reference Seely, Leno, Kerwin, Overton and McArt2021; McArt and Neves, Reference McArt and Neves2020; McArt and Oetzel, Reference McArt and Oetzel2023).
Materials and methods
Herd description, analysis, and definitions
Two commercial Holstein herds (A and B) participated in data collection from July to September 2018. The herds were located in the central north of Iran (Tehran province). The second herd had originated from the first herd primarily because of stocking density challenges. Thus, both herds shared a similar genetic background among their lactating cows. Both herds had consistent management practices of having free-stall housing with a total mixed ration feeding program as well as a robust herd health program, including regular veterinary care, vaccination protocols, and disease prevention measures. Cows chosen for the trial met the criteria of being Holstein breed, aged between 2 and 8 years old, without major chronic health issues, not being introduced to the herd within the last 6 months and having consistent diet and management system for the last 6 months. In total, 62 cows (19 primiparous and 43 multiparous Holstein cows) were recruited for this study (herd A n = 32, herd B n = 30). During the prepartum period, herd A received a total mixed ration with a negative DCAD (−34 mEq/kg of DM), which falls within the typical negative DCAD diet for Iranian commercial dairy farms (usually ranging from 0 to −50 mEq/kg of DM). Ammonium sulfate and calcium chloride were used as anionic salts in the close-up diet. Herd B received a total mixed ration with a positive DCAD (+201 mEq/kg of DM) and did not include any anionic salts. DCAD (mEq/kg) was calculated using the formula (Na + K) − (Cl + S) (Sanchez et al., Reference Sanchez, Beede and Delorenzo1994). Both herds were fed their respective diet once daily in the morning. Ingredients and chemical composition of prepartum diets formulated using NRC (2001) are listed in online Supplementary Table S1. Both farms A (2300 cows) and B (1800 cows) had a milking frequency of 3 times/d.
Blood was drawn from the coccygeal vein using a 20-gauge Vacutainer needle into an evacuated tube containing no anticoagulant (FL Medical, Torreglia, Italy) from approximately 1 d before the expected parturition date and then at 1, 2, 4, 6, 8, or 10 d after calving. The collected pre-calving blood samples were used for measurement of Mg, P, and Ca. The collected postpartum blood samples were analyzed for Ca only. After centrifugation at 2000 × g for 15 min, serum was recovered and stored at −20°C until mineral analysis. The total Ca, P, and Mg concentrations were determined using commercial kits (Pars Azmoon Co. Tehran, Iran) and an automated analyzer (RA-1000, Pharmacia Co., LKB, Novaspec, USA). The intra- and inter-assay coefficient of variations were less than 5%. Body condition score (BCS) was determined using a 5-point scale (Wildman et al., Reference Wildman, Jones, Wagner, Boman, Troutt and Lesch1982) and categorized into a 3-level variable as: thin: BCS ≤ 2.75; normal: 3.0 ≤ BCS ≤ 3.5; over-conditioned: BCS ≥ 3.75 (Neves et al., Reference Neves, Leno, Bach and McArt2018). Parity was classified into a 3-level variable as first, second, and third or greater lactations. The case definition of the disease in both farms was established through the active participation and expertise of the first author, a qualified veterinarian, ensuring a standardized and consistent approach to identifying the diseases. Calving ease was also classified into a 2-level variable as cows with no or negligible assistance or suffering from dystocia. Failure to discharge fetal membranes within 24 h of calving was characterized as retained placenta (Qu et al., Reference Qu, Fadden, Traber and Bobe2014). Farm veterinarians checked uterine health, and metritis was diagnosed when reddish to brownish discharges were evident, often accompanied by symptoms of systemic diseases, including elevated rectal temperature (≥39.5°C) or fever (Sheldon et al., Reference Sheldon, Lewis, LeBlanc and Gilbert2006).
Data analysis
Data of serum Ca collected over time from the two herds were analyzed using the MIXED Proc of SAS (SAS 9.4, SAS Institute Inc., Cary, NC) to detect the main effects of prepartum DCAD status, time (blood sampling relative to calving), and the DCAD-by-time interaction, with time variable specified in the REPEATED statement. Three covariance structures, namely Autoregressive type 1, Toeplitz, and Compound symmetry were tested to account for within-cow variations. The lowest Akaike's information criterion was achieved using Autoregressive type 1 and was selected. A significant difference (P ≤ 0.05) was identified using the PDIFF option with a Tukey's test. The influence of prepartum DCAD status on the incidence of dystocia, retained placenta, or metritis was assessed using the GENMOD Proc in SAS, employing a Binomial distribution and logit link function. A ROC curve was constructed using SPSS (IBM SPSS Statistics, Version 24.0 Armonk, NY, USA, INM Corp., USA) to identify whether serum Ca concentration at 1, 2, and 4 DIM (continuous variables) could be a potential predictor of occurring metritis dichotomized into 0 = no disease and 1 = diseased. A second ROC analysis was also built to identify whether prepartum serum Mg, P, and Ca concentrations (continuous variables) were associated with SCH at 4 DIM (the classification variable). Continuous variables underwent a normality check, but no transformation was required. A multivariate binary logistic regression model was constructed in SAS to assess the association of prepartum DCAD status (negative vs. positive DCAD) and parity (a 3-level variable) with odds of developing SCH classification at 4 DIM based on the cut-off point of 8.82 mg/dl. The models initially included the BCS category at calving as a covariate, however, it was non-significant and removed from the model. Odds ratios with confidence intervals (95%) are reported for logistic regression models.
Results and discussion
Table 1 describes group proportions of BCS and parity in 62 recruited Holstein cows. Table 2 reports the effect of prepartum DCAD status on prepartum serum Mg and P, and the incidence of dystocia, retained placenta, and metritis. Prepartum serum Mg and P concentrations were not different between cows fed prepartum negative vs. positive DCAD close-up diet. Prepartum DCAD status also had no effect on the incidence of dystocia, retained placenta, and metritis.
Description of group proportions of body condition score (BCS) and parity in 62 Holstein cows from two commercial herds
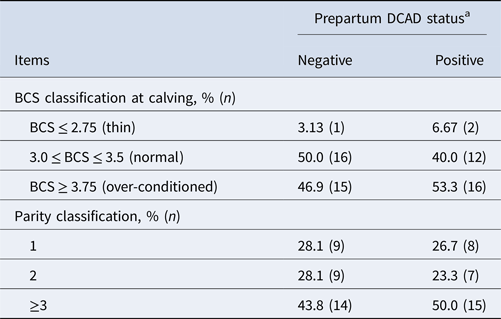
a The negative DCAD ration was fed in herd A (n = 32), and the positive DCAD ration was fed in herd B (n = 30).
Effect of prepartum DCAD status on prepartum serum Mg and P concentrations (mean ± standard deviation) and disease incidence in 62 Holstein cows from two commercial herds

a Prepartum blood was collected approximately 24 h before the expected parturition.
b Calving ease was classified as a 2-level variable, with cows requiring no or negligible assistance or suffering from dystocia.
c Failure to expel fetal membranes within 24 h after calving was defined as retained placenta.
* The negative DCAD ration was fed in Herd A (n = 32), and the positive DCAD ration was fed in Herd B (n = 30).
Serum Ca dynamics and association with metritis
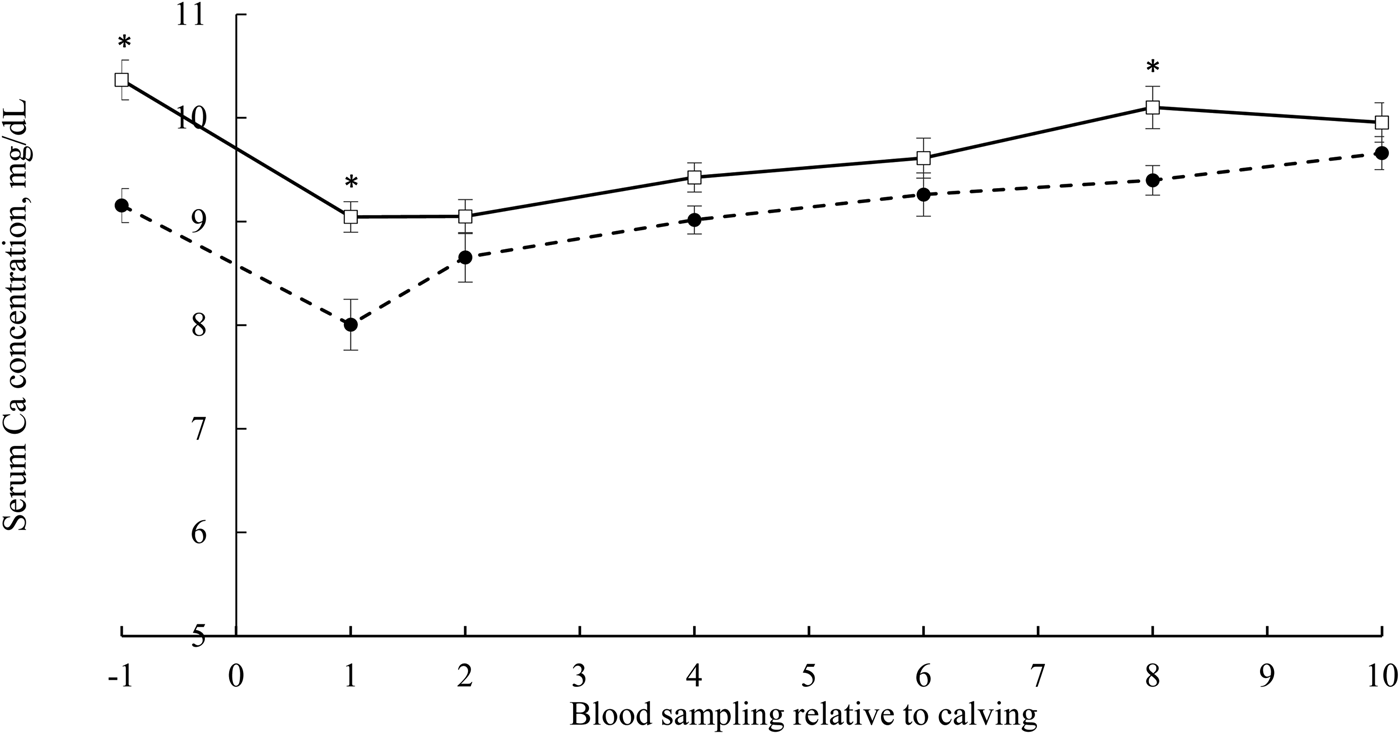
The effect of prepartum DCAD status on serum Ca concentration at different time points is shown in Fig. 1. The DCAD-by-time interaction was significant (P = 0.01) as negative DCAD-fed cows had greater serum Ca concentration before calving (−1) and d 1 and 8 post-calving. Prepartum DCAD status had no effect on serum Ca concentration at other time points (2, 4, 6, and 10 DIM).
Serum Ca concentration at different time points from 1 d before the expected calving date to 10 DIM in Holstein cows from two commercial herds. The negative DCAD ration (solid line) was fed in Herd A (n = 32). The positive DCAD ration (dashed line) was fed in herd B (n = 30). Time indicates serum Ca changes over time. An asterisk at each time point designates a statistical difference (P < 0.05). Error bars indicate standard error. There were significant effects of DCAD status, time and their interaction (P ≤ 0.01).
Association of serum Ca concentration at 1, 2, and 4 DIM with the risk of metritis diagnosis, and association of prepartum blood macrominerals (Mg, P, and Ca) with postpartum blood Ca concentration dichotomized into 2 categories of normocalcemic (>8.82 mg/dl) and subclinical hypocalcemic (≤8.82 mg/dl), is presented in Table 3. According to ROC curve analysis, serum Ca concentration at 4 DIM but not 1 and 2 was a significant predictor of metritis (AUC = 0.87; P < 0.01), implying the adequate accuracy of the diagnostic test (AUC = 0.7 to 0.9; Swets, Reference Swets1988). A growing body of evidence indicates the important involvement of Ca metabolism in the development of metritis and the heightened vulnerability of hypocalcemic cows to this condition (Martinez et al., Reference Martinez, Risco, Lima, Bisinotto, Greco, Ribeiro, Maunsell, Galvão and Santos2012; Rodríguez et al., Reference Rodríguez, Arís and Bach2017). Impairment of immune function in SCH cows diminishes muscle contraction, which is associated with the elevated risk of developing uterine diseases (Martinez et al., Reference Martinez, Risco, Lima, Bisinotto, Greco, Ribeiro, Maunsell, Galvão and Santos2012). Our findings support those of Neves et al. (Reference Neves, Leno, Bach and McArt2018), who reported that blood Ca concentration at 1 DIM did not show an association with the risk of both primiparous and multiparous cows being diagnosed with metritis, but blood Ca concentration at 2, 3, and 4 DIM was a significant predictor of metritis development only in primiparous cows.
Association of total serum Ca concentration (continuous variable) at DIM 1, 2, and 4 with the risk of being diagnosed with metritis (categorized variable) and association of prepartum serum macrominerals (continuous variable) with subclinical hypocalcemia classification (DIM 4)a in two commercial herds
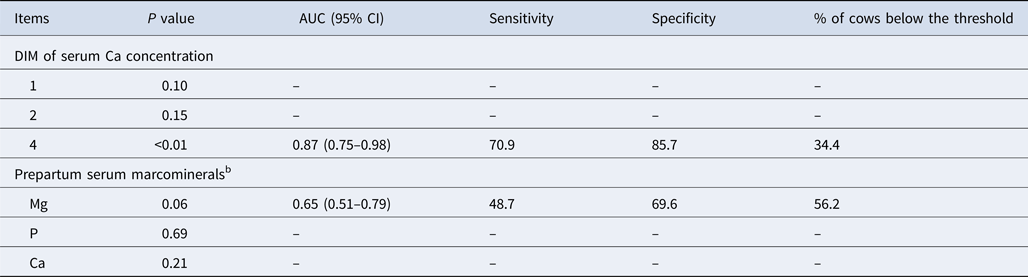
AUC, area under the curve.
a Dichotomization of serum Ca concentration (4 DIM) was based on the optimized Ca cut-off point from ROC curve analysis. Cows were classified into normocalcemic if total serum Ca concentration was >8.82 mg/dl at 4 DIM or subclinical hypocalcemia if total blood Ca concentration ≤8.82 mg/dl at 4 DIM.
b Prepartum blood was collected approximately 24 h before the expected parturition.
Association of prepartum serum macrominerals with SCH classification
According to the ROC curve analysis, a non-significant numerical difference was identified between prepartum serum Mg and SCH at 4 DIM (AUC = 0.65; P = 0.06). Association between prepartum Mg and postpartum SCH was anticipated as Mg status in the periparturient cow plays an important role in Ca metabolism, and hypomagnesemia has been recognized as a contributing factor for the development of clinical hypocalcemia (Lean et al., Reference Lean, DeGaris, McNeil and Block2006). Neves et al. (Reference Neves, Leno, Stokol, Overton and McArt2017) also identified no link between prepartum blood Mg concentration and the risk of cows being categorized as SCH at calving. They suggested that their inability to identify any association may have originated from the low prevalence of prepartum subclinical hypomagnesemia as feeding prepartum rations containing Mg sources with proper bioavailability and adequate amounts may minimize the risk of developing hypomagnesemia and the subsequent effect on the SCH occurrence due to Mg deficient states. Although the cut-off point defining subclinical hypomagnesemia has not been characterized formally, a prepartum Mg concentration <1.95 mg/dl has been used for the classification of prepartum subclinical hypomagnesemia (Goff, Reference Goff2008; Neves et al., Reference Neves, Leno, Stokol, Overton and McArt2017). In this experiment, prepartum serum Mg concentration in cows fed negative and positive DCAD diets averaged 2.57 and 2.42 mg/dl, respectively, with only 3.03 and 3.23% of cows fed negative and positive DCAD diets having serum Mg concentrations below the cut-off point of <1.95 mg/dl. This low prevalence might not have had enough statistical power to establish a strong and reliable association between prepartum serum Mg concentration and postpartum SCH classification. To precisely optimize the prepartum Mg cut-off point, additional information is required to identify whether the greater variability in prepartum Mg concentration may affect the risk of developing SCH.
The association of prepartum DCAD and parity with SCH dichotomized into 2 categories of normocalcemic (>8.82 mg/dl) and subclinical hypocalcemic (≤8.82 mg/dl) is listed in Table 4. Cows fed positive vs. negative DCAD prepartum ration had a numerically greater incidence of SCH classification at 4 DIM [odds ratio = 2.71; 95% confidence interval = 0.87–8.41; P = 0.09]. Our findings support the benefits of feeding a negative-DCAD prepartum diet that reduces the risk of low serum Ca concentration postpartum. In agreement, dairy cow studies have reported that a reduction in DCAD of prepartum diet from 300 to 0 mEq/kg resulted in reduced risk of being diagnosed with clinical hypocalcemia (16.4 to 3.2%) and increased blood ionized Ca pool before and after parturition (Charbonneau et al., Reference Charbonneau, Pellerin and Oetzel2006; Lean et al., Reference Lean, DeGaris, McNeil and Block2006). This thereby contributed to the diminished risk of postpartum diseases such as retained placenta and metritis (Charbonneau et al., Reference Charbonneau, Pellerin and Oetzel2006; Lean et al., Reference Lean, Santos, Block and Golder2019).
Final logistic regression models evaluating the association of DCADa status of prepartum diet (negative DCAD is reference point) and parity (primiparity is reference point) with subclinical hypocalcemia classification (normocalcemia is reference point)b in Holstein cows from two commercial herds
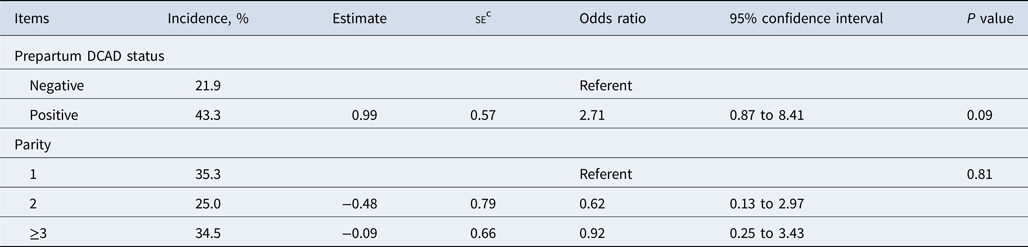
a DCAD, dietary cation–anion difference.
b Cows were classified into normocalcemic if the total serum Ca concentration at 4 DIM was >8.82 mg/dl or subclinical hypocalcemia if the total serum Ca concentration at 4 DIM was ≤8.82 mg/dl.
c se, standard error of the estimate.
Parity was not found to be a significant predictor of SCH classification at 4 DIM, which is consistent with the findings of Neves et al. (Reference Neves, Leno, Stokol, Overton and McArt2017), who reported that parity was a significant predictor of SCH classification at the immediate postpartum period (within 4 h of parturition) but not 2 DIM. The physiological processes related to Ca metabolism and vitamin D receptor function tend to decline with age in cows, particularly in older parity individuals. Consequently, older parity cows exhibit reduced capacity to adequately maintain Ca turnover rates during the immediate postpartum period (Horst et al., Reference Horst, Goff and Reinhardt1990; Neves et al., Reference Neves, Leno, Stokol, Overton and McArt2017). However, as the DIM of blood Ca analysis advances, this effect becomes less pronounced.
It is important to highlight that this experiment suffers from a limitation in that the categorization of positive and negative DCAD-fed cows from two different herds might have introduced confounding variables into the results. Despite our initial attempts to minimize the herd-associated confounding by selecting the second herd that had originally emerged from the first herd (cows with comparatively similar genetic backgrounds), this approach may not have fully eliminated the residual confounding related to herd-to-herd variations. Future research should prioritize controlled trials, enabling greater control over variables for more accurate conclusions.
In conclusion, our findings validate distinct differences in the relationship between the timing of blood sampling relative to parturition and the risk of Holstein cows being diagnosed with metritis. We identified that serum Ca concentration at 4 DIM demonstrated a significant and consistent association with the development of metritis. Serum prepartum Mg but not P and Ca tended to be a significant predictor of SCH classification based on a serum Ca threshold at 4 DIM (8.82 mg/dl). Feeding a prepartum diet with a positive DCAD compared to a negative DCAD was associated with higher odds of being classified as SCH at 4 DIM. This study provided herd-level information about the DIM of blood Ca assessment for more accurate categorization of SCH and the associated risk factors that could help set targets for preventative strategies under commercial farm management conditions.
Supplementary material
The supplementary material for this article can be found at https://doi.org/10.1017/S0022029924000451



