


Introduction
This paper discusses the main characteristics of Turkey’s health development process in connection with the effects of structural changes made within the country’s economic, social, and public health systems. Special emphasis is placed on discussing the factors that render the country-level health policy successful and on evaluating this success in terms of the country’s long-term capability to prolong life expectancy and sustainably decrease the infant and adult mortality rate. Furthermore, the potential of these policies to affect the broader dimensions of human development and to interact with the corresponding processes and policies in other spheres of development will also be examined. In order to begin evaluating the success or failure of Turkey’s health policies and human development path, a method of measuring and quantifying the process of development—most importantly, the health- and human-related dimensions of this process—must first be determined. To do this, the paper makes use of the simplest and most common historically and geographically comparable measures of health-related inputs, outputs, and technology. I believe that this is the most appropriate method of conducting an initial foray into this field of comparative development, especially since the paper places special emphasis on the trajectory of health parameters and outputs in the longer term.Footnote 1 In the paper, an effort will be made to link the occurrences in this very important dimension of health output with health achievement, and also to chart these occurrences in relation to events in the dimensions of health policy, income growth, and income equality.
The structure of the paper is as follows. First, I introduce the theoretical discussions on how to measure health development and how to relate development in a given country’s health dimensions with development in the dimensions of the overall economic output. This theoretical discussion will support the dimensions and time period of the analysis as well as working to enrich the later discussion of the fundamental drivers and limitations of Chinese and Turkish development for the period under question. Next, the paper will proceed by providing a rationale for comparing the Chinese and Turkish experiences in creating a national health system, after which the decades contained in the period of analysis will be analyzed separately, from the 1960s to 2010, focusing on decade-specific characteristics and on the effects of health reforms and health developments. For this general period, I introduce the idea of the co-movement of countries’ health and economic parameters. In line with the literature, I differentiate two more consistent sub-periods and show that there was significant variation between them. Finally, the paper concludes by addressing the utility of the convergence approach and with my conclusions regarding the main findings of the research.
One further explanation must here be provided in regard to the crucial comparator setFootnote 2 that allows me to situate the challenges encountered by and achievements made in Turkey in the different time periods of the dataset. In the aggregate group that has been chosen for comparison, I include the set of countries that belongs to a group comparable to Turkey in terms of aggregate health levels and aggregate output levels in 1960. Concurrently with this macro comparison, I also undertake a more in-depth comparison of Turkey’s development with that of China. There are several reasons for specifically choosing China in order to conduct this contrast. (i) Both countries have a similar prior history in terms of health development and health problems, with a shared developmental path from similar backgrounds; i.e., they were originally large empires with sizeable but poor populations with similar epidemiological issues, life expectancies, and mortality values. (ii) Both countries were initially characterized—especially before the 1980s—as rural-based economies and rural-weighted demographic structures, since a significant part of the economy and, more importantly, the population, resided in rural areas, as a result of which the health restructuring that was performed so as to improve the health outcomes of the general population became intrinsically linked to restructuring the health access of rural populations and the nature of rural health services.Footnote 3 (iii) Considering the progression of the two countries’ health and economic values over time, both can be broadly placed in the “developing country” category,Footnote 4 with their main period of development occurring in the second half of the 20th century. The important shifts in the countries’ economic and health systems allows a search for the “macro” effects of these changes similar to that seen in searches for the aggregate health values and outcomes of developing countries. (iv) The comparison found in this paper is especially motivated by the fact that China is used as a crucial comparator country in a considerable amount of current research on economic, political, and health development. The importance of China’s development experience in these different dimensions stems from the following: (a) in many decades, China was the world leader in one or both of the crucial dimensions of health and economic development; and (ii) owing to its sheer size—initially in population and increasingly in economic output as well—the Chinese development experience forms a part of the global picture that must not be overlooked. (v) During their most successful period of development, which occurred in the second half of the 20th century, both countries were defined by very important and radical transitions in their economic systems and concurrently—and more importantly for this paper—in their health organization, institutions, and infrastructure. Both countries’ general economic development paths are characterized by an abrupt transition from a period of mild or radical “socialization” to a period of increased “marketization,” privatization, and private expenditure.Footnote 5 The resulting development during the time period focused on here (i.e., 1960–2010) can be seen in related graphs, and the countries’ relative life expectancy/economic performance can be discerned via an understanding of the specific channels by which the general process of marketization affected their health sectors and health system outcomes. Although the broad patterns are similar, the effects of the differences in the micro organization and institutionalization of the nationalization and privatization processes are well worth investigating, both in the Turkey-China subset and in relation to the broader developing country context.
In the comparative developmental framework established in this paper, the post-1980 period is considered a separate period with independent economic and development parameters; this is consistent with the international literature,Footnote 6 and such a perspective is widely used in the general development literature.Footnote 7 The further conceptualization of the post-2000 period as an independent period of health system periodization also conforms with a considerable amount of literature relating to the implementation of health transformation programs across the developing world. In the case of the health reforms in the post-1980s period, dimensions other than macro health outputs, such as life expectancy and infant mortality, have also been analyzed; hence, for this specific time period, Turkish successes and limitations will be evaluated using a multidimensional framework.
In this study, I focus particularly on the effects of health policy and the development of health parameters, as the last 30 years of the economics literature has largely overlooked the independent and self-sustaining characteristics of health-related development.Footnote 8 The Turkish health system, which forms the main subject of the paper, has experienced a 30-year transformation process designed to match its health development with its economic development. In the process of reaching these health goals, important health challenges have been and are currently still being faced by the Turkish healthcare system. An important example of this, and indeed the most glaring weakness of the system, was evidenced by infant mortality figures, which until recently had been comparable to those of a developing country with a much lower per-capita income level.Footnote 9
Another goal of this paper is to create a comparative frameworkFootnote 10 involving the greatest possible set of comparator countries (a maximum of 88) for the purpose of situating, understanding, and comparing with similar countries the dynamics of Turkey’s health development, economic development, and health policy in the post-1960 period.Footnote 11 This period is divided into two shorter periods, taking as the dividing point the structural break that occurred in the midst of the 1980s, a point in time chosen because, for the majority of developing countries, it represents a major breakFootnote 12 in terms of the structural parameters related to health and economics, as well as terms of the relation between the dimensions of health and the economy.Footnote 13 In addition, for certain parts of the developing world—such as the post-Soviet republicsFootnote 14 and sub-Saharan AfricaFootnote 15 —this period marked a structural break in the development of macro health values. In investigating the health and economic systems of Turkey and the other comparable developing countries chosen, I attribute special importance to the effects of marketizationFootnote 16 and the opening of the global health market that occurred in the post-1980 period. In the analysis here, which is consistent with prior research in this field,Footnote 17 the post-1980 period is identified, analyzed, and differentiated as an “independent” period of development, especially within the crucial context of the development of health parameters.Footnote 18
Thus roughly dividing Turkish health development into two different periods for the purposes of evaluation, I reach the following preliminary conclusions. Analysis of the overall characteristics of the Turkish health system and the Turkish health-economy nexus must begin with the 1960s, a period that marked the beginning of the health system’s transformation from a mostly private, particularized, consumer-oriented, and urbanized health system into a public, more nationalized system. Furthermore, this study plots the development of life expectancy values, beginning with the 1960–1980 period, taking this as an important threshold period during which the process of increasing both health capacity and coverage and the system’s rural inclusivity was advanced. Although this process was mainly targeted toward decreasing macro rural-urban inequality in regard to health values, I will investigate whether this reform initiative also had an effect on the national health development values measured by this paper.
In terms of transformation, and in addition to the post-1980 period—which created new urban and treatment-biased priorities for the health system—the post-2000 period represents another important sub-period, as during this era the priorities and mode of organization achieved a new level of complexity. Turkey began this period with increased marketization, an increased proportion of the public budget allocated to health, and increased total health expenditure, and this was further accompanied by the prioritization of an increase in population coverage.
This paper reveals a long-standing pattern in Turkish development, with specific importance accorded to the dichotomy of health vs. economic development; in analyzing this pattern, the following special characteristics become evident: (i) Turkey had a 50-year development period during which health fell behind economic achievements; (ii) the health dimension began to catch up with other dimensions of development in the post-1980s period, making further progress in the 1990s; (iii) the Turkish health system has created outputs that vary only minimally, reporting consistent but non-impressive growth rates every decade from 1960 onward; and (iv) the general process of Turkish development relates to continuity rather than to structural change. This final point becomes especially clear through analysis of the comparative framework inasmuch as contrasting Turkey’s performance with that of other developing countries shows that, on average, the other countries have exhibited much more uneven development patterns, especially in regard to health. This difference in continuity is especially pronounced in comparison with the pattern seen in China.
Overall, especially as compared to the Chinese case, my conclusion is that Turkish development in terms of independent health policy innovations that have had an aggregate effect on health outcomes can be characterized by a “following” rather than a “leading” pattern. Additionally, I also find that Turkey represents an average success story among developing countries, being moderately successful in both economic and health development over the period studied (1960–2010), with no clear globally exceptional growth in either of the dimensions—which is quite unlike the case of China.
Two characteristics define Turkish health-economy development in the 1960–2010 period: (i) a lack of serious medium- or long-term downturns in health or economic development; and (ii) the impression of disjointed health and economic development, as there is no evidence to support the existence of a strong correlation in the growth rates of these two dimensions over any significant medium- or long-term period in Turkish history. The importance of these results will be discussed in the final section, as they relate to both global and Turkish development.
Introduction to the measurement, relation, and differentiation of health and economic development
In recent development studies, one of the most important innovations has been Amartya Sen’s multidimensional and interactional approach to development, which treats overall economic welfare as a process jointly determined by the independent dimensions of social, health, economic, and political development.Footnote 19
One of the main debates relating to the analysis of development concerns the most appropriate method of measuring and standardizing the comparative development of countries. Accurately measuring achievements in development is critical for an understanding of their relative achievements as well as of aspects of development that are yet to be accomplished. Consequently, the use of long-run data is becoming increasingly popular, both for answering questions concerning Turkish economic and industrial developmentFootnote 20 and for analyzing interesting new health development work in developing country geographies.Footnote 21 Development measures calculated in this fashion are crucial for achieving the goal of tracking development in a satisfactory manner.
When measuring the evolution of long-run health capacity and health achievement, it is important to remember that health-related output variables generally remain quite stable over time. Consequently, quite large and sustained macro-level changes in the health system dimension, as well as in other dimensions, are required in order to create significant shifts in the health output. Even with such changes, the aggregated and macro nature of the most regularly used health variables necessitates the tracking of long-run averages (ranging from decadal to bicentennial) in order to truly understand occurrences in the health variable dimension.
In the health development dimension, the crucial concepts that have become a matter of concern in the recent literature on economic development are represented by the variables of life extent and life quality. In previous literature, these measures, which are related to life improvements classified as human development, have mainly been measured by improvements in life expectancy and quality and decreases in related mortality rates. In this paper, however, the main measure of life extent and life quality that will be focused on is the simplest variable; namely, adult life expectancy at birth (which is also the focus of the globally collected Human Development Index measure). This measure will allow me to collect, conceptualize, and compare achievements in the area of life development both over long periods of time and for the largest possible set of countries. Another important advantage of this measure is that it is a composite variable that collects information concerning the mortality risks that citizens of a given country face at different ages, thus capturing the aggregate effect of all health risks and the effectiveness with which the health system addresses these risks over the life cycle of a single individual.
Of human development variables, life expectancy and life improvements were shown by Sen to be independently important for sustainable long-run development, and also to be independently determined by a combination of different social, political, and economic parameters.Footnote 22 In this context, it becomes especially important to investigate the trajectory of human development by using life expectancy tables and changes in the life expectancy dimension. Life expectancy instruments, by focusing on crucial variables relating to health development, allow a broader point to be made concerning the characteristics of, and differences in, the long-run development paths taken by different countries in regard both to the crucial dimension of human development and to the health capacity that is necessary to make this development sustainable.
Another important question that has arisen from research relating to sustainable human development concerns the degree of correlation and causation between the dimensions of health development and economic development. Starting from the extreme position that changes in the economic dimension directly cause or create opportunities for health development,Footnote 23 the economic literature in the field has since evolved to a more nuanced position, with many varying explanations being provided in an attempt to pinpoint the exact contours of the health-wealth relationship. Although the relationship between economic and health developments has been shown to exist in both microFootnote 24 and macro dimensions, there is also a growing interest in showing the non-linearityFootnote 25 and complexity of the relationship,Footnote 26 as well as the potential for certain other crucial variables—such as at the societal and political levelFootnote 27 —to influence the extent to which economic variables and development levels can in turn influence a given country’s health equilibrium.Footnote 28
In this study, a more concentrated effort to relate the dimensions of health and economic development has been undertaken via the application of the Preston CurveFootnote 29 , which has been found to be indicative of global development in the dual dimensions of aggregate health and the aggregate economy. In order to understand the meaning of this curve in regard to Turkish health development, we must ask fundamental questions concerning the collective movement of the countries in question, owing to the fact that such factors cause shifts in the entire curve. A general upward trend represents an improving level of technological development within the health field, which allows the health levels of the countries to increase independently of economic levels. Illustrating this, Figure 1 shows the movement of the Preston Curve for the world distribution of countries from 1960 to 2010.
Preston Curves for 1960 and 2010
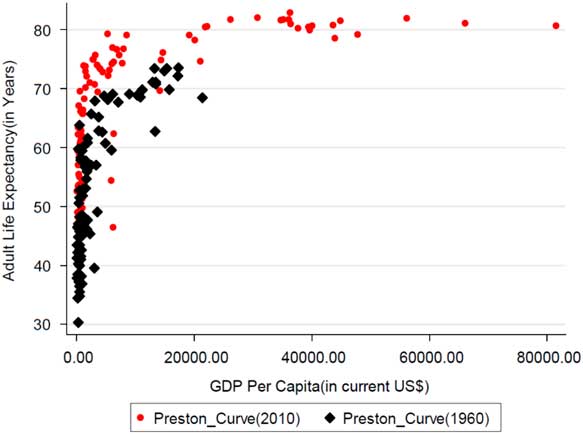
The overall curve allows us to compare the scale of all achievements in health over time to achievements in the economic dimension of development, which is measured by the overall production (per capita) level. The global effects of development on the dimensions of health and economy can be seen in the increases in global means represented in Table A1-1 in Appendix 1. Following an initial examination of the aggregate data for health and wealth, this study will proceed to focus on the differing time-linear progression of the specific countries of analysis—i.e., China and Turkey—within the Preston Curve. The initial position of these two countries on the curve represents the respective positions of these countries in 1960 in terms of the health-economy continuum (see Figure 2). From this graph, it can be seen that both countries began their development periods as relatively poor and unhealthy nations. The main difference between them is that China was more successful in terms of health relative to both Turkey and the average country’s performance, while Turkey was accordingly less successful as compared to both China and the average country’s performance.Footnote 30
Relative Positions of Turkey and China on the Preston Curve (1960-2010)
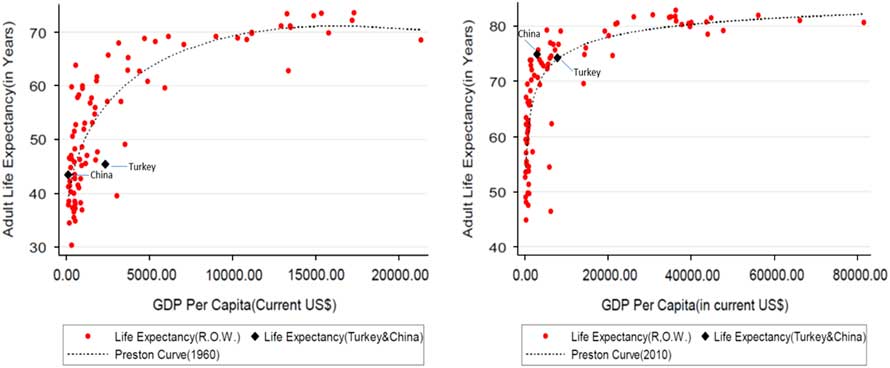
The dynamic movement of Turkey along the general Preston Curve tells a different and more individually influenced story, one that can be traced by comparing the relative positions of China and Turkey in Figure 2. Turkey’s changing position on the curve suggests that there was a bidirectional increase in both health and economic values in the country during the second half of the 20th century, a change that happened concurrently with global increases in the values of these indices. However, as the second half of the 20th century marks the highest and most consistent period of success for the largest group of developing countries (see Figure 1), this picture does not show clearly how Turkey’s health system improved in comparison to countries with similar economic development, health development, and state capacity.Footnote 31 However, a glance at Figure 2—which illustrates a survey and evaluationFootnote 32 of the relative positions of China and Turkey—shows that, although the relatively high performance of China in the health dimension remains constant compared to both Turkey and the average from 1960 to 2010, Turkey’s relative performance in the health dimension as compared to the world average suggests that, during the same period, Turkey managed to alleviate at least some of its lag in this regard. It should also be noted that, at the final period of analysis, Turkey is situated right on the Preston Curve, whereas in 1960 it was underneath it, which suggests a comparatively better relative performance in health as compared to the economy over the same period. Of course, Turkey’s final position on the curve also suggests that the previous five decades can be mainly characterized by its attempting to catch up to the world in terms of health, as opposed to moving ahead, innovating, and overtaking the global leaders.
Despite the above findings, analysis that relies solely on data from the Preston Curve is limited for two reasons. Firstly, although a cursory examination of the curve might suggest a certain positive co-movement between the dimensions,Footnote 33 it is just as likely that both of the dimensions of health and economy increased completely independently of one another. Secondly, the general upward movement in the entire curve for the period between 1960 and 2010 might be interpreted as an independent effect that greatly influenced the health dimension but did not affect the economic dimension. Sen offered an explanation for this independent movement of the health dimension, postulating that the results of the curve are driven mainly by support-related mechanisms rather than growth-mediated processes.Footnote 34 In essence, one of the goals of this paper is to differentiate these two processes in terms of their importance for understanding the history of the Chinese and Turkish health systems.
Considering the most macro representation of economic development, which is only weakly and non-linearly related to health development, it proves difficult to differentiate individual country narratives in terms of economic development and health development. As a result, in order to situate Turkish development in its appropriate historical and geographical context, this study will compare the development of China and Turkey in regard to these same dimensions, coupling this with an analysis that compares and contrasts Turkish development with two different sets of comparator countries. One of these sets is composed of countries that shared the same level of health development as Turkey at the beginning of the different periods in question, whereas the other set is made up of countries that were at the same level of economic development as Turkey.
The main contribution of the paper will be the provision of a multidimensional, long-term perspective. This approach shows the value of using a large dataset of countries over a long period of time in order to obtain information concerning countries’ health and income development. Conducting the analysis using the simplest dimensions of health and economics creates a comparative balance sheet with which to evaluate how countries have fared over the last 50 years, which was the most successful era of development for the majority of the countries analyzed. Furthermore, it should be noted that these countries were classified under the “developing” label during at least some, if not all, of the periods covered by this dataset. One of the main advantages of the approach taken in this study is that it provides a unique and novel periodization for the development of the public health system and of infrastructure and structural change in Turkey.
Dividing the analysis into an outcome evaluation and a system evaluation, the result is a bifurcated paper that fulfills two purposes. Firstly, it creates a narrative of the structural changes in Turkey’s health system and compares this with structural changes in China’s health sector. Secondly, the paper also analyzes changes in the social and economic dimensions of Turkey’s and China’s development, situating their individual development on the Preston Curve that reflects the overall global picture.
In this context, and in regard to the important discussion relating to the health outcome dimension, the Turkish figures show a continuity that is almost unparalleled within the large developed and developing countries dataset, which makes Turkish health development unique in regard to its long-run development pattern. In stark contrast to this, the Chinese health system shows significant discontinuity,Footnote 35 with considerable—and in fact higher than the global average—health progress achieved completely independently of the economic dimension during the pre-1980 period, followed by considerable economic progress achieved independently of the health dimension during the post-1980 periodFootnote 36 . This difference of experience makes questions relating to support-led health development vs. growth-mediated health development much more pertinent. One point of contention raised by this paper’s findings is that both China’s and Turkey’s development paths in terms of health represent an example of support-led development, but the fundamental drivers and limiters of support-led development differ for the two countries, as they generated the most success in different decades.
This mode of research also provides an opportunity to connect the existing literature on public health in Turkey to the literature summarizing Turkey’s pattern of development in other dimensions,Footnote 37 to the global empirical literature on the health-wealth development relationship,Footnote 38 and to the regularly discussed and cited literature on China’s development challenges and achievements.Footnote 39
Continuities and discontinuities in the health system and the health-economy relationship in the planned economy period (1960–1980)
The crucial dimensions of health development for Turkey and China
In this section, in line with the paper’s research methodology and in order to track Turkey’s and China’s trajectory across different dimensions while still applying the greatest possible amount of information concerning the aggregate health characteristics of the population, I will initially use the life expectancy variable. This is because, since this represents an overview-style variable, life expectancy is reliable and does not differently evaluate the health achievements of different age groups in the population, which gives this variable an advantage over other measures of mortality and life quality that are equally regularly applied.Footnote 40 This, in fact, is one of the main reasons life expectancy is often applied in long-term cross-country comparisons.Footnote 41 (See Figure 3 for the development of life expectancy during these periods.)
Life Expectancy Achievements of Turkey and China (1960–2010)

Furthermore, this project is also indebted to the newly recognized importance of the use and analysis of long-term data. In order to confirm the advantages of using long-term data to analyze the long-term development patterns of different dimensions and to compare countries’ development paths, this study uses the health development of two large countries—namely, China and Turkey—as a test case. Through this analysis, the periodization and the geographical comparisons applied will allow different variables that influence the health equilibriums of the societies in question to be simultaneously controlled using time and fixed-factor effects.
This comparison of countries that faced similar health challenges and constraints over similar periods of time, while also differentiating in regard to their respective achievements, allows for the control of the specific effects of changing health technology and health knowledge and information. This is because, among countries with similar levels of health development, developments in universal knowledge and technology are expected to create similar opportunities for the countries in question to improve health outcomes, and controlling for this effect in turn results in a clearer investigation of the other determinants of the health system,Footnote 42 as well as of the society-wide factors that influence health equilibrium in the aggregate.
The performance of a given country’s health sector and the characteristics and condition of its public health system are driven by parameters other than its economic structure, and these health-specific parameters must be examined in order to understand the independent dimension of health development. Analysis of the social, political, and economic correlates of health development forms the basis of an important new literature, one that has now become still more relevant as a result of Sen’s seminal contribution.Footnote 43 In this new literature, the state’s health capacity, the social and economic dimensions relating to inequality, the social and economic dimensions relating to poverty, and the generalized dimension of economic development are all widely accepted as being the crucial determinants of the aggregate health equilibrium in a society. Within this general conceptualization, such work joins a growing amount of literature that focuses on the effects of marketization and market reforms on both the broader spheres of development and on the specific dimension of health development.
The findings of this new strand of literature also contribute to one of the most frequently mentioned development-related discussions on the topic of the relationship between health and wealth. Specifically, the new literature emphasizes how this relationship is not as simple as it seems, with the variety of institutional health “development” that has paved the way for long-run economic development and growth, not to mention the scale of the economic development in question, also being crucial. The present paper constitutes a new examination of the relationship between economic, social, and health development: it situates the Turkish case of historical development vis-à-vis Chinese development within this three-dimensional relationship, and furthermore situates both of these countries’ experiences within the broader historical context of global development.
As has already been discussed, in developing countries the creation of truly national health systems generally began in the second half of the 20th century. As Sen and Jean Dreze have emphasized,Footnote 44 this creation of health systems occurred in conjunction with the health delivery and health provision developments advanced by countries via a complex set of political and economic breakthroughs. This paper will chart the effects of the known policy breakthroughs on the important health output variables over a 50-year development schedule, attempting to determine which policy breakthroughs have been effective in creating true and lasting effects on countries’ development of health outcomes and health systems.
In order to chart and discuss health delivery systems, what is required is a matrix of dimensionsFootnote 45 with which to evaluate the changes that occurred in the different dimensions of the health systems in question. In the literature that includes the primary health outputs (i.e., mortality and life expectancy), the main indicators plotted by health economists relate to population coverage, access, provision, and expenditure, which are applied in order to understand and compare the effectiveness of health systems.Footnote 46 Initially, to compare both Turkey and China, an all-encompassing comparative framework will be established for the most basic health outputs and health expenditure items, and this will then be applied to these countries, as well as to their developing country counterparts.
However, especially for the post-1980 period,Footnote 47 I will also focus on the primary dimensions of changes in health-system coverage that have been regularly used in analysis of universal coverage dimensionality. The main dimensions focused on will be: (i) change in the populations served by the health system;Footnote 48 (ii) change in the scope and range of treatments offered by the health system; and (iii) change in the proportion of costs covered by public sources in the public system. All primary reform movements, for the health reforms of both China and Turkey, will be charted to this matrix. If we consider the effects of the health reforms and/or institutional changes implemented in both Turkey and China during the overall period of 1960–2010, there is a general movement toward increased universality, with the only exception being the shift toward market capitalism that occurred in China with the 1978 reforms that abolished the rural health system and involved significant decreases in the first and third dimensionsFootnote 49 of coverage,Footnote 50 which in turn drastically slowed the movement toward universality.
Using the parameters utilized by previous health-related literature for the classification of different health systems,Footnote 51 Turkey’s development process in terms of its health systems and health values can be partitioned into two general periods that share similar structural parameters, with the first period stretching approximately from 1960 to 1980 and the second from 1980 to 2010. China shares a similar periodization, but the main difference is that at the level of the macro dimensions of health achievement, the Turkish process shows greater continuity both between and within these two periods.
The first period, from 1960 to 1980, was when the modern Turkish health system emerged from its earlier dual, primitive, and highly unequal system. The dual system provided continuous urban and private health care coupled with a discontinuous, campaign-oriented, protectionistFootnote 52 health system that aimed to control rural and urban epidemics whenever they became fully fledged.Footnote 53 During this period, this dual system slowly and haltinglyFootnote 54 moved toward becoming an integrated health system,Footnote 55 with a fixed infrastructure investment all across the country and a more equal geographical distribution of health workers and hospitals.Footnote 56 In 1961, the Socialization Law (No. 224) was passed in an attempt to create a rural/peripheral counterpart for the urban center-oriented public health system,Footnote 57 this law stipulated the creation of a peripheral health workforce equipped with the technology and infrastructure necessary to meet the demands and needs of the rural population, at least in regard to the primary level of healthcare. This focus on bolstering the health condition of the rural population was critical because at the time the majority of the population lived in rural areas.Footnote 58 The same was also true of China, where changing rural health outcomes was of fundamental importance for improving national health and solving the existing health inequalities in the countryFootnote 59 and was thus a conscious priority in post-1960 health reforms.
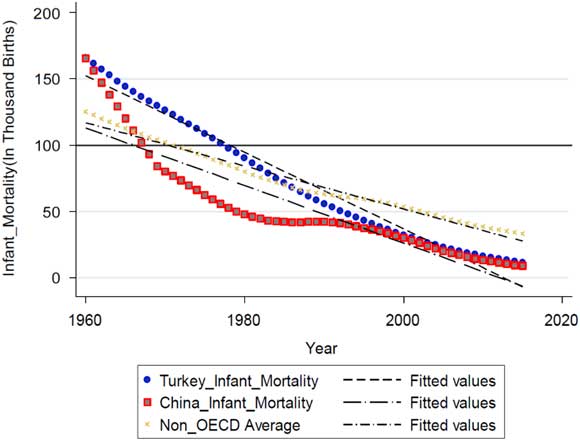
In the 1980–2000 period, Turkey crossed another threshold in moving toward a universalized system, producing a health infrastructure that covered the entire country and fully integrating the protective first-stage health system. In a related vein, a national initiative—implemented on an unprecedented scale—was undertaken to immunize children in the general population against the most common early-age diseases.Footnote 60 The effectiveness of this preventative national initiative in limiting the scale and pace of epidemics is quite clear, and can be observed in the vaccination level for DPT (diphtheria, tetanus and pertussis) seen in Figure 4 below, while Figure 5 shows the initiative’s effect at the output level.
Immunization Changes for DPT (Turkey, China and OECD Average)

Infant Mortality Achievements of Turkey and China (1960–2010)
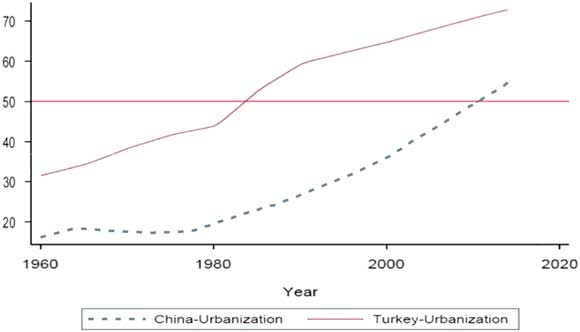
In regard to the social dimension, the early 1980s in particular witnessed a massive increase in the growth rate of the urban population, with, for the first time in Turkish history, the majority of the population living in urban areas. A similar social and economic change occurred in China, with increased urbanization and marketization, although, as will be discussed below, the rates and directions of the changes implemented in some of the health indices were significantly different than those found in the Turkish system.
The most recent period of study, from 2000 to 2010, witnessed a significant transformation in the parameters of the national health system in connection with the marketization, coverage, and utilization of the health service.Footnote 61 Consequently, an increased level of health expenditure, health access, and healthcare use became new and quickly well-established characteristics of the system. As the cumulative effect of the changes made over all the time periods in question began to make itself felt, the causes of the majority of deaths shifted from infectious to non-contractible diseases,Footnote 62 and accordingly the main challenges facing the health system changed. During this period, between 65 and 75 percent of the population lived in urban areas, with the majority of the health supply and demand being created and met in these areas.
In this latest period, certain measures of the inputs and outputs of Turkey’s health system converged for the first time with the Organisation for Economic Co-operation and Development (OECD) average, with the averages of these variables first equaling and then overtaking the values for the countries on the lowest rungs of the OECD ranking.Footnote 63 In the following two sections, I will situate this history of health achievements in its proper context, considering the development of comparable countries (mostly outside the OECD set of countries) and country sets in terms of the relevant health inputs, health organization and coverage, and health output indices, whenever the data permits.
The initial bidecadal period of health development in Turkish and Chinese history (1960–1980)
The 1960–1980 period was a critical period of investment, development, and outlay for both the Chinese and Turkish health systems, a time when both countries began transitioning from a more partitioned, unequal, underinvested, and underresourced state to more national, equal, and specialized treatment- and population-based health systems. This section will not only focus on the set of reforms and initiatives that started these modernization initiatives, but also examine to what extent these reforms and systemic characteristics truly changed the underlying health outcomes and health outputs, as measured at the level of national health aggregates.
The 1960s: The genesis of a new public health approach
At the beginning of their development processes, both Turkey and China were developing countries defined by unidimensional health institutions and policies that were positioned to control disease levels during important epidemics, a practice entirely in conformance with most health systems in developing countries. Such a priority is understandable since most morbidity and mortality in the Turkish and Chinese populations at the beginning of this period were caused by communicable diseases;Footnote 64 consequently, the state, the health infrastructure, and health policies aggressively targeted disease at this level. As a direct result of this unidimensional policy, the focus of health efforts in China and Turkey vacillated between rural and urban areas depending on which disease was being targeted at the time. For instance, tuberculosis (a largely urban disease) necessitated a primarily urban approach and urban investment, whereas when the targeted disease was malaria (which is largely rural), the majority of investment and emphasis were placed on rural areas and populations. Thus, the rural-to-urban health investment ratio and the direction of the emphasis of the public health system were determined by the nature of the targeted disease and not by the state.Footnote 65
For both China and Turkey, the 1960s were defined by a significant shift in health policyFootnote 66 and a significant structural break in terms of health development, which is especially visible and significant when considering the national data (as seen in Figures 3 and 4) as well as the global health ranking for China.Footnote 67 For instance, the practice of targeting a single disease came to be replaced by a multidimensional approach that targeted healthy as well as sick populations. In addition to this primary innovation, which was implemented in Turkey particularly, both countries turned toward more planning-based, proactive approaches in regard to the economy,Footnote 68 coupling this with similar measures in the dimension of health institutions and placing great emphasis on health-conscious, primary care-based health care that targeted population-level health outcomes and health-deprived populations,Footnote 69 as well as geographies themselves.Footnote 70
The targeting of the healthy population also led both countries’ rural areas—which were home to a significant proportion of the population and featured lower health values and higher rates of mortality and communicable disease—to become important arenas for increased health expenditure, health investment, and health targeting; one notable example from China of such targeting was the Four Pests Campaign, named after the aggressive targeting of disease vectors that affected primarily rural populations. Viewed in this light, China’s “rural cooperative medical system” (implemented continually in the period between 1960 and 1978Footnote 71 ) and the associated “barefoot doctors’ program” (innovated and implemented from 1968 to 1978Footnote 72 ), as well as Turkey’s “socialization program” (begun in 1961 and reaching a national level in 1983Footnote 73 ) represented a radical rural-based reorientation of health policy and health planning in the developing country health landscape. The main contribution of this movement was that these two countries gained an advantageFootnote 74 over the majority of their neighbors in the developing country group (as seen in Figures 3 and 4), which in the 1970s began to follow a similar primary care-oriented, deprivations-based path.Footnote 75
In the health values and mortality figures of the 1960s, there is a pronounced improvement in both countries, though the Chinese improvement is much more significant and becomes even more striking when examined from a world-historical perspective. For instance, although in the 1960s Turkey’s life expectancy rate increased to achieve its highest rate ever as compared to preceding and succeeding decades, Chinese performance in the 1960s was the most impressive health performance in a “global” sense, as is revealed when the country’s improvement is compared to the development of all 88 countries across all five decades of data. The appropriateness and efficiency of the Chinese health investment is evidenced by the fact that the country’s infant mortality rate decrease was the fourth highest among all countries in the 1960s, as well as being the second highest in Chinese history. On the other hand, the Turkish improvement in life expectancy was not coupled with a higher-than-average performance of the overall health system, as is revealed when achievements in infant mortality are also included in the overall measure for health achievement; for Turkey, the decrease in infant mortality, in terms of absolute value, was actually most pronounced between 1960 and 1970. Inasmuch as infant mortality represents a measure of the modernization and homogenization of the health system, it appears that China achieved much better improvements in life expectancy than Turkey via its modernization and increased homogenization, whereas Turkey achieved improvements in its total development values (i.e., life expectancy and GDP) without actually modernizing and homogenizing its health service sector,Footnote 76 which can be assumed to limit the long-term sustainability of the health development in question.
In order to compare health development in Turkey and China with general world development in this regard, I make use of the clustering methodology, which can capture the manner in which the clusters that include China and Turkey changed over the 1960–2010 period. This approach allows for an examination of the general picture presented by the Preston Curve and for a specific consideration of countries similar to Turkey and China in terms of global health and macroeconomic measures. An advantage of using the long-run approach is that it allows for the formation of a group whose development is comparable to that of Turkey and China, which can be achieved by using and clustering the long-run cross-country sample. Additionally, the same methodology can also be used to identify periods of particular success and convergence in regard to Turkish and Chinese development.
In the following part of the analysis, I will ask whether successful periods of economic development intersect with successful periods of health development, and also whether countries with the same level of health development share similar economic characteristics; in other words, I will investigate whether the dimension of health development is truly independent of the dimension of economic development. Similarly, the relative independence of the health development of Turkey and China will be investigated via the overall developing country dataset in order to be able to understand the extent to which the same characteristics of development hold true for other, similar countries. In order to achieve these aims, I have applied a clusteringFootnote 77 in regard to the global health values for the time period in question, as well as an independent clustering approach in regard to the global economic values. The results for the health values, disaggregated for the decades, are presented in Table A1-2, together with the income per capita values for the same set of countries in Table A1-3.
When applying this clustering approach to the health data from the 1960s, the health cluster of Turkey and China can be identified as a single set, with a majority of the countries around the world located at a higher position in the world distribution. It is therefore clear that the health development characteristics of the reforms of the 1960s pushed China into a position as a forerunner, advancing its health variables in a period when its economic variables were stagnating, whereas Turkey experienced a much more controlled improvement in both the health and economy dimensions.
The 1970s: Two countries in interregnum
In the 1970s, the modernization of Chinese health proceeded with priorities similar to those of the previous decade, with lower infant mortality rates illustrating the main achievements in regard to the development of life expectancy; this is especially notable given that the country still had a comparatively low GDP per capita, situated in the lowest 5 percent of global GDP per capita distribution (for the relative position of the Chinese to the Turkish economy, see Figure 3).Footnote 78 Turkey’s development, meanwhile, proceeded in a more lackluster manner: it went on transforming its health system by increasing its rural orientation and continuing to target healthy members of the population, as well as by increasing the number of protective health measures conducted, which were generally supported by large-scale vaccination programs.Footnote 79 In this regard, it is important to remember that, until the beginning of the 1980s, the majority of the Turkish population lived in rural areas, as can be seen in Figure 6, and also that the Chinese urban population did not gain parity with its rural population until the middle of the 2000–2010 period. The main problem for both countries was that the health system that was tasked with achieving this transformation had not yet reached national scale,Footnote 80 and as a result there were great differences between different provinces, as well as between rural and urban areas, in terms of medical insurance coverage, health technology, health expenditure, and modes of treatment.Footnote 81 In Turkey, coverage-related problems remained serious, for rural areas especially but also in aggregate. China, however, was much more successful in this sense: by the time of the 1978 cutoff, when the health and economic system began to undergo complete transformation, the country had nearly closed the coverage gap between urban and rural areas, and its total coverage was close to the OECD level of coverage, as can be seen in Figure 7.Footnote 82 Additionally, China had also begun by this time to provide basic curative and preventative healthcare services to the massive Chinese population at low cost.Footnote 83 For Turkey, these values, along with the low level of public investment in health as compared to the OECD average, suggest that even though China’s and Turkey’s pre-reform public health initiatives may indeed have been moving in the same direction, the inputs and state commitment applied by China so as to address the problem were far more substantial and, consequently, achieved considerably more success.
Urbanization Rate (%) for Turkey and China* * The 50-percent horizontal line represents the threshold where the majority of national population lives in cities.
Health Insurance Coverage as a Percentage of Population

When we compare the health development in Turkey and China with general development around the world—a comparison made possible through an application of the advantages of the clustering methodology—we observe that both Turkey and China began the 1960–1980 period in the same health-related class; the other members of Turkey’s initial and ultimate classes can be seen in Table A1-2. They were also both in a similar economic situation. In regard to health values, they both belonged to Class 2, whose characteristics are shown in Table A1-2, while in terms of economic values, China belonged to Class 1 and Turkey to Class 2, with these characteristics being shown in Table A1-3. As a result, both countries essentially faced the same kinds of health challenges and had at hand similar fiscal means with which to address these challenges. The end of the period in question sees China, through the unique and independent growth it achieved in the health dimension, join countries with a much higher level of socioeconomic development. By the same point, Turkey had joined the middle of the distribution and possessed health and economic achievements similar to those of other countries in the same income bracket, but with lower health values than its competitors in this regard. In sum, during the 1960–1980 period, although China and Turkey experienced no change in their income groups, China moved to Class 4 (with the upgrade occurring primarily due to a radical shift in the 1960s), while Turkey experienced a more modest upgrade that brought it into Class 3 (with the upgrade, again, occurring mainly in the 1960s). It is noteworthy that, for both countries, their critical period of health improvement occurred without any noticeable improvement in economic outcomes, a fact that backs up the theory that support-led health development was implemented in both countries. The problem of coordinating, as well as committing to, a national policy with a definite direction—a problem that was in fact a common issue for global economies in the 1970sFootnote 84 —may also have constituted a significant limitation for Turkey in connection with its attempts to revamp its health policies and health systems.
Continuities and discontinuities in the health system and health-economy relationship in the age of structural adjustment (1980–2010)
The 1980s: Two sides of the same coin? Similar and differing effects of the marketization processes
This section will begin by broadly differentiating the relevant periods of health development: the main difference between the pre- and post-1980s for the Turkey-China comparison is that, following the rate of nationwide reforms conducted during the 1980s, the rate of the health system’s completion and of coverage increase, as well as the fight against health inequality, became (unlike the pre-1980s situation) biased in favor of Turkey, with the possible exception of the post-2000 period.Footnote 85
The predilection of both countries’ health systems to ameliorate the existing level of regional, economic, and urban-rural inequalities strengthened in the post-1980s era. For Turkey, this occurred particularly in the 1990s, whereas for China the process was intermittent and only truly gained momentum at the end of the first decade of the 2000s through the adoption of a back-to-basics approach to combatting rural-urban inequality.
In the 1980s, both countries experienced a similar period of liberalization/marketization in regard to their macroeconomic parameters, as well as a greater external orientation of their overall economies;Footnote 86 this process, however, produced differing consequences in regard to the countries’ health dimensions. For China in particular, this period represented a complete departureFootnote 87 from the health-economic development mixFootnote 88 that it had already chosen and committed to in the pre-1980s period.Footnote 89
The new health-economic development mix that China had selected was much more heavily weighted toward urban economic and health development,Footnote 90 and it also involved a combination of a huge drop in the coverage of publicly available health insurance schemes (a measure that had a great impact on rural health parameters),Footnote 91 the creation of new health inequalities,Footnote 92 and a mix of health policiesFootnote 93 that significantly impeded sustainable health development, as evidenced by the fact that this period saw the smallest decrease in infant mortality among all the decades under study. This decrease was also, in terms of absolute value, quite small compared to that of countries at similar levels of economic and health development.Footnote 94 One potential explanation for the fact that such a sudden and significant policy reversal at the level of health institutions did not lead to a health disaster at the level of outputFootnote 95 is that the quite historic (both for China and globally) level of increase in the country’s economic development buttressed the private funds allocated to health at a time when public funds and services were hitting historic lows; see Figure 7 for the extent of the drop in social insurance coverage.
Turkey’s development followed a different path for two reasons. First, at the beginning of the 1980s, although the liberalization/marketization process was implemented in other sectors, the health system went largely untouched.Footnote 96 The Socialization Law remained in force—at least in terms of defining the macro parameters of the health systemFootnote 97 —and consequently, during this period the health system was able to substantially increase its insurance coverage of the population (see Figure 8) and, due to its highly heterogeneous quality, was also able to continue its progress toward achieving national coverage. The Socialization Law’s bias toward prioritizing protective medicine, along with the medical infrastructure that had been built across the country during the 1960–1980 period, meant that any new vaccination drive increased the proportion of the Turkish population that was covered and protected against first-stage epidemic diseases. Thus, for the first time, the preventative arm of the Turkish health system was able to provide preventative medicine to the majority of the Turkish population (see Figure 4).
Insurance Coverage as a Percentage of Population (without China)

The second reason for the increase in coverage during this period was that Turkey’s now more urbanized society was able to improve access to the health system via an expansion of its social insurance system.Footnote 98 Certain limitations did, however, exist in relation to this coverage development, and two points must be made in this regard. First, even with a significant increase in rates of access to the healthcare system—the highest, in fact, in the OECD dataset—the official overall social coverage rates of Turkey’s public health and insurance systems nevertheless remained well below those of all other OECD countries (with the exception of the United States, which differs from all other countries due to the low priority given to “social” protection there). And second, this coverage was highly unequal and heterogeneous in quality, as it was subject to differences from city to city and region to region, as well as among different levels of employment,Footnote 99 both at the level of access and at the level of service (though this latter is unfortunately not as measurable).
However, although the health system change in Turkey was not momentous and the high levels of inequality in the Turkish healthcare system in the rural/urban, regional, and income dimensions remained largely unchanged, Turkey’s health achievements in relation to both the infant mortality and life expectancy dimensions did manage to surpass China’s achievements in this regard. There is, though, a caveat, as this was based more on the significant slowdown in Chinese healthcare output rather than on the Turkish system’s own acceleration, as evidenced by the fact that Turkey’s improvements were surpassed by many other countries during the same period. Furthermore, clustering analysis suggests that Turkey’s position relative to its health neighbors stayed constant, which shows that the country’s health output grew at a level that was only slightly higher than the average level for developing countries.
The 1990s: The genesis of a new public health approach
The 1990s was a period of strengthening and reform in Turkey’s public health,Footnote 100 with the ongoing national project initiated by the nationalized public health system coming to fruition, vaccination rates reaching over 80 percent for the majority of targeted diseases, and similarly satisfactory achievements in mortality ratios. In China, the 1990s were a period of government-driven stabilization and featured an ongoing effort to raise health development to a level that would match the burgeoning economic development. However, although the decrease in mortality was greater than it had been in the 1980s, the decade also saw increases in the divergence between rural and urban health values,Footnote 101 in inequality among social groups,Footnote 102 and in limitations to the rural provision of health servicesFootnote 103 and rural access to health institutions,Footnote 104 all of which had a dampening effect on life expectancy and healthy population values.
The changes that occurred in the Turkish health system can be described by two main features. First, the state increased its involvement in the funding side of the health equation (see Figure 9), such that it became at least comparable to the other countries in Turkey’s health and wealth neigborhood, although significant gaps still remained with regard to the OECD average, as can be understood from Figure 9. And second, Turkey was able to extend its social insurance umbrella so as to cover both the unemployed and the rural employed.Footnote 105 The health development path for this decade would be determined by whether the increases in expenditures, inputs, and organization on the supply side would be able to meet the greater demand on health that was emerging as a result of the greater access to health care that the state had begun to provide.
Total Health Expenditure (government expenditure on health + out-of-pocket expenditure) Profiles of Turkey and the Rest of World (1970–2010) *The average is for countries who are founding members of the OECD, not including Turkey.

As compared to the Chinese case, the Turkish healthcare system’s main direction again was different both in the macro dimensions (where it was improving rather than dormant), and in the critical micro dimension of health inequality. The reasons for the Turkish upgrade in health values and health system output during this period—which in the macroeconomy was associated with stagnation and recurring financial crises—appear to be fivefold: (1) increase in state funds allocated to social expenditure,Footnote 106 (2) increase in the focus on combatting longstanding inequalities in the health system via expansion of the coverage of the social insurance regime, (3) increased coverage toward the urban and rural poorFootnote 107 as well as toward underserved areas of the country, (4) a build-up in terms of hospitals and doctorsFootnote 108 (see Figures 10 and 11), and (5) a continuing reorganization of the health workforce that sent a greater number of younger doctors into underserved areas of the health system, especially in the first half of the 1990s.Footnote 109
Hospital Bed Numbers per 1,000 population (1980–2013)

Physician Per Population Ratios for Turkey, China and OECD Average (1990–2013)

As Figure 12 shows, these noticeable improvements and changes in the health system in the direction of both more homogenous public coverage and of greater service provided to underserved parts of the Turkish health system meant that health inequality values—as measured by infant mortality differences between individuals and households with different regional, gender, income, and rural/urban characteristics—initially began to concurrently decrease in the different dimensions for the Turkish health system. Figure 12, for instance, shows that, in the majority of the inequality dimensions, 1998 represents the lowest values measured for the post-1980 period. This movement toward decreased health inequalities in the different dimensions was very different than the direction witnessed in the majority of the world’s developing countries in the 1980s and 1990s,Footnote 110 and it can be conjectured that the different path Turkey was taking in the inequalities dimension, as seen in Figure 12, was also partially fueling their higher than average rate of improvement in mortality values.
Health Inequality Graphs in the Different Dimensions

What seems to be clear is that, under its chosen financing and coverage scheme, the Turkish state did not choose to prolong these important health gains, and this led indefinitely to higher health costs within its public budget. As the government brought the increased level of public health expenditure under control (as evidenced by Figures 9 and 13), this meant that the coverage newly provided to a new part of the population would not be sustainable (see Figure 13 for the sustainability problem in regard to public funds), and, as a result, this public coverage window would either have to be closed or else be financed with hidden private funds. Moreover, the social security crisis decreased at least one part of the covered population’s quality and access to pharmaceutical products quite sharply.Footnote 111 All of this culminated in the fact that all those health inequalities that had initially subsided in the first half of the 1990s reached their minimum position in 1998, and then began an incline in the 1998–2003 period, as seen in Figure 12.
Increases in Public Health Expenditure for Turkey as a % of GDP

When the clustering methodology is used to compare the health development in Turkey and China with general world development, it is observed that, in the 1980–2000 period, the relative position of China in terms of health development remained stable, with the country remaining in Class 4; this, in turn, meant that other developing countries were able to equal its level of health development, with Turkey prominent among such countries. Here, special emphasis should also be placed on the 1990–2000 subperiod, when Turkey upgraded to Class 4 in terms of health development.
The 2000s: The final chapter of health and development
Turkey’s Health Transformation Program (Sağlıkta Dönüşüm Programı), which to a great extent determined the changes in the health system’s features in the first decade of the 21st century,Footnote 112 must be understood—partly as a result of this analysis—as a culmination of the opportunities and limitations that had characterized the Turkish healthcare system for the previous 40 years. The increases in coverage and health services (in terms of both prevention and treatment) that were offered by the system, along with the concurrent increase in available public health funds,Footnote 113 made a higher level of organization and management necessary to bring the Turkish healthcare system into the 21st century. On the other hand, the Green Card (Yeşil Kart) system’s incomplete integration into the protective umbrella also made the expansion of the system rather tenuous, with the system’s ability to provide homogenous and high-quality health service seeming increasingly in doubt.
Faced with these challenges and opportunities, Turkish state administrators made it a political priority to increase health services and health coverage (see Figure 15),Footnote 114 and as a result they were able to honor their commitment through the help of a high level of public infusion of funds into the system: as seen in Figure 14, the public share of total funds going into health expenditure grew during the 2000s,Footnote 115 with the increased infusion coming partly from the state’s greater ability to allocate more funds due to the fact that the economy was emerging from crisis. Accordingly, the coverage of the healthcare system continued to grow apace, as seen in Figure 15.
Share of Public Expenditures in Total Health Expenditures for China, Turkey and the 1st Group Countries Average*, 1995–2013 *The countries in the 1st Group are listed in Table A1-9.

Proportion of Total Population Covered by Social Insurance 1st and 2nd Group countries are listed in Table A1-9.

Seen from this perspective, the Turkish healthcare system shows more continuity than one is accustomed to, with the 1980s increase in preventative care creating the framework of the increase in preventative care capabilities of the 1990s, and the 1990s reform ideas and level of funds and coverage establishing the benchmark of the 2000s, with increased implementation, stronger government commitment, and, since the second half of the 1990s,Footnote 116 continuously expanding public expenditure establishing a consistent and growing pattern in the health system, thereby enabling it to achieve virtual parity with OECD countries in terms of infant mortality. Nonetheless, the costs of achieving these health goals have been remarkably high, largely because the Turkish system has been forced to leap many critical hurdles in the post-1980 economy, with the Turkish system in this period seeming to be characterized by much higher overhead costs and higher payments to technology. As a result, the level of life expectancy and infant mortality that Turkey has been able to reach for every dollar it has spent on health pales in comparison with not only China, but also Sri Lanka, Vietnam, and Thailand,Footnote 117 which are also Turkey’s health neighbors.Footnote 118
In terms of the dimension of health inequalities, although for the most part the inequality level has not returned to the level of the 1998 period, as seen in Figure 12, there were nevertheless significant decreases in inequalities for the 2008–2013 period. Here there is also significant continuity with the story of the 1990s. The 2008–2013 period is when the Green Card system led to a substantial increase in the coverage of the health system—with the coverage window expanding by some 3 million people between 2009 and 2013—in addition to delivering a higher quality of health care to the newly covered population as compared to the case in the 1990s. Figure 16 makes clear how this variety of increased coverage—i.e., that achieved through the Green Card system—can create convergence dynamics, as the figure shows that the majority of the new Green Card holders hail from areasFootnote 119 with lower aggregate health values (at the provincial level).
Role of Increased Coverage*** in Health Achievements (Turkey) at Province Level * β is the correlation coefficient between the two dimensions.** The plotted points represent the average life expectancy values for the 81 provinces of Turkey.*** In this period the increased coverage of the health system is achieved through new Green Card holders.

All these achievements at the macro level came at high cost, and the historical pattern of rural-urban and regional differences remained relatively unchanged.Footnote 120 Moreover, the fact that the level of health coverage reached by Turkey after 55 years of continuous health development was reached by China in just the period between 1960 and 1975 should make us reconsider the claims that Turkish health achievements in this decade were unprecedented. Turkey’s systemic ability to identify and target underserved areas especially, as well as to fashion large increases in health levels at a low level of cost, still seems to be lacking as compared to the Chinese case.
As a case in point, the Chinese achievements in regard to infant mortality figures improved impressively in the 2000s. In the area of policy, reorienting the health system toward rural areas,Footnote 121 along with an increased emphasis on rural values coupled with increased state participation and rural outreach efforts on the part of medical institutions,Footnote 122 yielded strong results, with an unprecedented decrease in the infant mortality rate that returned the country to the pre-1970 period of success in terms of this measure.Footnote 123 Post-1980s Turkey, on the other hand, may have experienced a steadily, though slowly, improving performance in terms of infant mortality, but this performance still trailed far behind that of China during the first decade of the 2000s, as tha latter country was ranked second in the world during this period. China’s infant mortality achievements are shown in the second column of Table A1-6 and in Figure 5, and the effects of these achievements on life expectancy can be seen in the final column of Table A1-6. Turkey’s performance in the pre- and post-1980 periods follows a steady path of relatively constrained achievements in health and the economy, whereas China follows a more see-saw pattern, with certain decades—namely, the final three under consideration here—characterized by world-leading economic performance, and with the start and the end of the periods of non-normal growth characterized by a world-leading health performance that coincides with the rural turn in Chinese health policy. The differences in the Turkish and Chinese patterns can be observed in Figures 3 and 5, with the Turkish performance’s steady character and the Chinese development’s more radical character being especially evident in Figure 5.
When we compare the picture of health development in Turkey and China with the general picture of world development using the clustering methodology (see Tables A1-2 and A1-3), we see that, during the 2000–2010 period, both China and Turkey matched the high development pace of developing countries, with China especially showing impressive development in this dimension owing to decreases in infant mortality (see Figure 5). During this period, China also placed new emphasis on combatting the health inequalities that had arisen between rural and urban areas in the post-1980 period. For Turkey, on the other hand, the pattern of health values trailing economic values continues: even in 2010, countries in the same income grouping as Turkey were located in a higher grouping in terms of health outcome (compare the second column of Table A1-7 with the second column of Table A1-8).
The utility of the convergence approach
When we apply a new statistical approachFootnote 124 for dividing the dataset into a set of endogenous groups with similar convergent characteristics over the long runFootnote 125 —which is done with the aim of identifying the convergence/divergence characteristics of all countries in the datasetFootnote 126 —we can establish a set of significant results for the whole of the dataset, and specifically for the Turkey-China subgroup focused on above.
Turkey is now included among the non-converging country dataset subsample, which is located between a convergent group with higher long-term health and wealth values and another convergent group with long-term health and wealth values below those of Turkey. In terms of health values, Turkey belongs to the group that has the highest aggregate health values among developing countries that have been developing on their own separate paths over the last 60 years; the other countries in this group can be seen in Table A1-9. These countries do not share or converge toward the privileged growth that pairs economic development with health development. For the countries situated in the highest convergence class of health, which also constitute the highest one-fifth of the world’s wealth distribution (as can be seen in Table A1-9), “the wealthier is healthier” hypothesis appears to be confirmed.Footnote 127
The main result reached by this convergence analysis analyzing the last 50 years of global data is that development toward a common level is observed only within convergence groups. This means that, in the case of middle- and high-income countries, the subsets do not seem to converge to a world group, but rather to their income health group. Two of the convergence groups established are located in the middle and high part of the distribution: the rich (in both health and wealth) group, and the middle (average riches and health) group. Turkey converges to neither group, as is also the case with China and a relatively large group of middle-income South Asian and Latin American countries, amounting to one-fourth of the overall global population, as covered by the dataset. If the temporal pattern of the last 50 years analyzed here remains unchanged, there is no reason for this group of countries to join with either of the two convergent group of countries situated to their immediate left and right on Table A1-9.
Conclusion
The conclusions concerning global health income development reached via the above analysis of cross-country data may be summarized as follows: (1) The general continuity in the global picture of health development over the decades is counteracted by crucial discontinuities in the data, discontinuities that have already been remarked upon in relation to both the country grouping level and the decadal grouping level.Footnote 128 (2) In terms of the crucial 1980 discontinuity focused upon both here and in previous literature, the decades preceding the 1970s followed a lower rate of growth in life expectancy values, with a greater variance; the changing values for the growth rate and variance in health and wealth values can be seen in Table A1-10. In the same period, a significant number of developing countries were taking a step backward for a variety of reasons.Footnote 129 Developed countries, though, followed a much more stable growth pattern that allowed them to distance themselves from the global average, even as developing countries’ improvement, on average, decreased significantly. As a result, in this period the correlations between health and economic values, as seen in Table A1-11, became that much stronger, whereas in other periods these correlations weaken. (3) The 2000s—with the final date of investigation being the year 2013—represent another discontinuity in the data,Footnote 130 with the majority of developing countries showing a significant improvement as compared to the 1980–2000 period, in terms of both economic and health performance. As a result, during this period a subset of developing countries was able to move closer to the developed country average in terms of life expectancy. A cursory and introductory view of this picture emerges from the correlation between the health and wealth relationship, which strengthens in those decades when rich countries are the best improvers in health and weakens in those periods when the poorer part of the world distribution also improves its health situation both relatively and absolutely, as shown in Table A1-11.
The general picture of global development thus supports the periodization utilized in this study, which treats the 1960s–1970s as an independent period that is significantly differentiated from the 1980s–1990s period, which in turn is significantly differentiated from the mode of development in the 2000s for the whole subset of developing countries. It seems from the data that periods of high intrasociety and intersociety economic inequality might also change the level of health improvements from which countries can profit.Footnote 131
According to the specific analysis undertaken here for the Turkish case, Turkey’s performance within this general picture of changing health and wealth relationships was much more stable than that of the majority of the developing country dataset.Footnote 132 Even in the globally problematic 1980–2000 period, Turkey’s health performance did not lag, and moreover its performance in this period was relatively similar to and symmetric with its own performance in the 1960–1980 period, whereas for the majority of the developing countries, the 1980s period brought significant discontinuity in the health-economy relationship, with the pre-1980s period having been much more likely and, in its political-economic parameters, more amenable to witness the health and economy dimensions growing together.Footnote 133
In terms of Turkey’s performance as compared to the general picture of global development, the seven conclusions that I derive from the overall analysis in this paper may be summarized as follows: (1) Turkey is growing mostly at the pace and pattern of a developed country; that is, steadily, but at a lower pace than the maximum growth rate of successful developed countries. (2) The two most successful periods in terms of relative health development were the 1960s and the 1990s, during which, among a highly heterogeneous developing country group,Footnote 134 Turkey managed to distinguish itself by improving its health parameters sustainably and continuously while either explicitly targeting or implicitly diminishing the health inequalities that had been historically established. (3) The 1970s represents the most homogenous decade of health development, one in which the majority of the world, including Turkey, grew at a similar pace. (4) In the 1980s, Turkey was able to separate itself from the poor health performers in the developing country subset, within which a large minority of countries were slipping in terms of their accumulated health characteristics. (5) The 1990s was an especially successful period in that, within the context of an especially bad aggregate performance by developing countries, Turkey managed to differentiate itself positively, in relation both to the aggregate health values of the other countries, and to its own health inequality performance in other decades. (6) In the 2000s, Turkey was successful, but its overall picture was not positively distinguished from the other developing countries, which during this period were themselves growing at a more rapid pace as compared to the dormant 1980s and 1990s. (7) The most substantial macro achievements of the Turkish health system over the previous 50-plus years—i.e., establishing a coverage umbrella that, at least on the financing side, extends to nearly the whole (98 percent) of the population and bringing the infant mortality rate close to 10 (13.2) per 1,000 live births—have been hampered on the other side by the increased costs of running the health system, increased questions about the long-run sustainabilityFootnote 135 of the financing scheme as it relates to labor market equilibrium,Footnote 136 and longstanding inequalities that will only get worse if issues of financing and/or access begin to become insurmountable for the administrators and receivers of health.
In my view, what is needed is a fuller political economic analysis of the Turkish healthcare system, one that utilizes more micro-level work, with a richer set of variables, on a smaller subset of countries. Furthermore, the results outlined in this paper show that analysis of the post-1980 and pre-1980 periods should be separated, since the crucial parameters of the economy and health, as well as the relationships between them, appear to have changed significantly across that threshold. My work here has simply focused on building the groundwork for such an analysis by establishing consistent periodizations, identifying close health partners/neighbors, situating Turkey’s health development and challenges within a broad global framework, and trying to illuminate the long-run development in those parameters and dimensions that play a critical role in the development of Turkey’s macro health outputs.
Appendix 1: Tables
Summary statistics for world distributions (income and health dimension)
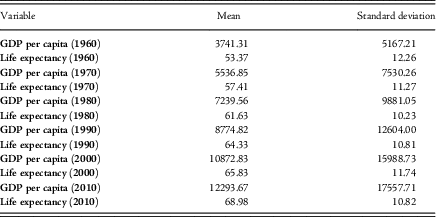
Health classes of the global distribution (1960–2010)Footnote 137
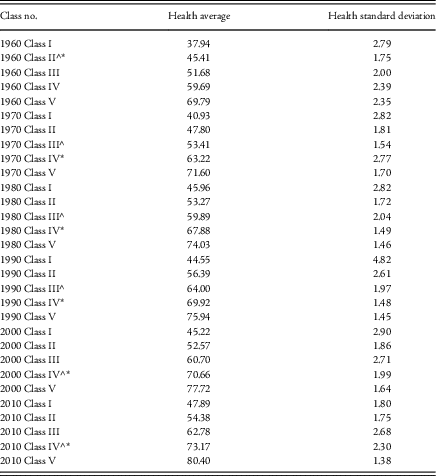
Income classes of the global distribution (1960–2010)Footnote 138
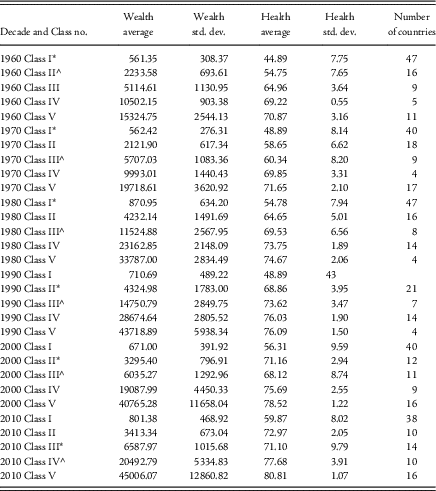
Structural break test for health-economic development relations in China and TurkeyFootnote 139

Increases in public health expenditures for Turkey and China (1995–2015)Footnote 140

Periodization of China and Turkey – Decadal changesFootnote 141 in IMR (Infant Mortality Rate), GDPPC (Gross Domestic Product Per Capita), and Life Exp. (Life Expectancy)

Turkey’s health groups (1960–2010)Footnote 142

Turkey’s income groupsFootnote 143 (1960–2010)

Convergence clubs of health (1960–2013)

Summary of growth and standard deviation of growth for the global set of countries (1960–2010)Footnote 145

Global correlation between health and income (by decade)Footnote 146


Appendix 4: Cluster analysis theory and empirics
Theoretical rationale for approach
In the paper, cluster analysis is utilized in order to divide n number of countries into an endogenously chosen set of groups (k) that minimizes in-group variation (vik), homogenizes between cluster variation level for all periods, and allows between-cluster variation (vk) to be larger than the in-group variation for all the different time periods. After this methodological manner of partitioning the data into different groups (using the same methodology for different time periods consistently), the performance of the overall partitions and the position of countries within the partition is investigated using the cross-sectional dimension of the data, and I investigate how these partitions are recreated in the time dimension and how one country moves from one health cluster to another through time. The original methodology of partitioning the data is given by the following calculation:
 $$ \arg \min \sum\sum \left| {\left| {x{\hbox -}u_{k} } \right|} \right|^{2} $$
This selects the countries that go into the k-group by minimizing the squared deviations between the country value (x) from the endogenous mean (uk) of the group that is formed.
As a result of utilizing this methodology, between-group variation is minimized, and, in the presence of fixed overall variance to the overall group of countries, this maximizes the variation between the groups that are formed.
Empirical utility of approach
The approach identifies the health neighbors and health groups for Turkey and China for the five different time periods of study and identifies these characteristics endogenously using the time-partitioned data. As a result, the already well-identified observations that health and the rate of increase in health output are both distributed heterogeneously among countries is used in order to divide the countries into hard-partitioned mini-clusters (health neighbors). Using this consistent hard partition, two sets of questions can be asked. The first is the static question concerning what other common characteristic exists between countries that share the same health group in a given time period. The second is the dynamic question concerning what characteristics are exhibited by countries that are able to upgrade to health neighbors with higher health and human development values, and which other variables seem to limit further upgrade for countries.
Appendix 5: Convergence analysis theory and empirics
Theoretical rationale for approach
Convergence is the study of the characteristics and composition of specific endogenously determined groups that resemble one another in the crucial variables of interest more and more as a longer time series data is used. Thus, the investigation has to do with the change in time from t=1 to t=N, and as N increases, the specific country characteristics (H) take a transition path to the steady state characteristics of the overall group (HN). In this case, for a country i that is moving toward this group’s specific steady state, the transition path that this country takes hit as time passes, more and more resembling the group growth path (un).
Thus, at the start, catch-up dynamics can operate and hit can be larger than un as time passes:
 $$\eqalignno{ & {\rm t }\to{\rm }\infty \cr & {\rm h}_{{{\rm it}}} /{\rm u}_{{\rm n}} \to{\rm 1} $$
Thus, the country’s growth path more and more comes to resemble the group growth path. Since the critical variable of interest is related to the health of countries (Hit),
 $${\rm h}_{{{\rm it}}} {\equals}{{{\rm log}(hit)} \over {N{\minus}1{\asterisk}\sum {\rm loghit }}}$$
should be converging to 1 for all members of the group, and as a result the cross-sectional variance of the group should be converging to 0, as t→∞.
Empirical utility of approach
Since development has always been linked to decreasing the inequality between developed and developing countries—and as a result decreasing the variance between these groups—historical analysis of whether this actually occurs is very important for understanding whether there is a homogenous (through time and space) development occurring in the data.
Since the crucial theoretical specification of the long-term growth dynamics specified by Solow in his work on the development of economic output (GDP per capita), a vibrant theoretical and empirical economic literature has emerged in the area of convergence analysis. The most important theoretical extension done on Solowian dynamics was the introduction of the possible conditional Beta convergence by Barro and Salai-Martin and of club convergence by Galor. Over the last ten years, the development literature has been extending empirically so as to look at not only whether the development convergence is seen in economic output, but also other more expanded variables, such as human development, as touched upon by Noorbaksh. This study applies this idea to life expectancy values in the spirit of this expanded research and tests whether unconditional convergence (i.e., Solowian convergence), Beta convergence, or club convergence dynamics operate in the determination of the life expectancy values in the utilized dataset for the timespan of that dataset.



