INTRODUCTION
Epigenetic gene silencing is a well-known mechanism controlling gene expression in various organisms such as yeast, plants and mammals (Moazed, Reference Moazed2001; Vaucheret and Fagard, Reference Vaucheret and Fagard2001; Kawasaki et al. Reference Kawasaki, Taira and Morris2005). It was also described in single-celled eukaryotes such as parasitic protozoa, where it plays important roles during the completion of the life cycle and pathogenesis (Hakimi and Deitsch, Reference Hakimi and Deitsch2007; Lopez-Rubio et al. Reference Lopez-Rubio, Riviere and Scherf2007).
In Entamoeba histolytica, the aetiological agent of amoebic colitis and liver abscesses, an unusual epigenetic transcriptional gene silencing mechanism was discovered a few years ago in our laboratory (Bracha et al. Reference Bracha, Nuchamowitz and Mirelman2003; Mirelman et al. Reference Mirelman, Anbar and Bracha2008). By transfecting a hybrid plasmid containing the 5′ promoter region of the amoebapore a (ap-a) virulence gene which also included a truncated segment of an upstream neighbouring SINE1 element, a complete silencing of that gene was obtained at both episomal and genomic levels. The ap-a gene silencing remained stable even after the removal of the plasmid and has persisted until now in a cloned amoeba strain named G3. We also found that additional genes of choice could be silenced in the G3 amoeba trophozoites by cloning such genes under the 5′ ap-a upstream region that included the truncated SINE1 element. Silencing was successfully achieved for other virulence genes such as the cysteine proteinase 5 (cpA5) and the light subunit of the Gal/GalNac lectin (lgl1), and a new clone (named RB9) was generated in which ap-a, cpA5 and lgl1 were all stably silenced (Bracha et al. Reference Bracha, Nuchamowitz, Anbar and Mirelman2006).
Experimental characterization of the gene silencing mechanism revealed that it occurs at the transcriptional level involving neither DNA methylation nor siRNA mechanisms, but it depends on the presence of the truncated SINE1 element in the plasmid (Anbar et al. Reference Anbar, Bracha, Nuchamowitz, Li, Florentin and Mirelman2005). A histone modification was detected in the silenced ap-a gene (Anbar et al. Reference Anbar, Bracha, Nuchamowitz, Li, Florentin and Mirelman2005), indicating the involvement of an epigenetic mark. Nonetheless, how the epigenetic transcriptional gene silencing is initiated, maintained and propagated in the progeny remains unclear. In this study we took a closer look at the chromatin modifications in the G3- and RB9-silenced amoeba strains. We were interested in particular to examine whether similar epigenetic modifications occurred in the additional genes that were silenced (cpA5 and lgl1).
Epigenetic gene regulation depends on two major mechanisms that determine the access of transcription factors to the chromatin template: (I) histone post-translational modifications (PTM) and (II) ATP-dependent chromatin remodelling. Among the best-characterized histone modifications are the acetylation and methylation of lysine residues on histone H3 and histone H4 (Kouzarides, Reference Kouzarides2002; An, Reference An2007). The methylation of histone H3 lysine 4 (H3K4) is often associated with transcriptionally-active regions, especially for its di- and tri-methylated forms (Santos-Rosa et al. Reference Santos-Rosa, Schneider, Bannister, Sherriff, Bernstein, Emre, Schreiber, Mellor and Kouzarides2002; Schubeler et al. Reference Schubeler, Macalpine, Scalzo, Wirbelauer, Kooperberg, Van Leeuwen, Gottschling, O'neill, Turner, Delrow, Bell and Groudine2004), whereas the H3K9 methylation contributes to gene silencing in many organisms (Lachner and Jenuwein, Reference Lachner and Jenuwein2002; Schotta et al. Reference Schotta, Lachner, Sarma, Ebert, Sengupta, Reuter, Reinberg and Jenuwein2004). The combination of several histone modifications has an impact on chromatin structure and organization, by serving as docking sites for effector proteins which, in turn, modulate the level of gene expression (Strahl and Allis, Reference Strahl and Allis2000; Jenuwein and Allis, Reference Jenuwein and Allis2001). In addition, the recruitment of ATP-dependent chromatin remodelling enzymes also regulates the access of transcription machineries to DNA by either inducing facultative heterochromatin formation, or by relieving the nucleosomal repression at specific promoter regions (Becker and Horz, Reference Becker and Horz2002; Gangaraju and Bartholomew, Reference Gangaraju and Bartholomew2007).
The sequence of the N-terminal tail of E. histolytica histone H3 is significantly different from those of higher eukaryotes (Fodinger et al. Reference Fodinger, Ortner, Plaimauer, Wiedermann, Scheiner and Duchene1993), but it still contains most of the putative residues usually targeted by PTM with the exception of the ninth residue, where an arginine is present instead of a lysine. Using chromatin immunoprecipitation (ChIP) with antibodies specifically raised against the di- and tri-methylated E. histolytica H3K4, as well as controlled nuclease digestion assays, we obtained evidence that the formation of facultative heterochromatin is part of the silencing mechanism. The coding region of the ap-a, cpA5 and lgl1 genes were found to be less methylated when they are transcriptionally silent in the G3 or RB9 amoeba strains as compared to when they are expressed in the isogenic parental HM-1:IMSS strain. This was accompanied by a consistent increase in H3 core histone density, indicating chromatin compaction in the coding region of the silenced genes. Moreover, the promoter region of the silenced genes also underwent structural changes at the chromatin level as they became significantly more resistant to micrococcal nuclease digestion.
MATERIALS AND METHODS
Strains and culture conditions
Trophozoites of E. histolytica strain HM1:IMSS, G3 (Bracha et al. Reference Bracha, Nuchamowitz and Mirelman2003) and RB9 (Bracha et al. Reference Bracha, Nuchamowitz, Anbar and Mirelman2006) were grown axenically at 37°C in TYI-S-33 medium (Diamond et al. Reference Diamond, Harlow and Cunnick1978).
Antibodies
Polyclonal anti-histone H3 were obtained from Abcam. The antibodies against the di- and tri-metylated lysine 4 of histone H3 of E. histolytica were raised by immunizing rabbits with a synthetic peptide ART[K-Me2,Me3]GHIERPSC from the N-terminal sequence of histone H3 (Fodinger et al. Reference Fodinger, Ortner, Plaimauer, Wiedermann, Scheiner and Duchene1993) (Fig. 1A). The antibodies to the di- and tri-methylated K4 were then purified by passing them through a Sepharose column to which the methylated peptides were covalently ligated. Following elution from the column, the anti-H3K4me antibodies were separated from antibodies against the peptide backbone by passing them through a second column on which the identical non-methylated peptide was ligated.
The N-terminal tail of Entamoeba histolytica H3 harbours several differences compared to other species. (A) Multiple sequence alignment of histone H3 from E. histolytica and other representative organisms. Highlighted are the residues usually targeted by post-translational modifications. Underlined is the sequence of the peptide used for the preparation of the anti-H3K4me2/me3 antibodies. (B and C) Characterization of the polyclonal antibodies raised against di- and tri-methyl H3K4. (B) Dot blot analysis showing the specificity of the anti-H3K4me2/me3 antibodies at different concentrations using methylated and non-methylated peptides as indicated on the panel. (C) Total histones and protein extracts from the E. histolytica HM-1:IMSS strain were separated by SDS-PAGE, blotted onto nitrocellulose and probed with the anti-H3K4me2/me3 antibodies (lanes 1, 2 and 4) or with pre-immune rabbit serum (lane 3) or with anti-histone H3 antibodies (lane 5). Where indicated, competition with peptide was at 0·1 μg/ml.

Determination of antibody specificity by dot blot and Western blot
The synthetic peptides (mentioned above) spanning the first 10 amino acids of the E. histolytica H3 either unmethylated or containing a di- or tri-methylation modification on lysine 4 were diluted in 0·1 m phosphate buffer, pH 8. Then 5 μl of each dilution were applied directly to a nitrocellulose membrane (Whatman) and allowed to dry. The membrane was blocked with 5% milk in Tris-buffered saline-Tween-20 (TBS-T) for 2 h and then incubated with the anti-H3K4me2/me3 antibody, diluted 1:1000 with 5% milk TBS-T, overnight at 4°C. The membrane was rinsed 3 times with TBS-T and incubated for 2 h with horseradish peroxidase conjugated to a goat anti-rabbit antibody (Jackson ImmnuoResearch Laboratories), diluted 1:3000 in 1% milk TBS-T. The antibody staining reaction on the membrane was developed by an enhanced chemiluminescence kit (ECL) (Amersham). For Western blots, extracts of histones were prepared from E. histolytica HM-1 strain as described by Byers et al. (Reference Byers, Faigle and Eichinger2005). Total nuclear protein extracts were obtained as reported but without acid precipitation. Identical protein amounts of each extract were loaded on a 20% SDS-PAGE, transferred onto a nitrocellulose membrane, and reacted as described for the dot blot. For the detection of the H3 core histone, the anti-histone H3 antibodies were diluted 1:1000 in 5% milk TBS-T. For the competition experiments, the diluted primary antibody was incubated overnight at 4°C with the corresponding peptides added to a final concentration of 1 μg/ml.
Chromatin preparation from E. histolytica
Cultures of E. histolytica were grown for 48 h and cross-linked by adding 1% formaldehyde (Merck) to the medium and incubating for 10 min at room temperature. The reaction was quenched by adding glycine to a final concentration of 125 mm. Cells were then harvested by centrifugation at 500 g for 5 min, washed twice with PBS and resuspended in ice-cold lysis buffer (150 mm NaCl, 50 mm Tris-HCl, pH7·5, 5 mm EDTA, 0·5% NP-40, 1% Triton X-100) supplemented with 5 μl/ml of PMSF (0·1 m) and 10 μl/ml protease cocktail inhibitor (Sigma). The chromatin was sonicated on ice 14 times for 10 sec (50% power output) with 1 min intervals using a MicrosonTM ultrasonic cell disruptor (Misonix) and cleared by centrifugation at 13 792 g for 10 min at 4°C.
Chromatin immunoprecipitation (ChIP) assay
Sonicated chromatin from 3×10⁷ cells was first pre-cleared with nProtein A-Sepharose beads (GE Healthcare) for 1 h at 4°C. The chromatin was then incubated overnight at 4°C with either (i) anti-H3K4me2/me3 antibody (1:100), (ii) anti-H3 core histone antibody (1:100) (Abcam), or (iii) a non-related antibody against a metalloprotease of E. histolytica (MP-16C) (1:100), generously provided by Dr. Barrios Ceballos. To collect the immunoprecipitated complexes, 60 μl of nProtein A-Sepharose beads were added to each sample and rotated for 3 h at 4°C. Beads were washed and eluted as previously described (Chookajorn et al. Reference Chookajorn, Dzikowski, Frank, Li, Jiwani, Hartl and Deitsch2007). Eluates and input samples were incubated overnight at 65°C to reverse the cross-linking reaction. DNA was purified by deproteinization, phenol-chloroform extraction, and ethanol precipitation.
Micrococcal nuclease (MNase) digestion
Nuclei from E. histolytica were isolated using a protocol adapted from Bruchhaus et al. (Reference Bruchhaus, Leippe, Lioutas and Tannich1993) as follows: approximately 2×10⁷ trophozoites of each E. histolytica strain grown for 48 h were harvested by chilling on ice and centrifuged at 500 g for 5 min at 4°C. Pellets were washed twice with ice-cold PBS and twice with buffer (10 mm Tris-HCl pH7·4, 3 mm CaCl2, 2 mm MgCl2). The cells were lysed on ice with 5 volumes of the same buffer supplemented with 1% NP-40, 0·15 mm spermine and 0·5 mm spermidine. Lysis completion and nuclei integrity was monitored by phase-contrast microscopy. After centrifugation, nuclear pellets were washed once with lysis buffer, and twice with washing buffer (10 mm Tris-HCl pH7·4, 3 mm CaCl2). Finally, the pellets were resuspended in MNase digestion buffer (50 mm Tris-HCl pH8, 0·1 mm CaCl2, 20% glycerol) to a final volume of 500 μl. Digestion of nuclei using MNase (Worthington, Biochemical Corporation) was done by adding the enzyme to 100 μl of nuclei preparation to a final concentration of 10, 20, 30 or 50 U/ml. The samples were incubated for 10 min at 37°C, and the reactions were stopped by adding 100 μl of Stop solution (50 mm Tris-HCl pH7·5, 150 mm NaCl, 15 mm EDTA, 0·3% SDS). Digested chromatin was treated with proteinase K (375 μg/ml) (Sigma) and 2% SDS overnight at 37°C. The DNA was extracted by phenol-chloroform, precipitated with ethanol and resuspended in 30 μl of distilled water. Prior to PCR analysis, the samples were dialysed on filter membranes (0·025 μm VSWP Millipore).
Quantitative Real-Time PCR (qPCR)
Real-Time PCRs were carried out with the ABsoluteTM Blue® QPCR SYBR Green ROX Mix (Thermo Scientific) in a 20 μl reaction on an ABI Prism 7500 system (Applied Biosystem) with the default 3-step method, 40 cycles. The primer sets to analyse DNA after ChIP assays were the following: for the coding region of ap-a (5′-AAACAATCATGAAAGCCATCG-3′ and 5′-GCTTTATTGCAAAGGCTGC-3′) cpA5 (5′-TGTTCTGTTATTAGTGGTTGTAGC-3′ and 5′-TAGCAGCAAATGGTCCTTC-3′) lgl1 (5′-CGGAAAAGATCAACTTTCTCC-3′ and 5′-TCTTGATTTGCACTAAAAACTCC-3′). As a positive control we used the gene coding for the ribosomal protein L21 (rpl21) which is stably transcribed in all the strains. The primers used for rpl21 were: (5′-CTAACGGTAGAAATAGAAGAACCAG-3′ and 5′-TCCAAACACGTCCAGTCTTTC-3′). To correlate the Ct values (threshold values) from the gene qPCR amplification plots to an amount of DNA, a standard curve was generated using serial dilutions of genomic DNA and the appropriate primer sets. Dissociation curve analysis was performed to check the specificity of amplification. Each qPCR was done in triplicate and results are expressed as the mean±S.D. The data are presented as signal relative to the total amount of input chromatin minus the background levels obtained from samples incubated with the non-related anti-MP-16 antibody. For comparison between the strains, values were normalized versus the control strain HM-1:IMSS, which was arbitrarily set as 100%.
Primer sets for the analysis of DNA by qPCR after MNase digestion were the following: for the promoter region of ap-a (5′-GATCTAAAATTTGATAAAAAGCG-3′ and 5′-CTTGG TGAGTAGCA GTGACTG-3′) and cpA5 (5′-TATTTGGACGTGCTTTGACC-3′ and 5′-TAT TATTTGCAAC CCAAGTATTG-3′).
Accession numbers for the E. histolytica genes that were investigated are as follows: rpl21- EHI_069110; ap-a – EHI_159480; cpA5 – EHI_168240; lgl-1 – EHI_035690; MP-16C – EAL49463.
RESULTS
ChIP assays reveal demethylation of H3K4 in the coding region of silent genes
The sequence of E. histolytica histone H3 is significantly different from its eukaryotic counterparts (Fig. 1A) making the commercially available antibodies for conserved histone modifications poorly reactive to modified amoeba histone tails. To overcome this problem, we prepared antibodies that specifically recognize the di- or tri-methylated K4 of E. histolytica histone H3, a crucial epigenetic mark associated with the state of gene expression. Characterization of these antibodies by dot blot revealed that they recognized the di- and tri-methylated forms of H3K4 and did not react with the unmethylated form (Fig. 1B). Consistently, Western blot analysis revealed 2 close bands with an expected size at 15 kDa in total histone extracts from the E. histolytica HM-1:IMSS strain. These bands did not appear when the antibody was competed with the corresponding peptides (Fig. 1C, lane 2) or when using a control rabbit serum (Fig.1 C, lane 3) validating the specificity and reactivity of the antibody. Additional evidence that the doublet at 15 kDa consists of histone H3 was obtained by Western blot analysis of histone extracts with the polyclonal anti-histone H3 antibody (Fig. 1C, lane 5). Further purifications aimed at producing separate antibodies that could discriminate between the di- and tri-methylation states were unsuccessful.
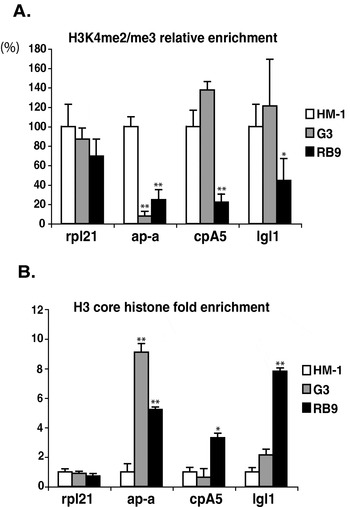
Since the ‘mixed’ antibodies recognized both H3K4 di- and tri-methylated forms, we quantitatively analysed histone methylation of 3 virulence genes (ap-a, cpA5 and lgl1) when they were in a transcriptionally active or silent state. For this purpose, we took advantage of the different amoeba strains: the parental HM-1:IMSS strain in which each of the above genes is expressed, the G3 strain characterized by a silent ap-a (Bracha et al. Reference Bracha, Nuchamowitz and Mirelman2003), and the RB9 strain in which the three genes are silenced (Bracha et al. Reference Bracha, Nuchamowitz, Anbar and Mirelman2006). Using a ChIP assay coupled to quantitative real-time PCR (qPCR), we found a significant reduction of the methylation level of H3K4 in the transcriptionally silent genes. In the G3 and RB9 strains, the ap-a gene contained only 10% and 20% of H3K4me2/me3 respectively, as compared to the level in HM-1:IMSS (Fig. 2A). These data suggest that the lower H3K4 methylation of the ap-a gene is linked to the epigenetic silencing. This hypothesis was further strengthened by the analysis of the K4 methylation levels of the cpA5 and lgl1 genes. As expected, in G3, the levels of H3K4me2/me3 in the cpA5 and lgl1 genes were high (140% and 125% respectively), consistent with their transcriptionally active state (Fig. 2A). In contrast, in strain RB9 the DNA amounts which precipitated with the anti-H3K4m2/me3 antibodies were very low for each gene, and varied between 20% and 40% as compared to the amounts obtained for the same genes in strain HM-1:IMSS. As a control, we checked the methylation levels at the rpl21 gene, which, as noted before, is transcriptionally active in each strain, and found only minor and not significant variations between the three amoeba strains (Fig. 2A). Altogether, these results support the idea that demethylation at H3K4 is a constitutive epigenetic mark associated with the particular gene silencing mechanism occurring in E. histolytica.
Comparison between the modifications at the histone H3 of 4 genes in Entamoeba histolytica strains HM-1:IMSS, G3 and RB9. (A) The silent genes have lower H3K4me2/me3 levels. The relative H3K4me2/me3 enrichment was measured by ChIP and quantified by qPCR using primers specific for the ORF's of rpl21, ap-a, cpA5 and lgl1 genes. The data are presented as signal relative to the total amount of input chromatin, minus the background obtained from samples reacted with the non-related anti MP16 antibody. For comparison, the values were normalized versus the control strain HM-1:IMSS, which was taken as 100%. (B) The amount of histone H3 increased upon transcriptional silencing. ChIPs were done with an antibody recognizing the core histone H3 and quantified by qPCR. The data are represented as the fold difference from the signal obtained from the control strain HM-1:IMSS. In each of the two panels, error bars indicate standard deviation between 3 independent experiments of the same strain (*P⩽0·05; ** P⩽0·01).

The density of histone H3 is higher in the coding region of silent genes
In parallel to the above experiments, we also examined the overall H3 core histone enrichment at the same gene locus to exclude the possibility that the decreased methylation levels observed were due to a loss of histone H3. ChIP experiments performed with a polyclonal antibody against H3 core histone revealed a systematic and significant increase in the H3 content of the genes when they were transcriptionally inactive. The H3 core histone enrichment in the domain of the ap-a gene was 9- and 5-fold higher in G3 and RB9 respectively, as compared to the level in HM-1:IMSS (Fig. 2B). A similar result was obtained at the cpA5 and lgl1 genes in the silenced RB9 trophozoites, where their H3 content increased by 4 to 8-fold (Fig. 2B). On the other hand, the levels of H3 in these two latter genes were comparable in both the G3 and HM-1:IMSS strains (Fig. 2B). These findings support the idea that the silencing is correlated with compaction of the chromatin structure in the coding region of genes.
The promoter region of silent genes is more resistant to MNase digestion
It is well established that nuclesome occupancy or depletion at the 5′ regulatory region of genes contributes to the transcriptional regulation (Van Rietschoten et al. Reference Van Rietschoten, Gal-Yam, Jeong, Cortez, Verweij and Jones2008; Henikoff et al. Reference Henikoff2008). To analyse whether the nucleosome occupancy in the promoter region of the ap-a, cpA5 and lgl1 genes undergoes modification upon silencing, we used controlled micrococcal nuclease (MNase) digestions coupled to real-time PCR. This approach has been used by others to monitor nucleosome depletion in different mammalian promoters (Gal-Yam et al. Reference Gal-Yam, Jeong, Tanay, Egger, Lee and Jones2006; Lin et al. Reference Lin, Jeong, Liang, Takai, Fatemi, Tsai, Egger, Gal-Yam and Jones2007). Digestion by the MNase enzyme induces double-strand breaks between nucleosomes without being hampered by higher order structure of chromatin (Kornberg and Lorch, Reference Kornberg and Lorch1999), and thus a different sensitivity pattern of cleavage reveals a change in nucleosome position in the region of interest (Richard-Foy and Hager, Reference Richard-Foy and Hager1987). Nuclei from the parental HM-1:IMSS and ap-a silenced G3 trophozoites were extracted and subjected to increasing amounts of MNase. The susceptibility to MNase cleavage was then determined by qPCR using primers spanning the promoter region of the ap-a gene as shown in Fig. 3A. The graph clearly shows that upon increasing concentrations of MNase enzyme, the resistance profile of the ap-a promoter differed significantly between the HM-1:IMSS and G3 strains. In HM-1:IMSS, the resistance decreased gradually, from 64% down to 26%. In contrast, in G3, the ap-a promoter was much more resistant to enzymatic cleavage, as the decrease started from 88% and reached only 68% at the highest enzyme concentration (50 U/ml). These data suggest a change in the nucleosomal organization in the promoter region of the silenced ap-a gene.
Change of nucleosome organization at the promoter region of ap-a and cpA5 genes upon silencing. (A and C) Schemes representing the ap-a and cpA5 genes and showing the promoter region chosen for qPCR amplification. (B, D and E). Comparison of the MNase cleavage profile in the promoter region of the ap-a and cpA5 genes between HM-1:IMSS and G3 (graphs B, E) or HM-1:IMSS and RB9 (graph D) amoeba strains. MNase sensitivity was determined by digesting chromatin with the indicated amount of MNase and the amount of undigested DNA was measured by qPCR. The relative resistance of a given target sequence to MNase was measured by normalizing the PCR efficiency of the primers annealing to the promoter region of ap-a or cpA5 (indicated on the schemes A and C) to that of primers annealing to a control gene (rpl21), which is expressed at similar level in each strain. The graphs show the average from 3 independent experiments along with the standard deviation (*P⩽0·05).

Similarly, we analysed the resistance to MNase of the silent genes ap-a, cpA5 and lgl1 in strain RB9, in comparison to strains HM-1:IMSS and G3. Due to the high AT-content at the lgl1 gene promoter region, it was not possible to prepare specific primers spanning this region and amplifying it correctly in the qPCR; therefore we focused on the cpA5 gene. Figure 3D shows that, as previously observed for ap-a, the promoter region of the silenced cpA5 gene in RB9 was much more resistant to nuclease digestion than in HM-1:IMSS where the gene is active. In RB9, at the highest enzyme concentration (50 U/ml) the cpA5 promoter resistance remained high (75%), whereas in HM-1:IMSS, 10 U/ml of enzyme was sufficient to decrease it to 75%. We also determined the resistance of the ap-a promoter in RB9 and found that it was similar to that in G3 (not shown). To confirm that the changes in MNase resistance were related to the gene silencing, we compared the MNase resistance of the cpA5 promoter between HM-1:IMSS and G3 strains in which the cpA5 gene is transcriptionally active. As expected, the results in Fig. 3E show that in these two different amoeba strains, the nuclease resistance patterns of the cpA5 promoter domain were similar. Taken together, these results argue in favour of an altered and more compact nucleosome positioning at the 5′ regulatory region of silenced genes.
DISCUSSION
Our present study provides additional insights into the epigenetic gene silencing mechanism that was discovered a few years ago in E. histolytica (Bracha et al. Reference Bracha, Nuchamowitz and Mirelman2003). In our previous work, we excluded the possibility that the silencing was due to DNA methylation or to siRNA (Bracha et al. Reference Bracha, Nuchamowitz and Mirelman2003; Anbar et al. Reference Anbar, Bracha, Nuchamowitz, Li, Florentin and Mirelman2005). Here, we focused our analysis on chromatin modifications, and found that there are several characteristics of heterochromatin formation in the silenced genes.
First, when comparing the same gene in transcriptionally active and inactive contexts, a loss of H3K4 methylation was found at the silenced genes. This finding suggests two things: (I) in E. histolytica, methylation of H3K4 is an epigenetic mark correlated to transcriptional activity, which is consistent with several studies that showed such a correlation between methylated H3K4 and transcriptionally active genes in yeast and humans (Bernstein et al. Reference Bernstein, Humphrey, Erlich, Schneider, Bouman, Liu, Kouzarides and Schreiber2002; Santos-Rosa et al. Reference Santos-Rosa, Schneider, Bannister, Sherriff, Bernstein, Emre, Schreiber, Mellor and Kouzarides2002; Pokholok et al. Reference Pokholok, Harbison, Levine, Cole, Hannett, Lee, Bell, Walker, Rolfe, Herbolsheimer, Zeitlinger, Lewitter, Gifford and Young2005) and (II) the lower level of H3K4 methylation found when the gene is silenced may occur either by removal of methyl groups on H3K4, via a histone demethylase enzyme, or through another epigenetic mark that may induce a cascade of events preventing the recruitment of a histone methyltransferase.
Interestingly, the E. histolytica genome contains three SWIRM-domain proteins. The SWIRM module is known to be present in the lysine specific demethylase (LSD1), a protein responsible for the removal of methyl groups from H3K4 (Forneris et al. Reference Forneris, Binda, Dall'aglio, Fraaije, Battaglioli and Mattevi2006), and it is predicted to play a role in protein-protein interaction during the assembly of chromatin-protein complexes (Aravind and Iyer, Reference Aravind and Iyer2002). Whether the SWIRM-domain proteins of E. histolytica are associated to any amino-oxydase domain, known to catalyse histone demethylation (Chen et al. Reference Chen, Yang, Wang, Wan, Yamane, Zhang and Lei2006), remains to be determined.
As mentioned before, the silencing machinery of E. histolytica may be based on the inhibition of histone methyltransferase. It was shown in several studies that there are cross talks at the level of histone tail controlling subsequent modifications. For example, in fission yeast methylation of H3K9 triggers sequential events leading to transcriptional repression via inhibition of H3 acetylation and H3K4 methylation (Nakayama et al. Reference Nakayama, Rice, Strahl, Allis and Grewal2001). In addition, H3K4 methylation was shown to be dependent on H2B ubiquitination (Sun and Allis, Reference Sun and Allis2002). It is therefore possible that the silencing mechanism in E. histolytica might start with an upstream event leading to the inhibition of histone methylation. Further investigations will be needed to elucidate the sequential events triggering the epigenetic mechanism in this parasite.
Another important issue with respect to epigenetic marks is to identify effector proteins that recognize modified histone tails as this determines the specific biological outcomes of chromatin modification (Taverna et al. Reference Taverna, Li, Ruthenburg, Allis and Patel2007). It is predicted that proteins containing chromodomain can bind to methylated histones. This is the case for heterochromatin protein 1 (HP1) that recognizes methylated H3K9 (Lachner et al. Reference Lachner, O'carroll, Rea, Mechtler and Jenuwein2001) thereby promoting heterochromatin formation. On the other hand, methylated H3K4 was shown to prevent the recruitment and binding of repressive factor such as HP1 (Wang et al. Reference Wang, Cao, Xia, Erdjument-Bromage, Borchers, Tempst and Zhang2001). E. histolytica possesses an arginine at position 9 of histone H3 instead of the lysine, and no homologue of HP1 has been found so far. Nevertheless it is likely to contain other types of chromatin-associated mediator proteins that are involved in the readout of histone modifications.
The combination of histone modifications determines the status of chromatin by recruiting different ATP-dependent chromatin-remodelling proteins. Regions of the chromatin that are densely packed and have lost gene expression are referred as facultative heterochromatin. The loss of transcription of ap-a in strain G3, and ap-a, cpA5 and lgl1 in RB9 trophozoites is attributable to heterochromatin formation. Indeed, we observed two types of chromatin changes. First, there was an increase of H3 core histone enrichment detected in the coding regions of the silenced genes, which most likely reflects chromatin compaction upon silencing. This finding is consistent with other studies that have shown a condensation of chromatin in silenced genomic regions (Loo and Rine, Reference Loo and Rine1995; Csink et al. Reference Csink, Bounoutas, Griffith, Sabl and Sage2002; Grewal and Elgin, Reference Grewal and Elgin2002). Second, we also demonstrated that the promoter regions of silenced genes are more resistant to MNase digestion compared to their actively transcribed copies. This reflects a significant change in nucleosomal organization. Chromatin remodellers of E. histolytica which might carry out nucleosome deposition and/or reposition into a more transcriptionally repressive structure have not yet been identified; however, they may be responsible for blocking access to the transcription machinery. This idea is supported by previous reports on the association between loss of transcription and changes in the chromatin at the promoter regions (Adkins and Tyler, Reference Adkins and Tyler2006; Gal-Yam et al. Reference Gal-Yam, Jeong, Tanay, Egger, Lee and Jones2006; Parnell et al. Reference Parnell, Huff and Cairns2008).
The preparation of additional antibodies that recognize E. histolytica histone modifications which are usually linked to transcriptional repression such as H3K27 and H4K20, as well as the identification of proteins which read histone modifications or are involved in chromatin remodeling will be crucial for the understanding of the silencing mechanism in this organism, and how it is maintained and spread in the progeny. In addition, such information will contribute to our understanding of other epigenetically controlled gene expressions that may occur during the different steps of the amoeba life cycle.
ACKNOWLEDGMENTS
The authors wish to thank Yael Nuchamowitz for excellent technical support. M.H. was supported by a post-doctoral fellowship from the Swiss Society of the Friends of the Weizmann Institute of Science. T.C. was supported by NSTDA, Thailand. This investigation was supported by a grant from Mrs Erica and Mr Bob Drake.