


The dream of an atomic-scale tomographic analytic microscope
Breakthroughs in materials science are often concomitant to advances in characterization methods. At the nanometer scale, new functionalities or properties of devices or materials have been discovered by designing the matter in three dimensions, making the need for three-dimensional (3D) characterization microscopes mandatory. Quantum dots, quantum wells, and quantum wires in photonic materials, and the downscaling of modern transistors, are striking examples of this phenomenon. To fully understand the relationship between the structure of materials and their properties, an ultimate microscope should be able to provide the 3D position as well as elemental identity of each atom accurately in a material system, which means with subnanometer resolution. Knowing the reality of matter at this scale helps materials scientists model the physical mechanisms of interest, such as mechanical properties, photon emission properties, and electronic conduction properties.
Currently, at this scale, very few analytical 3D microscopes exist.Reference Möbus and Inkson1–Reference Miller and Forbes4 The resolutions of x-ray tomography and focused ion beam slicing approaches are far too low at present. Only scanning transmission electron microscope (STEM) tomography and atom probe tomography (APT) are well placed in this race. Both techniques produce comparable images in terms of field of view and resolution, as seen in Figure 1, which shows an example of an alloy composed of Ag particles in an Al matrix. For the same sample, both microscopy techniques reveal similar atomic-scale distributions of the Ag atoms in the Al matrix, where the spherical particles are a few nm in size.Reference Van Tendeloo, Van Dyck and Pennycook3,Reference Arslan, Marquis, Homer, Hekmaty and Bartelt5 Although significant leaps forward have been made in STEM tomography (recently achieving atomic resolution),Reference Van Aert, Batenburg, Rossell, Erni and Van Tendeloo6,Reference Xu, Chen, Wu, Scott, Theis, Ophus, Bartels, Yang, Ramezani-Dakhel, Sawaya, Heinz, Marks, Ercius and Miao7 APT is currently more suited to the routine production of analytic tomographic images with subnanometer spatial resolution. APT instruments are used in more than 50 labs around the world, in both academia and industry, with the fields of applications ranging from metals to biological materials, yielding exciting results across many fields.Reference Miller and Forbes4,Reference Larson, Prosa, Ulfig, Geiser and Kelly8,Reference Gault, Moody, Cairney and Ringer9
Schematic drawing of the atom probe tomography (APT) setup and reconstruction parameters with an Al-1.7 at.% Ag alloy sample. (a) Image of the APT tip. Here, the sample is composed of small Ag-rich precipitates embedded in an Al crystalline matrix. The tip, defined by geometric features (tip radius R and angle of the shaft), is at a distance L from the detector in a straight flight path configuration. The detector has a radius R Det. Evaporated atoms are projected from the tip surface (x,y) position to the detector (X Det,Y Det) position. Projection center P is situated at a distance mR from the tip center O. (b) Reconstructed image of a volume of evaporated and detected n atoms. Evaporation was stopped in the middle of an Ag-rich precipitate, denoted by the white box. (c) High-angle annular dark field–scanning transmission electron microscope (HAADF–STEM) image of the tip surface including the half-eroded precipitate (Ag atoms appear in bright contrast). Note: BF, bright field.Reference Marquis and Vurpillot37,Reference Lefebvre, Hernandez-Maldonado, Moyon, Cuvilly, Vaudolon, Shinde and Vurpillot42

New users of the technique face two pitfalls when exploiting the power of the technique. The first is data generation.Reference Vurpillot, Gault, Geiser and Larson10,Reference Larson, Gault, Geiser, De Geuser and Vurpillot11 APT performance is related to the physical principles involved in the instrument. Though these basic principles are relatively simple, the images are not free from artifacts. Artificial features or biased images may be misinterpreted by beginners in the field. The second pitfall is the extraction of interesting information from the huge quantity of data generated.Reference Cairney, Rajan, Haley, Gault, Bagot, Choi, Felfer, Ringer, Marceau and Moody12 Each tomographic image produced by APT analysis is composed of millions of data points, including the position and elemental nature of each atom present in the analyzed volume. Automated tools to mine the data exist, but the correct use of these tools is essential to avoid misinterpretation. This article will give a brief overview of the reconstruction process that can limit the accuracy of tomographic images and some new methods and tools that can be exploited to highlight the presence of microstructural features only revealed by tomographic techniques.
Basic principles
The atom probe is unique among available microscopy techniques. In its simplest design, the sample projects its own image from the near field of the atomic surface to the far field of a macroscopic detector (see the introductory article in this issue).Reference Miller and Forbes4,Reference Larson, Prosa, Ulfig, Geiser and Kelly8,Reference Gault, Moody, Cairney and Ringer9 This projection is governed by the generation of a strong electric field diverging from the sample, which is initially prepared as a sharply pointed needle and subjected to a voltage V (a few kV). The high curvature of the tip surface (mean radius R, Figure 1) gives rise to a surface field E given in a first approximation by:
 $$E = {V \over {kR}} .$$
Here, k is a dimensionless factor called the field factor. It is in the range of 3 to 7 and accounts for the deviation of the emitter field from that of an ideal sphere. A few kV applied to a sample with an end radius in the range of 10–100 nm is sufficient to generate a static electric field E of several tens of V/nm. The surface charge built up exerts a large force that can be sufficient to snatch single atoms from the surface. (Reference 4 gives a detailed description of the physical principles.) These atoms are rapidly ionized (charge q) and projected by the Coulomb force (F = q E). The threshold electric field gives rise to field evaporation (named evaporation field), E FEV, which varies from 10 V/nm to 60 V/nm, and mostly depends on the adhesive force of the surface atoms. In the far field, ions are further accelerated in the diverging electric-field distribution. However, a few tens of microns in front of the tip, the ions generally follow a straight trajectory toward the detector. A magnification close to one million is obtained on the ∼5–10 cm diameter detector.
For the purpose of formulating a back projection algorithm, understanding the path of a particle from its initial position at the tip surface to the final position onto the detector requires a perfect description of the subtle movements of the atom from the first steps of evaporation. Any small deviations in its initial position could induce considerable perturbations in the projected position. As the specimen progressively erodes, atom-by-atom, this projection may evolve in complex ways. Any surface roughness arising from field evaporation induces trajectory aberrations. These mostly appear in the near field, close to the specimen surface. In the far field, beyond a distance corresponding to a few radii of curvature of the specimen, the ion trajectories are mostly influenced by mesoscopic parameters, such as the curvature of the rounded apex of the specimen, the angle of the truncated cone on which the spherical apex is set (shaft angle), and the overall electrostatic environment.
Basics of the reconstruction and fundamentals limitations in APT
The result from an APT measurement consists of an ordered list of two-dimensional (2D) ion hit position at the detector (X Det,Y Det), the time of flight, and the actual high-voltage value V for each registered evaporation event. Astonishingly, this data set is completely sufficient to enable the highly resolved 3D reconstruction of the measured sample volume with atomic accuracy. The recorded event sequence reflects the continuous field erosion of the tip apex. Similar to the work of an archeologist excavating the surface of soil with a brush, grain-of-sand by grain-of-sand to reveal hidden artifacts, the APT user analyzes the tip atom-by-atom from the curved surface of the material of interest. The sequence of atom removal is accurately recorded, each atom being labeled by the order of arrival n seq, and in the reverse approach of tomographic reconstruction, the same sequence may be considered as a natural depth scale, making it possible to map backward to the 3D coordinates at the tip (x, y, z):
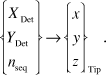 $$\left\{ \matrix{ {X_{{\rm{Det}}}} \cr {Y_{{\rm{Det}}}} \cr {n_{{\rm{seq}}}} \cr} \right\} \to {\left\{ \matrix{ x \cr y \cr z \cr} \right\}_{{\rm{Tip}}}}.$$
Bas et al.Reference Bas, Bostel, Deconihout and Blavette13 described this basic reconstruction procedure nearly 20 years ago by. Only minor modifications due to progress in instrumentation have been made.Reference Geiser, Larson, Oltman, Gerstl, Reinhard, Kelly and Prosa14,Reference Gault, Haley, de Geuser, Moody, Marquis, Larson and Geiser15 In this model, the emitter is described as a hemisphere that is superimposed on a conical shaft (Figure 1a). For ion imaging on the detector, linear point projection is used with the origin P displaced from the center of the apex sphere along the emitter axis. The relationship between the launch angle θ at the tip surface and the observed imaging angle θ′ at the detector is written as:
 $$\theta \approx \xi \theta \prime ,$$
with ξ being defined by P as OP = (ξ – 1)R.
Considering the imaging process as a point projection mechanism, a typical value of ξ in APT experiments is 1.6.
In order to specify the mapping (Equation 2), we use polar coordinates. From (X Det,Y Det), angles θ and Φ (azimuth) are calculated. The mapped coordinate at the emitter yields (Equation 3)
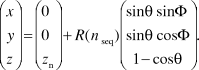 $$\left( \matrix{ x \cr y \cr z \cr} \right) = \left( \matrix{ 0 \cr 0 \cr z_n \cr} \right) + R\left( {n{\,_{{\rm{seq}}}}} \right)\left( \matrix{ \sin \theta \sin \Phi \cr \sin \theta \cos \Phi \cr 1 - \cos \theta \cr} \right).$$
This allows the reconstruction of the measured volume if the appropriate apex position z n and the curvature radius R(n seq) are known. Unfortunately, both of these parameters are subject to independent changes. Indeed, it is a major challenge for the reconstruction to consistently predict their evolution.Reference Vurpillot, Gault, Geiser and Larson10,Reference Larson, Gault, Geiser, De Geuser and Vurpillot11
To this end, we assume, in a simplification, that the initial emitter apex develops in a self-similar manner with the onset of field evaporation. For the particular model of the emitter described with a half-sphere on top of a tangent truncated cone, the change in curvature is proportional to the shrinkage Δz along the axis. On the other hand, considering conservation of volume, the shrinkage is equal to the evaporated volume that intercepts the detector. In general, calculation of the field-eroded volume is not possible without an approximation. We discuss the case of Δn seq, the number of field evaporated atoms, being small. The shrinkage is proportional to Δn seq if a homogeneous atom volume Ω is assumed.
If the emitter is homogeneous, a steady evaporation field E Evap acts, and the appropriate curvature R(n seq) may be directly inferred from V (Equation 1). However, in complex emitter structures and inhomogeneous evaporation conditions, better results are obtained when the curvature is calculated from geometrical parameters that factor in the tip shape. Complex methods, taking into account a snapshot of this shape prior to field evaporation, are available as commercial software.Reference Larson, Prosa, Ulfig, Geiser and Kelly8
In a homogeneous material, 3D spatial accuracy of reconstructed images (limited by the reconstruction algorithm inaccuracy) is in the nanometer range for volumes of approximately 100 × 100 × 100 nm3. Sub-Angström spatial precision in the depth scale is commonly observed experimentally due to the regularity of the field evaporation mechanism. (Only protruding atoms, producing an enhanced field, are at high risk for evaporation, which makes the evaporation process deterministic.) The lateral precision is always worse, typically in the subnanometer range, because the lateral scaling is linked to the local trajectories of field-evaporated atoms. Deviations of the trajectories from the ideal projection normal to the atomic surface due to subtle atom movements in the first steps of flight lead to erroneous reconstruction of their positions.
Besides the inaccuracy of the back projection law (Equation 3), which may be improved experimentally, the evaporation thresholds of inhomogeneous materials are more problematic. During measurement, they are responsible for the development of complex apex morphologies with locally changing curvatureReference Larson, Gault, Geiser, De Geuser and Vurpillot11,Reference Vurpillot and Oberdorfer16 (Figure 2). As a result, trajectories significantly differ from the ideal case. The effect can be dramatic. For instance, detector hit positions of atoms originating at either side of materials interfaces may even overlap (Figure 2c).
Example of tip shape roughness induced by field evaporation difference between phases. (a) Field ion microscopy of the atomic surface of an Al-Ag alloy, with a small Ag-rich precipitate emerging at the surface close to a (022) terrace structure. (b) Simulation of the field-evaporated surface of the tip with a small particle (shown by blue arrow and blue atoms) with field evaporation 20% higher than the matrix. (c) Corresponding ion impacts for the evaporation of two atomic terraces. Model prediction of atomic density variations with ions crossing at the interface of the particle is depicted by the blue atoms impacting inside the surrounding matrix (yellow atoms).Reference Vurpillot, Bostel and Blavette38,Reference Vurpillot39
One solution is to set up a physically informed reconstruction approach, which can account for the electrostatic conditions at the emitter and its morphology in a consistent form. Simulations have shown the breadth of the effects (such as local shaping of the tip and trajectory overlaps) that need to be accounted for. However, simulations are not yet sufficiently resolved to retrieve projection relationships. Several efforts have focused on using a posteriori corrections to tomographic reconstructions to improve the method. Indeed, the reconstruction process may profit from additional information arising from the data itself or from coupled characterization techniques.Reference Cairney, Rajan, Haley, Gault, Bagot, Choi, Felfer, Ringer, Marceau and Moody12,Reference Vurpillot and Oberdorfer16–Reference Herbig, Raabe, Li, Choi, Zaefferer and Goto23 The local density of atoms is the simplest parameter to consider. Some algorithms have been developed to rectify density variations (induced by differences in the evaporation field between species) in z or laterally.Reference Larson, Prosa, Ulfig, Geiser and Kelly8,Reference De Geuser, Lefebvre, Danoix, Vurpillot, Forbord and Blavette24 Better reconstructions were obtained, but a careful investigation of the accuracy of the resulting data must be undertaken to validate these methods.
Data mining methods
A paradox in APT is that on the one hand, it provides an unprecedented level of imaging resolution in three dimensions. On the other hand, it is very difficult to obtain an accurate perspective of morphology or shape outlined by atoms of similar chemistry and microstructure. The origins of this problem are numerous, including incomplete detection of atoms, and the complexity of the evaporation fields of atoms at or near interfaces. Hence unlike scattering techniques such as electron microscopy, interfaces appear diffuse, not sharp. This, in turn, makes it challenging to visualize and quantitatively interpret the microstructure at the “meso” scale, where one is interested in the shape and form of the interfaces and their associated chemical gradients. It is here that the application of data mining and statistical learning methods plays a critical role in both defining the level of uncertainty and helping to make quantitative, statistically objective interpretations where heuristics often dominate.Reference Cairney, Rajan, Haley, Gault, Bagot, Choi, Felfer, Ringer, Marceau and Moody12,Reference Rajan25 Some examples of the challenges in atom probe analysis where the mathematics of data science can be of great value in solving these problems are discussed later in the text.
Selection of voxel size
Identifying nanoscale chemical features from APT data routinely involves adjustment of voxel size as an input parameter, through visual supervision, making the final outcome user-dependent and reliant on heuristic knowledge. The voxel size needs to be optimized as a compromise. A voxel size that is too large could result in the averaging of data and thus a loss in feature information, while a too-small voxel size may result in the final output being affected by statistical noise. To overcome this problem, Srinivasan et al.Reference Srinivasan, Kaluskar, Dumpala, Broderick and Rajan26 used a nonparametric statistical approach to estimate the density of atoms per voxel directly from the data without assuming a particular shape of the underlying distribution using what is known as the kernel density estimator (KDE) function. KDE is used to capture the contribution of each atom toward the voxel and to obtain a smooth overall density function representing the voxel.
Each atom is represented by a kernel, a symmetric but not necessarily positive function that integrates to one, with the center being representative of the region encompassed by the voxel. A Gaussian distribution is often used as an efficient kernel, with a standard deviation automatically derived from the average density of atoms. They showed that the KDEs could be used to select an optimal voxel size in an unsupervised manner to perform feature selection, in particular, refining the sharpness of an interface image (Figure 3).Reference Srinivasan, Kaluskar, Dumpala, Broderick and Rajan26
Variation in feature topology at a coherent Ni3Al/Ni interface with changing voxel sizes in units of nm. (a) 1, (b) 1.1, (c) 1.2, (d) 1.3, (e) 1.5, (f) 1.6, (g) 2, and (h) 2.5. The sharpest interface with minimal statistical error as developed through the kernel density estimator (f).Reference Srinivasan, Kaluskar, Dumpala, Broderick and Rajan26
Discovering features hidden within large volumes of data
Another paradox in APT images is that the large numbers of hits that can be actually recorded effectively masks the details that one is often interested in to solve practical materials science problems such as detecting nanoclusters or concentration gradients in the subnanometer regime. Hence there is a strong reliance on a trial-and-error approach to interrogate the image to extract interpretable features. This is usually performed by repeatedly delineating isoconcentration surfaces at different values of the concentration threshold, until the user visually determines a satisfactory result in line with prior knowledge. However, this approach bears the risk that important features buried within the sample are obscured by the high density and number of atoms being detected (in the tens to hundreds of millions). Using the principles of mathematics known as computational homology,Reference Kaczynski, Mischaikow and Mrozek27 one can find hidden structures within large data sets. This is relevant for uncovering subtleties in the spatial clustering of species. The connectivity of atoms in APT have, for instance, been quantified using a topological metric known as a Betti number, which can be used to track spatial variations in chemistry at interphase interfaces, to more clearly understand the shapes of nanoscale clusters in APT images.Reference Srinivasan, Kaluskar, Broderick and Rajan28
Defining the position of grain boundaries and measuring their composition
Isoconcentration surfaces are an appropriate way to define boundaries between two phases of distinct compositions. However, the situation is more complex for the boundaries between two grains of the same phase. In order to measure the boundary composition, it is first necessary to define the position of the boundary. Several approaches may be used.
If there is segregation to the boundary, a clustering algorithmReference Felfer, Ceguerra, Ringer and Cairney29,Reference Lefebvre, Philippe and Vurpillot30 can be used to isolate atoms in the vicinity of the boundary, and a “distance to center of mass” (DCOM) approach may then be used to create a surface along the interface.Reference Felfer, Ceguerra, Ringer and Cairney31 Here, the surface is created by defining vertices with the DCOM approach and using either a 2D Delaunay triangulation (for open topologies such as grain boundaries); or Alpha hulls (for closed topologies). The first approach creates an optimized surface with a set of triangles, named after Boris Delaunay for his work on this topic from 1934.Reference Delaunay32 The second method creates the mathematical minimum surface that surrounds selected atoms. The application of this approach to delineate a boundary with C segregation in a high-strength low-alloy steel is shown in Figure 4. Other applications of the Delaunay tessellation for APT data mining can be found in References 30, 31, and 33. Even in the case where no segregation is present, it is possible to take advantage of changes in the data density in the vicinity of grain boundaries by using an algorithm that retains only atoms in the vicinity of local maxima in density gradientsReference Samudrala, Felfer, Araullo-Peters, Cao, Liao and Cairney34 to create a suitable data set for the DCOM approach.
Generating a mesh to define an interface between two grains of the same composition with interfacial segregation. The data are from high-strength low-alloy steel, with C and Nb atoms shown in pink and orange, respectively (a) and (e). The atoms that delineate the feature (a) are filtered using (b) a Voronoi filter. A sample of atomic positions is used to create mesh vertices (c). The vertices are then moved onto the feature using “distance to center of mass” (DCOM),Reference Felfer, Ceguerra, Ringer and Cairney31 (d) and a Voronoi tessellation is used to achieve an even vertex distribution along the final surface (e). Note that Voronoi filtering consists of extracting atoms of the considered feature using a 3D mesh that is dual to its Delaunay triangulation, which is described in the text. Voronoi tessellation is mathematical partitioning of the space, which optimizes the spatial compactness around a defined set of points.Reference Aurenhammer40,Reference Du, Faber and Gunzburger41
Once a surface has been created to define the grain boundary, it is then possible to apply analysis tools to measure the composition, such as proximity histograms (proxigrams), or to map the segregation across the boundary. These data may then be directly applied to thermodynamic models to describe the behavior of the system being investigated, which is particularly useful for studying the thermomechanical processing of alloysReference Tang, Gianola, Moody and Cairney35 or the active diffusion processes during corrosion.Reference Young, Nguyen, Felfer, Zhang and Cairney36
Summary
APT is a data-rich and data-intensive characterization tool. The ability to quantitatively navigate the data landscape of APT experiments is key to fully exploit its capability for subnanometer-scale characterization. Its ability to be applied to many categories of materials, including alloys, ceramics, and semiconductors, as well as bio- and geomaterials, makes it a powerful tool for the materials scientist.
This article introduced APT reconstructions and the main limitations and artifacts associated with this technique. The geometrical considerations for the basis of current reconstruction algorithms were detailed, and the physical principles governing the spatial resolution of the instrument were presented. We reviewed studies showing that one can harness data-mining methodologies, built on mathematical foundations of statistical learning, to develop a quantitative understanding of microstructure at the nanometric level. Successful and sustained efforts in the correlation of APT with STEM help us foresee that the currently perceived limitations for the 3D characterization of materials will be surpassed in the near future.
Acknowledgments
F.V. acknowledges support from the APTITUDE project (ANR-12-NANO-0001) of the French National Research Agency. K.R. acknowledges support from the Air Force Office of Scientific Research under Grant Numbers: FA9550–12–1- 0456; FA9550–11–1-0158 and support from the National Science Foundation DMR-13–07811. C.O. acknowledges support by the Deutsche Forschungsgemeinschaft (SCHM 1182/16–1) and the BMBF (VIP 0370). He thanks G. Schmitz for his sustained support.



