I. INTRODUCTION
Optical glasses are mainly used for lenses and mirrors in optical devices which are the most often intended for telescopes, microscopes, and photographic targets (sights, collimators, and eye pieces). The main types of glasses belong to the crown and flint families. These materials are appropriate for optical transmission in a range between 380 and 2100 nm; due to their homogeneous microstructure, their low porosity and their easy machinability. As an example, a concave lens of crown combined with another convex lens in flint is known to correct chromatic aberration of an optical device. Reference Balland1,Reference Phalippou2
To optimize their performance in service and for obtaining high quality optical devices, the reflective surface must be carefully prepared to have a smooth surface and “zero” defects like pores or nano-cracks. The surface must also be flat to avoid any optical wave’s deflections. Additionally, the surface preparation process must minimize the introduction of residual stresses at the surface. Within this compulsory objective, the surface preparation process must follow specific steps. The first pre-polishing step consists of a lapping phase with agglomerate tools or abrasive particles in suspension. Reference VanderVoort3–Reference Brinksmeier, Riemer and Gessenharter7 This stage is used to eliminate the macro-geometrical defects of the as-prepared specimen and to ensure the surface flatness and the parallelism between the two opposite faces. After lapping, the optical surface is generally opaque. Consequently, the succeeding polishing step consists of mechanical polishing with sandpapers of different grades, to eliminate the micro-geometrical defects and to produce a high quality surface. Nevertheless, a variety of polishing conditions is proposed in literature to achieve optical devices after a low rate of material removal and roughness reduced to only few nanometers. Reference Pollicove and Moore8–Reference Xie and Bushan13
To study the mechanical behavior of this kind of brittle material, instrumented indentation test is one of the most convenient method for determining hardness and elastic modulus. However, under certain loading conditions, cracks can appear along the indent diagonals of a sharp indenter and their effects on the mechanical properties measurement are not clearly demonstrated. In this work, it was studied that the mechanical behavior of the crown BK7 glass using nano-, micro-, and macro-indentation loadings applying standard (monocyclic) tests, Continuous Stiffness Measurement (CSM) mode at nano scale range, multicycle indentation with constant and progressive loading at micro and macro scale ranges. The main purpose of this work is to obtain a multiscale approach of the mechanical properties of the crown glass and to establish relationships between standard tests and multicycle tests at a multiscale approach.
II. MATERIAL AND EXPERIMENTS
A. Crown borosilicate BK7 sample and surface preparation
The crown borosilicate BK7 (BS-BK7) glass is a brittle mineral glass containing mainly silica. Its composition (in wt%) is presented in Table I.
Composition of the BK7 glass under study.

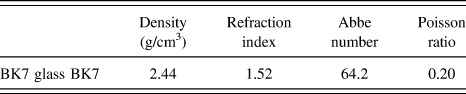
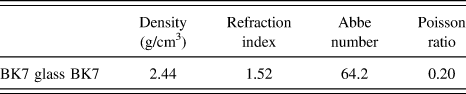
The crown borosilicate glass (BK7 glass) is the most used glass in optical design glasses, its composition remains close to that of soda lime glass with a high content of silica, soda, and calcium. The used sample had a parallelepiped shape of 28 × 24 × 6 mm dimensions. The main physical properties, i.e., density, reflective index, Abbe number, and Poisson ratio are collected in Table II.
Main physical properties of the BK7 glass used to perform the instrumented indentation tests.
The glass was lapped and afterward polished with specific pellets. For the lapping, the pellets were composed of 98% of aluminum oxide Al2O3 brown corundum type having an index of 9 following the Mohs hardness scale and 3.89 g/cm3 of density. The preparation consists of mixing 70% of alumina and 30% of epoxy resin during 10 min for obtaining a homogeneous mixture. Different grain sizes for the pellets (40, 30, 15, 7, and 3 µm) were elaborated under the same conditions of compaction load (10 KN), heating temperature (150 °C), time-duration treatment (30 s), and abrasive-binder ratio, for preparing the different successive lapping steps.
For the final polishing, the pellets of 10 mm of diameter having a mean grain size of 0.5 µm are composed of cerium oxide CeO2 type white CERI 100VO produced by Piplow and Brandt society. To optimize the pellets efficiency, three types of binder have been tested: (i) polyurethane, (ii) silica glass powder, and (iii) epoxy resin. Preliminary tests have been performed on the glass by measuring the amount of mass loss after lapping with grain sizes of 40 and 30 µm using the three types of pellets. The best results were obtained with the epoxy resin binder. This is probably due to a better bind between the abrasive grains. This high quality connection is associated with the melting temperature and the viscosity coefficient of the resin which allows a better wrapping of the grains together during the cooking. The low efficiency of the two other types of binder is associated to the low wettability of the polyurethane, leading to a poor adhesion of the hard particles. The use of the silica glass powder is probably due to its solid form as binder. Finally, the epoxy resin has been selected to produce the pellets for lapping and polishing. For lapping and polishing the samples by pellets, the rotation speed of the sample holder is of 60 rpm. During the lapping, a damaged subsurface (DSS) is formed due to the destructive contact between the abrasive grains of the pellets and the glass samples. The abrasive particles provoke the delamination of the DSS by cracking, visible at a macroscopic scale, whereas small stripes can be undetectable even by optical microscopes. Reference Lambropoulos, Xu and Fang14,Reference Suratwala, Davis, Wong, Miller, Feit, Menapace and Steele15 The material removal leads to the formation of peaks and cavities whose magnitudes depend on the pellets grain size. Note that this grain size can be measured by two techniques, i.e., transverse and angular polishing, proposed by Esmaeilzare et al. Reference Esmaeilzare, Rahimi and Rezaei16 The severity of the lapping stage can also cause apparition of residual stresses which modify directly the surface integrity and, consequently, the global behavior of the material. Reference Anunmana, Ausavice and Mecholsky17–Reference Marioge20
B. Specimen roughness
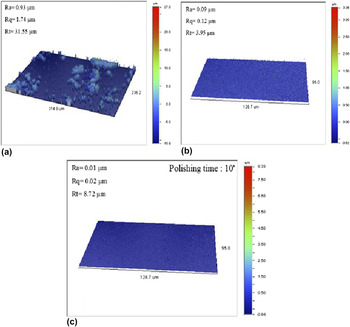
The surface roughness was measured by means of optical profilometry (Veeco Wyko NT9300, Veeco, Edina, Minnesota). The initial surface roughness before lapping is shown in Fig. 1(a). Previously to lapping and polishing, the roughness R a and R q is equal to 0.93 and 1.74 µm, respectively. At the end of the lapping stage using different grain sizes, the roughness decreases until R a = 0.09 and R q = 0.12 µm [Fig. 1(b)]. The polishing using cerium oxide pellets with a mean grain size of 0.5 µm, decreases rapidly the roughness value after only 10 min of polishing, giving a R a = 0.01 µm and R q = 0.02 µm [Fig. 1(c)].
Roughness parameters obtained from the BK7 glass sample: (a) initial state, (b) after lapping and (c) after cerium oxide pellet polishing.

C. Indentation experiments
Nano-indentation experiments were performed with a Nano Indenter XP™ (MTS Nano Instruments, Oak Ridge, Tennessee) employing a Berkovich diamond indenter. The load range of the instrument is set between 10 mN and 10 N. The samples were fixed on a metallic support using a thermoplastic adhesive (Crystal bond 590). Two types of test were performed in this instrument. First, 9 standard tests (load-unload), forming a grid (3 × 3), were performed with the same testing conditions: maximum load, 500 mN; strain rate, 0.05 s−1; time to load/unload, 30 s; and holding time, 15 s. The standard tests allow computing the hardness and the elastic modulus at the maximum indentation load. Second, 9 tests using the Continuous Stiffness Measurement (CSM) mode, the testing parameters were: harmonic displacement, 2 nm; acquisition frequency, 45 Hz; maximum penetration depth, 2500 nm. This method allows the description of hardness and elastic modulus variation with the indentation depth.
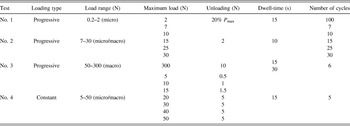
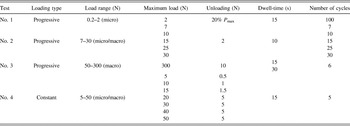
Micro-indentation experiments were carried out using a micro-hardness tester CSM 2–107 provided with a Berkovich pyramidal diamond indenter. The load range of this equipment goes from 100 mN to 20 N. The resolution for load measurement is 100 μN and for depth is 0.3 nm. In this work a continuous multicycle protocol was executed, this protocol allows the computation of the mechanical properties (hardness and elastic modulus) after each cycle. The testing conditions were 100 cycles per test, loading and unloading last 30 s each, to guarantee the same time for all the cycles. The minimum load applied at the first cycle was 200 mN and the maximum load at the last cycle was 2000 mN; the unloading limit was set to 20% of the maximum load at each cycle. The dwell-time of 15 s was imposed at the maximum load, and additionally, a dwell-time of 15 s was set at the minimum load of each cycle.
Macro-indentation experiments were performed with a Macro Indenter Zwick ZHU 2.5. The standard resolution for depth measurement system is 0.02 µm. In macro-indentation, two kinds of multicycle tests were performed using progressive load and constant load by varying the number of cycles and the range of loads. The different indentation testing conditions under micro- and macro-indentation have been collected in Table III.
Multicycle indentation testing conditions applied in micro- and macro-indentation.
III. ELASTIC MODULUS AND HARDNESS DETERMINATION BY INSTRUMENTED INDENTATION TEST
The main mechanical properties determined by instrumented indentation are the hardness, usually called H IT, and the reduced elastic modulus E R. Their calculation is based on the two following relations which are derived from the methodology originally proposed by Oliver and Pharr Reference Oliver and Pharr21 :
 $${H_{{\rm{IT}}}} = {{{P_{\max }}} \over {{A_{\rm{C}}}}}\;{\rm{and}}\;{E_{\rm{R}}} = {1 \over \beta } \cdot {{\sqrt \pi } \over 2} \cdot {S \over {\sqrt {{A_{\rm{C}}}} }}\quad .$$
Where A C is the projected contact area corresponding to the maximum applied load P max. S de notes the contact stiffness. β is a geometric correction factor equals to 1.05 according to Antunes et al. Reference Antunes, Menezes and Fernandes22 who obtained this value independently of the material by using a three-dimensional simulation of the Vickers indentation.
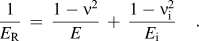
The reduced elastic modulus, E R, involves the elastic properties of the material and the indenter, as a function of their elastic modulus and Poisson ratios defined as follows:
 $${1 \over {{E_{\rm{R}}}}}\; = \;{{1 - {\nu ^2}} \over E}\; + \;{{1 - \nu _{\rm{i}}^2} \over {{E_{\rm{i}}}}}\quad .$$
Where the elastic modulus of the diamond indenter, E i, and the Poisson ratio, νi, are equal to 1140 GPa and 0.07, respectively. Reference Field and Telling23 E and ν denote the elastic properties of the tested material.
It can be noted that to obtain accurate values for the hardness H IT and the reduced elastic modulus E R, the contact area must be properly determined by taking into account the influence of the tip defect of the indenter. Unfortunately, its consideration into the calculation, especially for very low indenter displacements, is absolutely necessary since the use of indenters inevitably leads to a bluntness of the indenter tip which can be assumed to have a spherical shape. With this objective in nano-indentation, Oliver and Pharr Reference Oliver and Pharr21 proposed the following complex area function:
 $${A_{\rm{C}}}\; = \;24.5 \cdot h_{\rm{c}}^2\; + \;{C_1} \cdot {h_{\rm{c}}}\; + \;{C_2} \cdot h_{\rm{c}}^{1/2}\; + \;{C_3} \cdot h_{\rm{c}}^{1/4}\; + \ldots \;{C_8} \cdot h_{\rm{c}}^{1/128}\quad .$$
Where the coefficients C 1 through C 8 are constants, and the leading term describes a perfect pyramidal indenter. The others describe deviations from the conical geometry due to blunting at the tip. h c is the contact depth which is equivalent to the indenter-depth along which the diamond indenter rests in contact with the material according to the deformation around the indent. Its calculation is presented here-after.
The fitting coefficients are obtained on a calibration sample, often fused silica, necessitating the use of the Continuous Stiffness Measurement (CSM) mode which allows collecting numerous indentation data at the same indentation point and, consequently, a precise determination of the values of these coefficients. However, when CSM mode is not available, which is often the case on several commercial indentation instruments in the micro and macro ranges, Chicot et al. Reference Chicot, Yetna N’Jock, Puchi-Cabrera, Iost, Staia, Louis, Bouscarrat and Aumaitre24 proposed an alternative method by applying a model constructed on the base of the functions developed by Antunes et al. Reference Antunes, Cavaleiro, Menezes, Simoes and Fernandes25 and by Berla et al. Reference Berla, Allen, Han and Nix26 Chicot et al.’s model is expressed as follows:
 $${A_{\rm{C}}}\; = \;24.5 \cdot {\left[ {{h_{\rm{c}}}\; + \;{h_{\rm{b}}} \cdot {{\left( {1 - \exp \left[ { - 2{{{h_{\rm{c}}}} \over {{h_{\rm{b}}}}}} \right]} \right)}^{3/2}}} \right]^2}\quad .$$
Where the effective truncation lengths of the indenter tip, h b, can be determined by regression analysis on a known-material or estimated from microscopic observations. Reference Chicot, De Baets, Staia, Puchi-Cabrera, Louis, Delgado and Vleugels27
In micro-indentation, the model of Troyon and Huang Reference Troyon and Huang28 which consists in adding the effective truncation length of the indenter tip, h b, to the contact depth, h c, is enough accurate. This amounts to neglect the exponential term in Eq. (4). In this condition, the contact area is calculated by the following relation:
 $${A_{\rm{C}}}\; = \;24.5 \cdot {\left( {{h_{\rm{c}}} + {h_{\rm{b}}}} \right)^2}\quad .$$
Note that this relation is only valid for indenter displacements higher than approximately 100–150 µm depending on the magnitude of the tip defect dimension. In macro-indentation for indenter displacements much bigger than the dimension of the tip defect, the relation considering a perfect pyramidal indenter can be reasonably applicable:
 $${A_{\rm{C}}}\; = \;24.5 \cdot h_{\rm{c}}^2\quad .$$
On the other hand, as it has been demonstrated recently by Yetna N’Jock et al., Reference N’jock, Chicot, Ndjaka, Lesage, Decoopman, Roudet and Mejias29 the computation of the contact depth h c depends on the deformation mode around the indent, i.e., sink-in or pile-up phenomena. The distinction can be done by comparing the remnant indentation depth to the maximum indentation displacement ratio, to the limit value of 0.83. For glasses for which this ratio is lower than this critical value, sink-in phenomenon occurs during the indentation process. Consequently, the contact depth is calculated by means of the methodology developed by Oliver and Pharr Reference Oliver and Pharr21 :
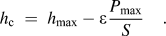 $${h_{\rm{c}}}\; = \;{h_{\max }} - \varepsilon {{{P_{\max }}} \over S}\quad .$$
Where h max is the indenter displacement reached by the indenter at the maximum applied load and ε equals to 0.75 for sharp indenters.
The typical loading and unloading curve indicating the parameters involved into the computation of the contact area used for the determination of the mechanical properties can be found. Reference Oliver and Pharr21
On the other hand, depending on the displacement measurement system of the instrument, the deflections of the load-frame can be included in the depth measurement, especially for the micro-indentation instrument used in this study. In this case, the displacement into the specimen can be accessible from the total displacement given by the instrument and the frame compliance of the instrument, C f, deriving from Eq. (1) as follows:
 $${1 \over S}\; = \;{C_{\rm{f}}} + {{\sqrt \pi } \over 2} \cdot {1 \over {\beta \cdot {E_{\rm{R}}}}} \cdot {1 \over {\sqrt {{A_{\rm{C}}}} }}\quad .$$
Note that the plot of the inverse of the unloading slope as a function of the inverse of the square root of the contact area allows the determination of the reduced elastic modulus directly from the slope of the straight line.
On the other hand H IT cannot be calculated from a standard loading curve because the contact depth involved in the contact indentation depth calculation is not accessible. Consequently, the dynamic hardness which is usually calculated from a loading curve is represented by the Martens hardness (calculated with the total (or instantaneous) penetration depth, h i corresponding to the load P i) similiar to the Vickers hardness (computed with the indent diagonal) as follows:
 $$HM\; = \;{{{P_{\max }}} \over {{A_{\rm{R}}}}}\;{\rm{with}}\;{A_{\rm{R}}}\; = \;26.43 \cdot {\left( {{h_{\max }} + {h_{\rm{b}}}} \right)^2}\quad .$$
Where A R: is the actual contact area that takes into account the influence of the tip defect. Note that for the lowest indenter displacements, Eq. (3) can be adapted by multiplying all the coefficients by 1.079 (i.e., the quotient 26.43/24.5) and in Eq. (4) by changing 24.5 to 26.43, and also, for both equations, h c should be replaced by h max to calculate the actual contact area considering the tip defect for very low indenter displacements.
IV. RESULTS AND DISCUSSION
Indentation experiments have been performed on a BK7 glass sample to determine the elastic modulus and the hardness, before and after damage resulting from cracking during indentation tests at high loads. Indeed, depending on the indentation scale of measurement, cracking and chipping have been observed around the indent for high indentation loads in the macro-indentation domain. Therefore, when no damage is observed in nano- and micro-indentation load ranges, the mechanical properties were calculated.
A. NANO-indentation
1. Standard indentation
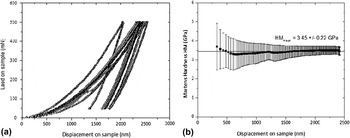
Figure 2(a) shows all the 9 load–displacement curves obtained by nano-indentation performed randomly at the surface of the specimen.
(a) Load–displacement curves obtained from a monocycle test applied on the surface and (b) Variation of the dynamic Martens hardness as function of the indenter displacement obtained by nano-indentation from the BK7 glass sample.

Even if some of them are very well super imposed, all the curves presented in Fig. 2(a) are not perfectly super imposed representing some dissimilarities at the surface of the tested material. Probably, this is related to the formation of a very thin layer on the surface sample after polishing or to the presence of heterogeneities in the material, considering that the maximum indentation depth was 2.5 µm. To calculate the mechanical properties, a calibration of the Berkovich indenter tip has been performed on fused silica to determine the fitting coefficients of the contact area function expressed in Eq. (3). In this work, it was limited as the number of coefficients of three (C 0 = 24.5; C 1 = 429 nm, and C 2 = −1292 nm3/2). On the other hand, in spite of the existing differences between the indentation curves, the obtained values for Martens hardness and elastic modulus were pretty precise, 3.28 ± 0.13 GPa, and 75 ± 2 GPa, respectively.
2. Dynamic hardness
To artificially increase the number of data, some authors Reference Chicot and Mercier30 suggested the computation of a dynamic or continuous hardness over all the loading curve by computing the hardness from each point of the indentation data (h i, P i) corresponding to the instantaneous penetration depth and load, respectively. This method which leads only to the calculation of the Martens hardness is interesting but usually overestimates the hardness number because of dwell-time (15 s) which is applied at the maximum load not considered into the computation. Depending on the creep behavior of the material, the depth continues to increase, thus increasing the contact area.
Implementing the dynamic analysis of the loading curve, the calculated dynamic hardness is supposed to be equivalent to the Martens hardness. Subsequently, to study the hardness behavior at the nanoscale range, it is computed by the Martens hardness along all the loading curve using Eq. (8), replacing (h max, P max) by each (h i, P i) point of the loading data and where A R is the contact area calculated by Eq. (3). Therefore, the Martens hardness is plotted versus the indenter displacement [Fig. 2(b)]. The curve in this figure represents the mean dynamic hardness value and its standard deviation is calculated by considering the 9 indentation curves of the standard tests.
The high standard deviation in Fig. 2(b) is due to the differences in the load–displacement curves illustrated in Fig. 2(a). However, when the indenter reaches a depth around 1 µm, the Martens hardness becomes rather constant equal to 3.45 ± 0.22 GPa which is slightly higher than the Martens hardness determined from the standard tests at the maximum indentation load. As it was previously mentioned, this difference is due to the effect of the dwell-time at the maximum load in the standard tests which tends to increase the penetration depth owing to the creep indentation phenomenon. Assuming that the additional depth due to creep is directly proportional to the applied load, we can write the following relation:
 $${{\Delta {h_{\rm{i}}}} \over {\Delta {h_{\max }}}}\; = \;{{{P_{\rm{i}}}} \over {{P_{\max }}}}\quad .$$
Where P max is the maximum indentation load at which the dwell-time is applied and which provokes an increase in depth of Δh max. Consequently, the instantaneous gap in depth Δh i is computed from the corresponding applied load P i.
Following this reasoning, the gap in depth can be added to the actual indentation depth to calculate the corrected contact area. In this condition, the recalculated Martens hardness leads to a mean value of 3.30 GPa which is similar to the Martens hardness computed at the maximum load.
3. CSM mode
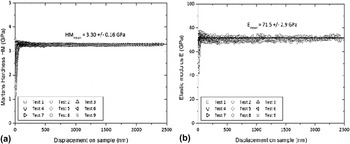
One of the most reliable methods for determining hardness and elastic modulus is the Continuous Stiffness Measurement (CSM) mode which consists to impose a harmonic oscillation of the force during loading. In this regard, the mechanical properties are obtained as a function of the indenter displacement. Usually, the instrumented hardness H IT is computed using the CSM mode, instead of Martens hardness. To validly compare the different approaches to calculate the mechanical properties, the Martens hardness is computed rather than the H IT by applying Eq. (8). Figure 3 presents the Martens hardness [Fig. 3(a)] and the elastic modulus [Fig. 3(b)] versus the indenter displacement into the sample of the surface.
(a) Martens hardness and (b) elastic modulus variations versus the indenter displacement obtained by means of CSM mode in nano-indentation on the BK7 glass sample.

In Figs. 3(a) and 3(b), the Martens hardness and the elastic modulus are constant independently on the displacement, except for the first nanometers where the tip blunting affects the measurement, usually the bounds to delimitate reliable results are taken from the calibration performed on the fused silica sample. Therefore, the Martens hardness and the elastic modulus are equal to 3.30 ± 0.16 GPa and 71.5 ± 2.9 GPa, respectively. These values are comparable to the results obtained by the standard method and the dynamic approach.
B. MICRO-indentation
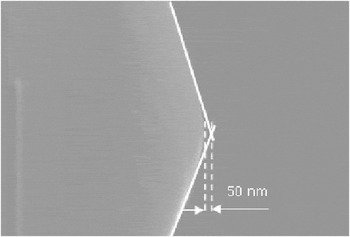
The micro-indenter CSM 2–107 does not dispose of the CSM mode, instead multi-cycle tests were performed, and therefore, Eq. (4) is applied to compute the contact area. In a previous investigation Reference Chicot, De Baets, Staia, Puchi-Cabrera, Louis, Delgado and Vleugels27 the tip defect for the Berkovich indenter was estimated by using a scanning electronic microscope at very high magnification, to accurately determine the tip defect dimension, h b. The length of the truncated indenter tip was estimated at 50 nm (Fig. 4).
Evaluation of the truncated tip length of the blunted Berkovich indenter used in micro-indentation tests by SEM analysis at high magnification.

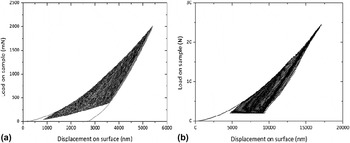
Figure 5(a) shows an example of a loading–unloading curve for multicycle tests on the BK7 glass sample. 5 tests using the multi-cycle protocol described before (No. 1, Table III) were conducted randomly on the surface sample.
(a) Load–displacement curve for a multicycle test in micro-indentation performed on the surface of the BK7 glass sample and (b) Multicycle macro-indentation curve performed on the BK7 glass sample under the following conditions: 100 cycles in progressive loading mode between 5 and 25 N with a holding time of 15 s at the maximum load of each cycle and between cycles.

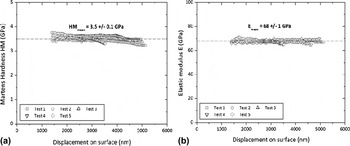
To determine the elastic modulus of the material according to Eq. (8), the inverse of the total contact stiffness is plotted against the inverse of the square root of the contact area to determine the frame compliance C f. After wards, the value of the frame compliance is used into the computation of the reduced modulus [Eq. (1)] to recalculate the elastic modulus [Eq. (2)]. Finally, following this procedure, the variations of hardness and elastic modulus as a function of displacement into the surface are represented in Figs. 6(a) and 6(b), respectively.
(a) Martens hardness HM and (b) elastic modulus E as function of the indenter displacement obtained by multicycle indentation on the BK7 glass sample.

Remarkably in Fig. 6, the hardness and the elastic modulus do not vary with displacement. Obtaining the hardness value equals to 3.5 ± 0.1 GPa and the elastic modulus equals to 68 ± 1 GPa. These results approve that multi-cycle indentation can be validly used to determine mechanical properties, at least for this material and this range of loads, where damage was not optically visible after the indentation tests. It can be noted that these values agree with those obtained at the nano-scale range.
C. MACRO-indentation
1. Progressive multi-cyclic loading
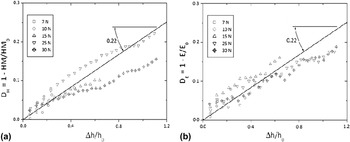
An example of the load–displacement curve for the test condition No. 2 (Table III) is shown in Fig. 5(b) at the maximum load of 25 N. Similarly, the micro-indentation tests to evaluate the mechanical behavior of the BK7 glass sample under progressive multi-cycle loading the Martens hardness and the elastic modulus are calculated at the end of each cycle. However, compared to the results obtained in micro-indentation at different ranges of load, the macro-indentation results show that the Martens hardness and the elastic modulus continuously decrease with the number of cycles. To represent this behavior, we plotted the damage coefficients defined by Lemaitre and Dufailly, Reference Lemaitre and Dufailly31 D H and D E, versus the relative penetration depth of the indenter, Δh/h 0. In a general way, these different parameters can be expressed as:
 $${D_{\rm{H}}}\; = \;1 - {{HM} \over {H{M_0}}};\;{D_{\rm{E}}}\; = \;1 - {E \over {{E_0}}}\;{\rm{and}}\;{{\Delta h} \over {{h_0}}}\; = \;{{h - {h_0}} \over {{h_0}}}\quad .$$
Where HM 0, E 0, and h 0 are the corresponding values of the parameters reached after the first cycle.
After the first cycle at 5 N, both Martens hardness and elastic modulus have a constant value independently of the maximum test load at the last cycle, i.e., HM 0 = 4 ± 0.5 GPa and E 0 = 66 ± 3 GPa. These values agree with the values obtained at the others scales of measurement. Besides, the penetration depth reached after the first cycle is constant for all the tests h 0 = 6.7 ± 0.2 µm. Figures 7(a) and 7(b) represent D H and D E as a function of the relative penetration depth Δh/h 0.
Damage coefficients: (a) D H and (b) D E as a function of the relative penetration depth of the indenter, Δh/h 0. The parameters are calculated after each cycle corresponding to multicycle progressive tests in macro-indentation (test conditions No. 2). The loads in the legend correspond to the maximum applied load at each test.

According to Fig. 7, the damage parameters increase after each cycle as a function of the relative penetration depth, Δh/h 0, demonstrating the occurrence of a phenomenon during the progressive loading, and probably cracking initiation and propagation. Also, the example of loading-displacement curve illustrated in Fig. 5(b), shows some slight discontinuities corresponding to cracking, observed by optical microscopy, as reported by Malzbender et al. Reference Malzbender, den Toonder, Balkenende and de With32 On the contrary, after micro-indentation tests we did not observe cracks in the imprints.
It is noticeable that the two damage parameters related to the Martens hardness and to the elastic modulus are close to a directly proportional relation with the relative penetration depth, Δh/h 0, expressed by the same proportionality factor of 0.22.
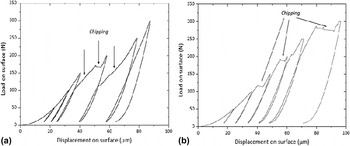
Different tests according to the test conditions No. 3 (Table III) at a maximum load of 300 N and two dwell-times (15 and 30 s) have been performed at the surface of the BK7 glass sample. Figure 8 shows multi-cycle indentation experiments performed between 50 and 300 N with a holding time of 15 s [Figs. 8(a)] and 30 s [Fig. 8(b)], the limit unloading load was fixed to 10 N.
Multicycle macro-indentation tests performed on the BK7 glasssample with 6 cycles in progressive loading mode between 50 and 300 N with a holding time of 15 s (a) and 30 s (b).

Figure 8 shows that at higher loads abrupt discontinuities are registered in the loading-displacement curves. Probably, the cracks initiating at lower forces propagate and lead to chipping, which is visible in the profile of the loading curves as a horizontal gap during loading. Chipping phenomenon starts at a certain load which changes with the test conditions, in this case with the holding time at maximum load. This result corroborates the fact that no simple generalization may be made concerning crack initiation sequences. Reference Cook and Pharr33 It is also remarkable that the damage caused by chipping seems to be less pronounced for the lower dwell-time. Indeed, only one chip scar has been observed probably corresponding to the pop-in visible around a value close to 170 N. Contrarily, for a dwell-time of 30 s, several chip scars are observable along the different edges of the imprint which have been occurred at different indentation loads, i.e., 120, 190, and 280 N corresponding to visible plates.
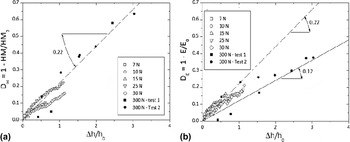
From a mathematical point of view, the same methodology described before was adopted to represent the influence of chipping on the measurement of the mechanical properties. Figures 9(a) and 9(b) show the damage parameters, D H and D E, versus the relative penetration depth, Δh/h 0. For comparison, we represent in these figures the damage parameters obtained at lowest loads [Figs. 7(a) and 7(b)]. For tests made under conditions No. 3 (Table III), HM 0 = 3.5 ± 0.1 GPa, E 0 = 69 ± 1 GPa, and h 0 = 23 ± 0.7 µm. Similarly, to the results for lower indentation loads, the proportionality factor is approximately 0.2 except for the elastic modulus for which this factor decreases until 0.12 for the higher damage.
Damage coefficients: (a) D H and (b) D E as a function of the relative penetration depth of the indenter, Δh/h 0. The parameters are calculated after each cycle corresponding to multicycle progressive tests in macro-indentation with a maximum load of 300 N (test conditions No. 3).

2. Constant multi-cycle loading
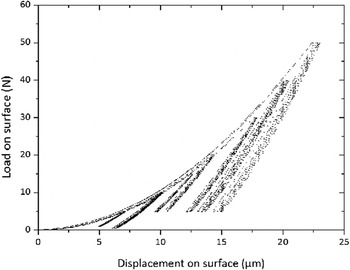
To evaluate the damage caused by multi-cycle indentation process, it was studied that the effect of a constant multi-cycle indentation mode (test conditions No. 4) which consists of applying 5 cycles under the same maximum load. Figure 10 shows a good reproducibility in the load–displacement curves, regardless the maximum load.
Multicycle macro-indentation performed on the BK7 glass sample with 5 cycles performed at constant loads between 5 and 50 N.

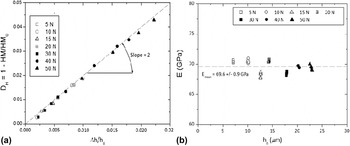
Contrary to the results obtained by applying progressive multi-cycle loading, with the constant multi-cycle loading, the elastic modulus remains constant (69.6 ± 0.9 GPa) along the whole test [Fig. 11(b)]. However, the Martens hardness value decreases since the maximum displacement increase slightly after each cycle at the maximum applied load (Fig. 10). To show this variation, the Martens hardness damage parameter (D H) is represented by the relative indenter displacement, Δh/h 0 [Fig. 11(a)].
(a) Martens hardness damage factor versus the relative indenter displacement and (b) elastic modulus versus the indentation depth at the first cycle. The indentation tests are performed under the test conditions No. 4.

Cleary a more detailed investigation is needed to understand the behavior of the BK7 glass because in multi-cycle progressive loading tests, at loads in the macro range, the formation of cracks was observed, where the elastic modulus decreases as the load increases owing to the damage becomes more severe (cracks propagation, chipping, etc). However, with multi-cycle tests at constant load this behavior is not present even in the same range of loads, which was unexpected. Then, this means that damage recognized by the initiation and propagation of cracks at loads under 50 N is possibly related to the number of cycles, and consequently, cracking initiates under certain critical stress–strain field reached at a specific number of cycles.
V. CONCLUSIONS
A multiscale analysis by instrumented indentation was performed on the BK7 glass sample to determine the hardness and the elastic modulus, using standard and multicycle indentation tests. By means of nano-indentation and micro-indentation tests, Martens hardness and elastic modulus were estimated to be approximately 3.5 and 70 GPa, respectively, and they are apparently independent of the testing conditions. No visible cracks were found at these scales of measurement. These results demonstrate that multicycle tests in micro-indentation are an alternative to the CSM method.
On the contrary, the initiation of radial cracks is observed after multicycle macro-indentation tests (progressive loading), these cracks propagate and they are transformed in chipping at higher loads. The formation and propagation of cracks are represented by small discontinuities in the loading curves; chipping phenomenon is observed as abrupt changes in the penetration depth. Nevertheless, Martens hardness and elastic modulus were computed for each cycle, showing a decrease of these two properties with the increasing of load. Therefore, it was studied that the variation of the damage parameters related to the actual mechanical properties (Martens hardness and elastic modulus) with the relative penetration depth, these parameters describe a linear variation thus permitting a connection with the related theory of the cracks formation during the indentation process.
The elastic modulus by means of macro-indentation multicycle tests at constant load is around 70 GPa, similar to the values in nano- and micro-indentation. However, the Martens hardness slightly decreases and the damage parameter varies linearly with the relative indentation depth. At the macroscale range of loads, the response of the material is affected by the number of cycles, in relation to the damage caused by the repeated indenter penetration at each cycle.