Introduction
Plutella xylostella is considered the most harmful pest of cultivated crucifers worldwide (Garrad et al., Reference Garrad, Booth and Furlong2016; Shakeel et al., Reference Shakeel, Farooq, Nasim, Akram, Khan, Jaleel, Zhu, Yin, Li, Fahad, Hussain, Chauhan and Jin2017; Steinbach et al., Reference Steinbach, Moritz and Nauen2017; Jaleel et al., Reference Jaleel, Saeed and Naqqash2020). It targets a wide range of wild and cultivated species of Brassicaceae and possesses a remarkable ability to adapt to various climatic conditions, which has led to its classification as a cosmopolitan insect (Talekar and Shelton, Reference Talekar and Shelton1993; Shakeel et al., Reference Shakeel, Farooq, Nasim, Akram, Khan, Jaleel, Zhu, Yin, Li, Fahad, Hussain, Chauhan and Jin2017).
In terms of economic impact, Plutella xylostella larvae are particularly harmful to seedlings, as they feed on the apical meristem, leading to the formation of multiple heads in cabbage or the disruption of normal flower development in broccoli and cauliflower (Annecke and Moran, Reference Annecke and Moran1982). Beyond leaves and flowers, the larvae of this pest also target oilseed rape pods during fruit set, causing poor pod filling and reduced yields (Lamb, Reference Lamb1989). In cabbage, once the plant has formed a head, the larvae typically damage the outer leaves, which are discarded at harvest and therefore may not result in significant economic losses (Mustata, Reference Mustata1992). However, during heavy infestations, the larvae also attack the inflorescences in broccoli and cauliflower, as well as the cabbage head, leading to rejection of the produce. Consequently, damage caused by P. xylostella affects not only crop yield but also product quality (Talekar and Yang, Reference Talekar and Yang1991). Economically, it can result in significant crop yield losses, both directly and indirectly, throughout the production chain (Verkerk and Wright, Reference Verkerk and Wright1996). According to Furlong et al., (Reference Furlong, Wright and Dosdall2013) in 2012 the global cultivation area for Brassica vegetable crops between 1993 and 2009 expanded by 39%, reaching an estimated 3.4 million hectares. This expansion was accompanied by intensified farming practices, leading to a 27% increase in cabbage yields. Recent estimations account for a massive 33.8 % increase in the production of brassica vegetable crops for the period 2000–2022 from 68.1 to 91.1 million tonnes, but since 2022 the production has maintained constant at an average of 89.7 tonnes per annum (FAO, 2024a). Top producers of cabbage were China (35.0 million tonnes), India (9.3 million tonnes), and Russia (2.6 million tonnes) (FAO, 2024b). Due to advancements in production and yield, the combined value of cabbage, cauliflower, and broccoli reached $32.3 billion USD in 2020, tripling its previous worth (FAO, 2024a), highlighting their significant role in global nutrition and food security. These shifts have significantly altered many local landscapes (Furlong et al., Reference Furlong, Spafford, Ridland, Endersby, Edwards, Baker, Keller and Paull2008) and present new challenges for managing diamondback moth populations (Schellhorn et al., Reference Schellhorn, Bellati, Paull and Maratos2008). Farmers routinely use chemical control in order to reduce yield losses causde by P. xylostella, mainly because of the availability of relatively cheap insecticides (Shakeel et al., Reference Shakeel, Farooq, Nasim, Akram, Khan, Jaleel, Zhu, Yin, Li, Fahad, Hussain, Chauhan and Jin2017). However, chemical control has proved ineffective in some cases, with even 20 insecticide applications per crop cycle failing to reduce yield losses in this crop (Pérez et al., Reference Pérez, Alvarado, Narváez, Miranda, Hernández, Vanegas, Hruska and Shelton2000). In some cases, it is common for farmers to make three (Castelo Branco and Gatehouse, Reference Castelo Branco and Gatehouse2001) or even four insecticide applications per week (Oliveira et al., Reference Oliveira, Siqueira, Oliveira, Silva and Michereff Filho2011). This intensive use of insecticides can select for insecticide-resistant populations, as has been observed in P. xylostella (Sayyed and Wright, Reference Sayyed and Wright2006; Khaliq et al., Reference Khaliq, Attique and Sayyed2007; Jaleel et al., Reference Jaleel, Saeed and Naqqash2020).
The presence of P. xylostella has been documented across most of Argentina, from the northern part of the country to the southernmost province of Tierra del Fuego (Ríos de Saluso et al., Reference Ríos de Saluso, Muñoz, Martinelli and Galussi1989; Pastrana, Reference Pastrana2004; Pastrana et al., Reference Pastrana, Di Iorio, Navarro, Chalup, Villagrán, Cordo, Logarzo, Braun and Di Iorio2004; Montero et al., Reference Montero, Vignaroli and Lietti2007b; Colomer et al., Reference Colomer, Castillo, Iriarte and Villegas2010). Three distinct regions with varying probabilities of occurrence have been identified: (1) a core distribution area in the northeast and central-east, where the species persists year-round; (2) a southwestern region, where it exhibits seasonal behaviour with annual migrations; and (3) an intermediate zone between these two regions, where year-round persistence is possible but conditions are less favourable for its development (Grilli et al., Reference Grilli, Pecorari, Bruno, Dardo, Diana, Mahia and Elio2015; Lietti et al., Reference Lietti, Grilli, Fernandez and Espinza Gavilanez2020). In Argentina’s central-eastern region, Brassicaceae crops are cultivated year-round, with wild Brassicaceae also present throughout the year. As a result, the seasonality observed in P. xylostella within this region cannot be attributed to seasonal variations in food availability (Campos et al., Reference Campos, Schoereder and DeSouza2006; Lietti et al., Reference Lietti, Grilli, Fernandez and Espinza Gavilanez2020).
The area around the city of Córdoba is the region with the most productive soil under gravity irrigation in Argentina. It concentrates more than 3000 ha of horticultural farms in two areas: the northeastern area with about 2600 ha and the southern area with about 600 ha (Giobellina, Reference Giobellina and Coordinadora Beatriz2017). Crucifer crops are produced regularly throughout the year, and Plutella xylostella is by far the most important pest of this crop (Grilli et al., Reference Grilli, Pecorari, Bruno, Dardo, Diana, Mahia and Elio2015). Although no published data on losses in Argentina have been recorded, the situation is likely similar. The annual costs of controlling this lepidopteran with pesticides remain substantial with an estimate of 4 billion dollars worldwide (Talekar, Reference Talekar1992; Shelton et al., Reference Shelton, Sances, Hawley, Tang, Boune, Jungers, Collins and Farias2000; Shakeel et al., Reference Shakeel, Farooq, Nasim, Akram, Khan, Jaleel, Zhu, Yin, Li, Fahad, Hussain, Chauhan and Jin2017).
The high incidence of P. xylostella can be partly attributed in some areas to the absence of natural enemies and the species’ high capacity to develop resistance to insecticides (Lim, Reference Lim1986; Talekar and Shelton, Reference Talekar and Shelton1993; Shakeel et al., Reference Shakeel, Farooq, Nasim, Akram, Khan, Jaleel, Zhu, Yin, Li, Fahad, Hussain, Chauhan and Jin2017). Nevertheless, the study of factors affecting P. xylostella density and population dynamics is crucial for the development of local management strategies. Among these factors, temperature is recognised as one of the environmental factors affecting insect development and survival (Hallman and Denlinger, Reference Hallman, Denlinger, Hallman and Denlinger1999). Most insects cannot endure low temperatures due to their inability to maintain a stable internal balance of salt and water ions in their organisms (Hallman and Denlinger, Reference Hallman, Denlinger, Hallman and Denlinger1999).
Temperature is a key climatic factor that exerts profound effects on insects, influencing their activity, population dynamics, and imposing limits on various biological activities within this group (Saeed et al., Reference Saeed, Jaleel, Naqqash, Saeed, Zaka, Sarwar, Ishtiaq, Qayyum, Sial and Batool2018). The impact of temperature on insects can be estimated through specific rate functions that influence reproduction, population growth, development, and survival (Jervis and Copland, Reference Jervis and Copland1996; Roy et al., Reference Roy, Brodeur and Cloutier2003). Various models that depend on temperature have been used to outline the relationship between temperature and insect development (Brière et al., Reference Brière, Pracos, Le Roux and Pierre1999; Roy et al., Reference Roy, Brodeur and Cloutier2002; Golizadeh et al., Reference Golizadeh, Kamali, Fathipour and Abbasipour2007). Understanding the correlation between temperature and the rates of development and reproduction is crucial for grasping population dynamics (Golizadeh et al., Reference Golizadeh, Kamali, Fathipour and Abbasipour2009). This understanding enables us to elucidate how local insect populations adapt to climatic conditions. Based on this information, we can predict developmental times, dormancy periods, or migration patterns (Nechols et al., Reference Nechols, Tauber, Tauber, Masaki, Huffaker and Gutierrez1999; Roy et al., Reference Roy, Brodeur and Cloutier2002), as well as assess population growth capacity (Southwood and Henderson, Reference Southwood and Henderson2000). In practical terms, these studies serve the purpose of predicting outbreaks in pest species, estimating the probability of extinction, and analysing population stability and structure (Vargas et al., Reference Vargas, Walsh, Kanehisa, Jang and Armstrong1997).
While the role of temperature in the development of P. xylostella has been studied in different places (Sarnthoy et al., Reference Sarnthoy, Keinmeesuke, Sinchaisri and Nakasuji1989; Shirai, Reference Shirai2000; Liu et al., Reference Liu, Chen and Zalucki2002; Mohandass and Zalucki, Reference Mohandass and Zalucki2004; Golizadeh et al., Reference Golizadeh, Kamali, Fathipour and Abbasipour2007; Marchioro and Foerster, Reference Marchioro and Foerster2011; Shakeel et al., Reference Shakeel, Farooq, Nasim, Akram, Khan, Jaleel, Zhu, Yin, Li, Fahad, Hussain, Chauhan and Jin2017; Saeed et al., Reference Saeed, Jaleel, Naqqash, Saeed, Zaka, Sarwar, Ishtiaq, Qayyum, Sial and Batool2018; Jaleel et al., Reference Jaleel, Saeed and Naqqash2020), the thermal thresholds can differ across different P. xylostella populations (Lee and Elliott, Reference Lee and Elliott1998; Gomi et al., Reference Gomi, Inudo and Yamada2003; Jaleel et al., Reference Jaleel, Saeed and Naqqash2020) mainly due to adaptations of those populations to local conditions (Liu et al., Reference Liu, Chen and Zalucki2002; Chen and Kang, Reference Chen and Kang2004; Bahar et al., Reference Bahar, Soroka, Grenkow and Dosdall2014; Shakeel et al., Reference Shakeel, Farooq, Nasim, Akram, Khan, Jaleel, Zhu, Yin, Li, Fahad, Hussain, Chauhan and Jin2017; Saeed et al., Reference Saeed, Jaleel, Naqqash, Saeed, Zaka, Sarwar, Ishtiaq, Qayyum, Sial and Batool2018; Jaleel et al., Reference Jaleel, Saeed and Naqqash2020). For example, in a very detailed work, Honék (Reference Honék1996) showed that there is a decline in the minimum temperature required for P. xylostella development in increasing geographical latitudes.
In South America, there is an incomplete knowledge of the parameters related to temperature for P. xylostella local populations. The most detailed study, on this regard, was made by Marchioro and Foerster (Reference Marchioro and Foerster2011), in which they described the upper and lower temperature thresholds for Brazilian populations of P. xylostella and estimated the number of generations of the pest for tropical and subtropical regions of Brazil. In this manuscript, we evaluated fecundity, fertility, and the temperature thresholds for the development and survival of Plutella xylostella populations from central Argentina. Furthermore, a map was generated, depicting the potential number of generations of this pest across central Argentina.
Materials and methods
Laboratory rearing of P. Xylostella
Larvae and pupae were collected from cabbage plots located in the horticultural region surrounding Córdoba city, central Argentina (Site A: 31.297867° S, 64.085761° W and Site B: 31.510265° S, 64.180227° W) (fig. 1). The collection took place during the spring of 2022. Immature stages were carefully removed from cabbage plants using a small paintbrush, transferred to the laboratory, and individually placed into Petri dishes. These dishes, containing the larvae, were maintained in rearing chambers (Ingelab, Mod. I – 50 PFH) set at 23°C and 60% (±5) relative humidity. After moulting into adults, the insects were released into cages containing rapeseed seedlings.
Horticultural area of around the city of Córdoba in central Argentina where the individuals for the study were collected (sites A and B).

The rapeseed seedlings with the adults were maintained under the same conditions as the larvae brought in from the field. Plutella xylostella eggs of this second generation were collected from cages containing oilseed rape seedlings and individually placed on a piece of cabbage leaf, as this is the most commonly cultivated brassica in the region. Each egg was placed in a Petri dish to monitor its development under five different temperature treatments within the rearing chambers metioned previously: 5, 15, 20, 25, and 30°C, with a relative humidity of 60% (±5%). The humidity levels of the treatments fell within the range of relative humidity that does not affect the emergence rate of P. xylostella (Guo and Quin, Reference Guo and Quin2010). A total of 1,000 eggs were used in this experiment. Each treatment consisted of 200 eggs, divided into five replicates of 40 eggs each (i.e. 200 eggs per temperature treatment). We employed constant temperatures based on previous studies (Marchioro and Foerster, Reference Marchioro and Foerster2011) as results obtained under constant temperatures provide a clear and simple baseline for interpreting how development varies with temperature and many practical applications (such as pest warning systems) use approximations based on degree days, which are more easily calculated from temperature data (Pruess, Reference Pruess1983). The selected temperature range reflects the climatic conditions of the study area (Servicio Meteorológico Nacional, 1992). The development of the individuals was monitored daily from the moment the eggs were placed in the Petri dish until an adult P. xylostella emerged. The development time of each stage was recorded for all individuals across the five tested temperatures. The duration of the pupal stage was determined by the emergence of the adult. The developmental rate (1/number of days) was calculated based on the number of days spent in each developmental stage.
For the larval stage, the developmental rate of each stage was recorded, identified by the moult marking the transition to the subsequent stage. This transition between instars was determined by the presence of the exuviae of the cephalic capsule. Due to the difficulty of detecting and observing these exuviae in the early instars, this technique was supplemented by taking longitudinal measurements of each larva and observing the physical characteristics of each instar to confirm that moulting had occurred, in line with the traits described by Ecole and colleagues (Ecole et al., Reference Ecole, Dos Anjos, Michereff Filho and Picanço1999). Laboratory conditions were similar to those previously described for the different temperature treatments.
Fecundity and fertility estimations
To measure fecundity, pairs of newly emerged adult individuals from pupae obtained from the base population were used. A virgin female and a virgin male were selected and placed in a jar with a 4 cm diameter cabbage leaf disc, cut using a steel hole punch, to allow mating and egg-laying by the females. Females were kept at the same thermal treatments employed in the survival analysis. A cloth was placed over the mouth of the glass jar as a lid to allow air flow, secured with an elastic band to facilitate opening and closing the jar. The cabbage discs were replaced daily, and all the eggs laid over 24 hours were counted. This procedure was repeated until the death of the female. Pairs were kept under each thermal treatment (40 pairs per treatment), and each container was labelled with the temperature and pair number. Fecundity at each temperature was determined by comparing the number of eggs laid by each female at different temperatures using a generalised linear model. Temperature was set as a fixed factor and number of layed eggs as response variable, a Poisson model with a log link function was employed. A posteriori tests were performed if necessary. From the total number of eggs found in the fecundity experiments, the proportion of fertile eggs laid on the cabbage disc in the Petri dish was recorded. To prevent the eggs from drying out and to facilitate hatching, a piece of damp cotton wool was placed in each Petri dish according to the technique used by Girard et al., (Reference Girard, Bertolaccini, Arregui, Favaro and Curis2012). Fertile eggs were those that hatched, and larvae could be observed, while non-hatched eggs were counted as infertile. The average number of fertile eggs per female at each temperature was compared using a generalised linear model. Temperature was set as a fixed factor and number of layed eggs as response variable, a Poisson model with a log-link function was employed. A posteriori tests were performed if necessary.
Survival analysis
The survival analysis was performed employing a Kaplan–Meier test. The Kaplan–Meier test is a statistical approach for estimating and comparing survival probabilities using Kaplan–Meier survival curves. This method is widely used in survival analysis to evaluate and visualise how long subjects survive before experiencing a particular event (Altman, Reference Altman and Altman1991). Survival curves were constructed for each temperature and compared using the Kaplan–Meier survival function (Kaplan and Meier, Reference Kaplan and Meier1958). The number of individuals classified as live, dead, or censored (i.e. individuals lost or remaining indefinitely in the same developmental stage) was recorded for each larval stage. Survival data were tabulated and analysed using the Kaplan–Meier test in R software (R Core Team, 2023).
Development rate modelling
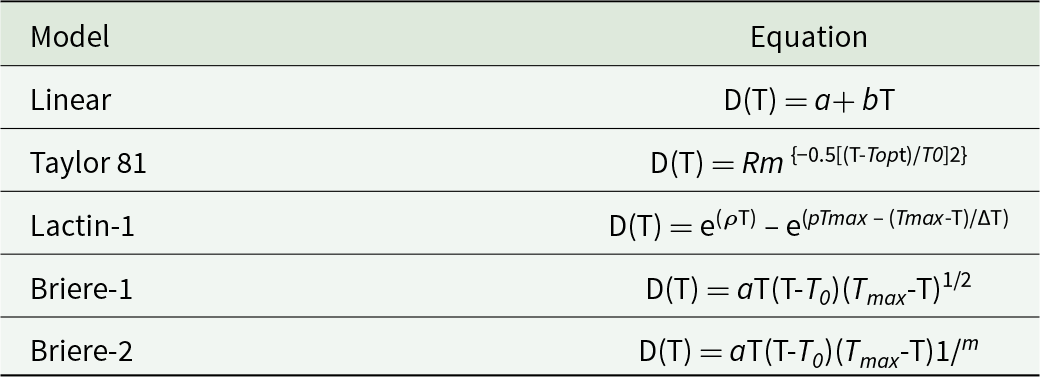
To predict the development of P. xylostella according to temperature, the rate of development (1/development time) was documented for individual instances. Based on this, developmental models were fitted to determine the best explanation for the data obtained. To ascertain biologically significant parameters, we applied a linear model (specifically for the ascending development stage) and five non-linear models, as detailed in table 1.
Development time (days) for each stage of the Plutella xylostella life cycle at five temperatures (mean ± standard error)

* Indicates individuals who died during this stage.
To precisely estimate the coefficients of linear regression, only the linear segment of the temperature–development relationship was considered. Utilising the parameters derived from the linear regression, the lower temperature threshold (T0) and thermal constant (K) were respectively computed using the x-intercept method (T0 = −a/b) and the reciprocal of the slopes (K = 1/b). In the non-linear models introduced by Briere and Pracros (Reference Briere and Pracros1998), the optimum temperature (Topt) was calculated by employing T0 and the upper temperature threshold following the method described by Marchioro and Foerster (Reference Marchioro and Foerster2011). Non-linear models are commonly used in insect development modelling due to the unique biological and environmental relationships that influence insect growth and development (Rebaudo and Rabhi, Reference Rebaudo and Rabhi2018). The assessment of each mathematical model was predicated on its accuracy in describing the data. Commonly employed statistics for this purpose encompass the coefficient of determination (R 2) and residual sums of square (RSS), indicating superior fits with higher and lower values, respectively (Aghmad, Reference Aghmad1988; Roy et al., Reference Roy, Brodeur and Cloutier2002). Additionally, the Akaike information criterion (AIC) was utilised as an auxiliary parameter to gauge the adequacy of fit for the tested mathematical models. These models are valuable for reliably predicting the seasonal evolution of insects and serve as tools in integrated pest management (IPM) (Marco, Reference Marco2001). The fitting of the different models was performed using Statistica software (StatSoft, (2011).
Number of generations
The assessment of temperature’s impact on the population dynamics of P. xylostella involved considering the number of moth generations. This count was determined using cumulative degree-days via the double sine method. This technique involves creating a sine curve based on daily minimum and maximum temperatures, calculating the degree-days by measuring the area between the curve and a specified threshold (Herms, Reference Herms, Krischik and Davidson2004). The daily temperature data from all the meteorological stations for the last 12 years were provided by the National Meteorological Service of Argentina (Servicio Meteorológico Nacional, 1992). We employed the daily minimum and maximum temperatures for the period between August and December as this is the period with higher activity of P. xylostella in our region, based on our previous experience in the field (Grilli et al., Reference Grilli, Pecorari, Bruno, Dardo, Diana, Mahia and Elio2015; Espinoza Gavilanez and Grilli, Reference Espinoza-Gavilanez and Grilli2019; Grilli and Espinoza Gavilanez, Reference Grilli and Espinoza Gavilanez2021).
Mapping the number of generations of P. xylostella for Argentina
The linear model was employed to estimate the cumulative degree-days necessary for complete development. Using information from the National Meteorological Service of Argentina (1992) on daily minimum and maximum temperatures spanning the past 12 years across 47 meteorological stations across the central area of Argentina, we generated a map showing the number of days per generation for this area for the August to December period. This map was created through ordinary kriging (Isaaks and Srivastava, Reference Isaaks and Srivastava1989) using Surfer software (Surfer, Reference Surfer2018).
Results
Estimation of the survival and speed of development of the different stages of P. xylostella was conducted. Development time of each stage was variable between the tested temperatures. Individuals failed to complete the development at 5 and 30°C, not surpassing the larval stage 2. At 5°C, the individuals lived almost 6 days as larvae 1 and only 1 day at 30°C (table 2). At the other tested temperatures, individuals completed their cycle but showed different developmental times. At 15°C, the egg-adult cycle lasted almost 34 days (mean value), while at 23 and 25°C, the cycle was shorter, lasting almost 20 and 21 days, respectively (table 2).
Mathematical models employed to describe the relationship between temperature and development rate of Plutella xylostella in the horticultural area of Córdoba city in Argentina

*In linear regression, parameters a and b are the intercept and slope and t is the temperature. In Brière-1 and Brière-2 models, a and m are equation constants, T 0 and T max are respectively the lower and upper temperature threshold. In the Taylor model, R m is the maximum development rate. In Lactin-1 model, ρ and ∆ are equation constants. In Polynomial model, a, b, c, d and e are equation constants.
Fecundity and fertility
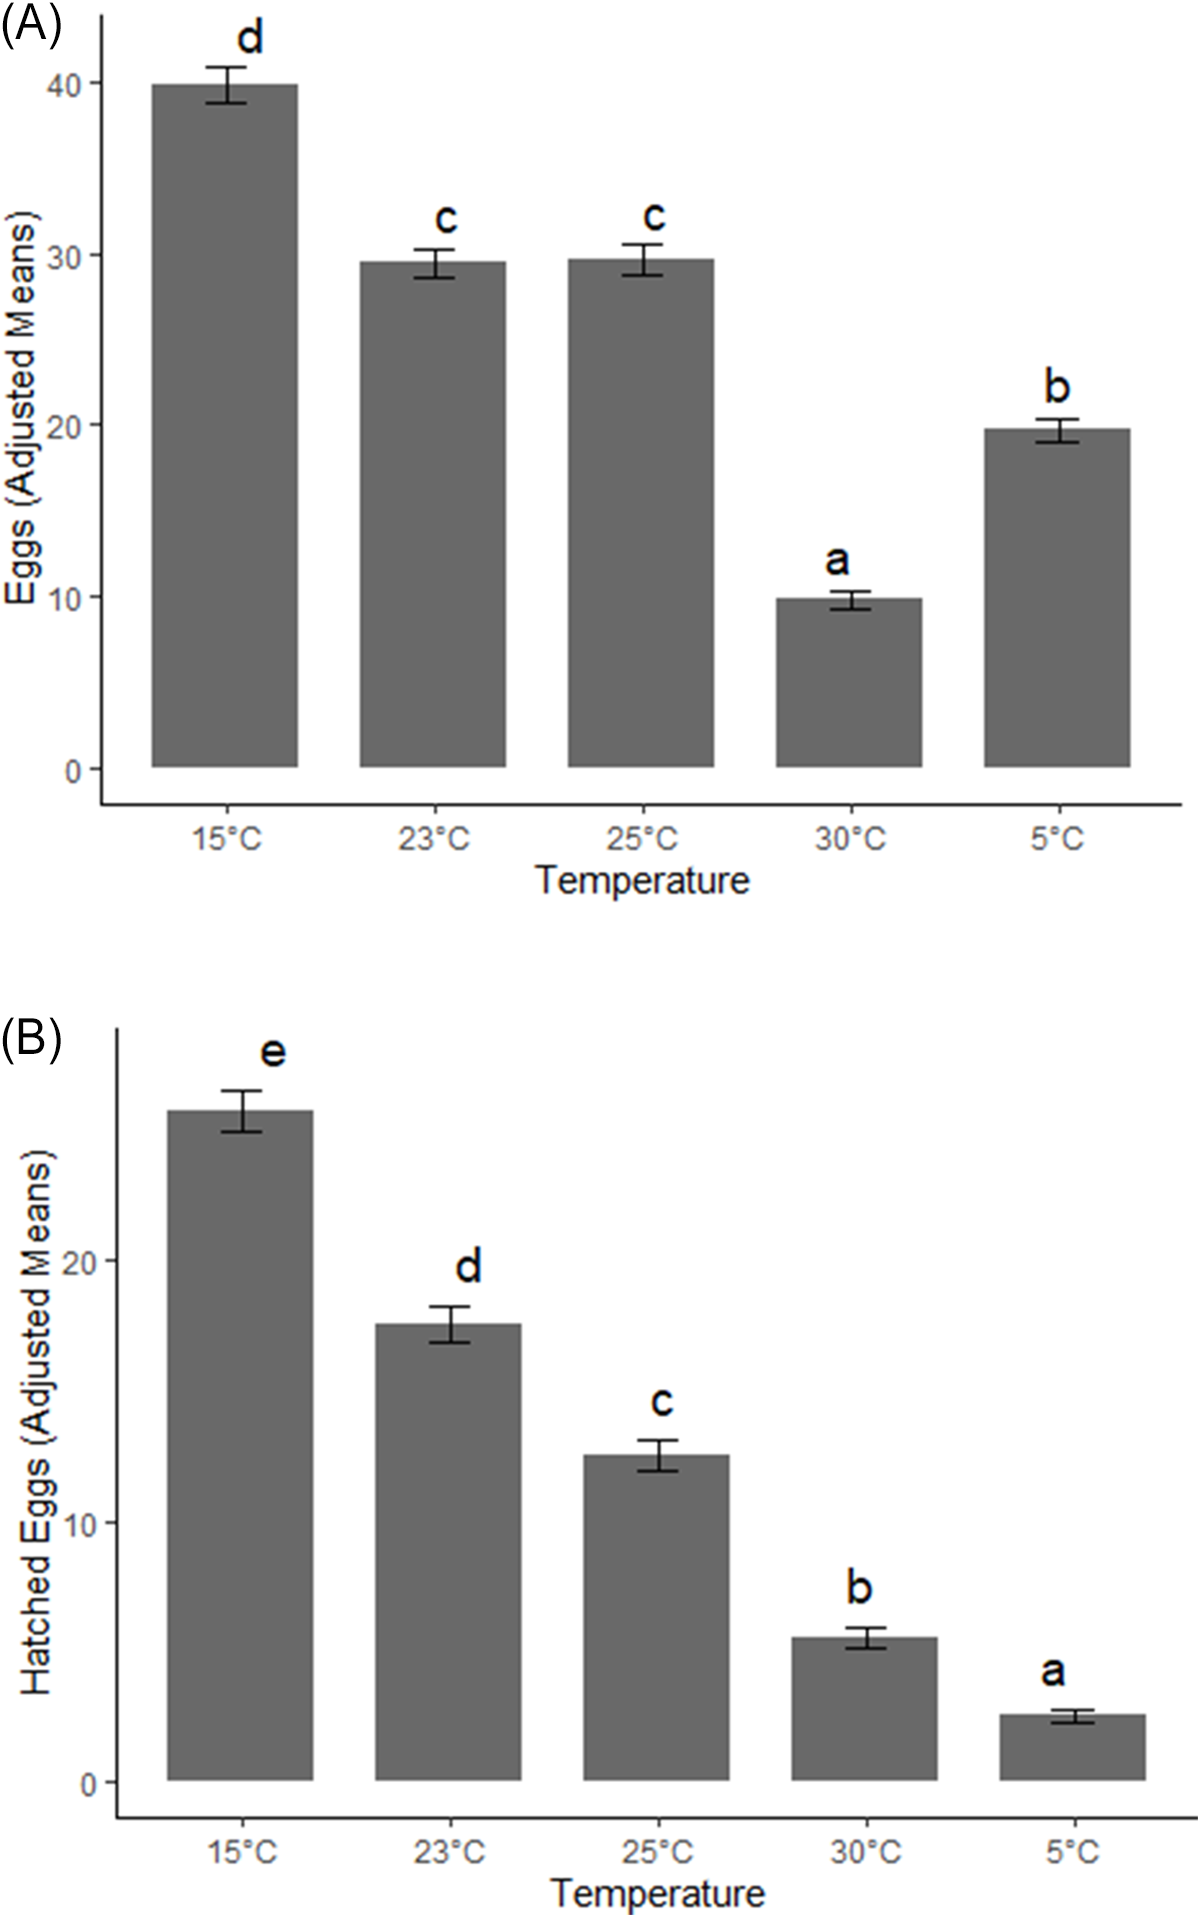
Statistically significant differences were found in the fecundity of females, expressed as the number of eggs laid per female, at different temperatures (p < 0.01). At 5°C, females laid an average of 19.73 (SE: 0.70) eggs, with post-hoc tests indicating that these values were significantly different from all other temperature treatments. The lowest number of eggs was laid at 30°C (9.85, SE: 0.49 eggs), while the highest number was laid at 15°C (39.83, SE: 0.99, eggs). No statistical difference was observed between the number of eggs laid at 23°C (29.45, SE: 0.85 eggs) and 25°C (29.62, SE: 0.86 eggs) (fig. 2A).
A posteriori comparisons (LSD fisher) of fecundity (A) and fertility (B) in Plutella xylostella. Different letters indicate statistically significant differences between treatments.

Differences were also observed in female fertility, represented as the number of fertile eggs per female at different temperatures (p < 0.01). Significant differences were observed when comparing the number of eggs hatched at different temperatures. Fertility values at 5°C were very low (2.52, SE: 0.25 hatched eggs). Meanwhile, at 30°C, twice as many eggs hatched (5.4, SE: 0.37 fertile eggs per female), with significant differences between these two temperatures. The highest number of hatched eggs was observed at 15°C (25.77, SE: 0.80 eggs). Significant differences were also found at 23 and 25°C, with mean hatch rates of 17.57, SE: 0.56 and 12.55, SE: 0.66 eggs, respectively (fig. 2B).
Survival
The Kaplan–Meier analysis demonstrated a significant variance in the survival rates of P. xylostella across different temperatures. At 30°C half of the population perishes within 4 days and all larvae fail to reach stage 3 before 6 days. Conversely, the longest developmental period, with a maximum value spanning over 40 days from egg to adulthood is observed at 15°C. However, the highest survival duration occurs at 23°C. At 5°C, no individuals survive to adulthood, but they manage to survive for over 30 days as immatures (fig. 3).
Probability of survival estimated by the Kaplan–Meier method for immature stages of Plutella xylostella at different temperatures.

Across all maintained temperatures, distinct survival differences exist between stages (p < 0.05). At 5°C, the egg stage prolongs to 19 days for completion. The first larval instar (Larva 1) experiences a significant drop in survival, decreasing to 40% by the second day and approaching zero by the eighth day. Larval instar 2 shows a maximum survival of only 4 days, with no progression to the subsequent stage (fig. 4A). At 15°C, the egg stage reaches 50% survival by day 7 but decreases to 10% by day 9. Larval instar 1 indicates a minimum survival of 15% from day 8 onwards, with some individuals transitioning to the next stage even on day 14. Although larval instar 2 survival curve resembles instar 1, the survival probability is higher (23.6%). Nearly all individuals progressing to larval instar 3 (except one in larval instar 4) successfully reach adulthood, resulting in a 100% survival rate from that stage onwards. The adult stage shows a 100% survival rate, but only for a single day (fig. 4B), as individuals were removed from the trial 24 hours after reaching adulthood (fig. 4B). At 23°C, the egg survival probability decreases by 50% from day 2 onwards, reaching zero by day 8. In larval instar 1, 60% transition to the next stage. Larval instar 3 witnesses an 85% survival rate, while instar 4 achieves a 100% survival probability. Eighty-five percent of individuals progressing to the pupal stage complete their development as adults (fig. 4C). At 25°C, the egg stage initially exhibits a high survival rate for the first 4 days, sharply declining afterward. Among the larval instars, larva 1 demonstrates the lowest survival rate, with 45% survival on the second day. Instar 2 requires longer development compared to instar 1, resulting in an increased survival rate. Larval instar 4 reaches a 50% survival rate. Individuals transition to pupae with a 100% chance of reaching adulthood (fig. 4D). At 30°C, the egg stage displays the highest survival rate, with 50% of individuals surviving for at least 3 days. Despite this, 49.8% of the trial’s individuals perish at this stage. In instars 1 and 2, the initial 50% survival declines on the first day, and by the third day, the survival probability for the remaining individuals drops to zero, preventing progression to instar 3 (fig. 4E).
Probability of survival estimated by the Kaplan–Meier method for each of the stages of Plutella xylostella from the study area at different temperatures. A: 5 °C; B: 15 °C; C: 20 °C, D: 25 °C, E: 30°C.

Model evaluation
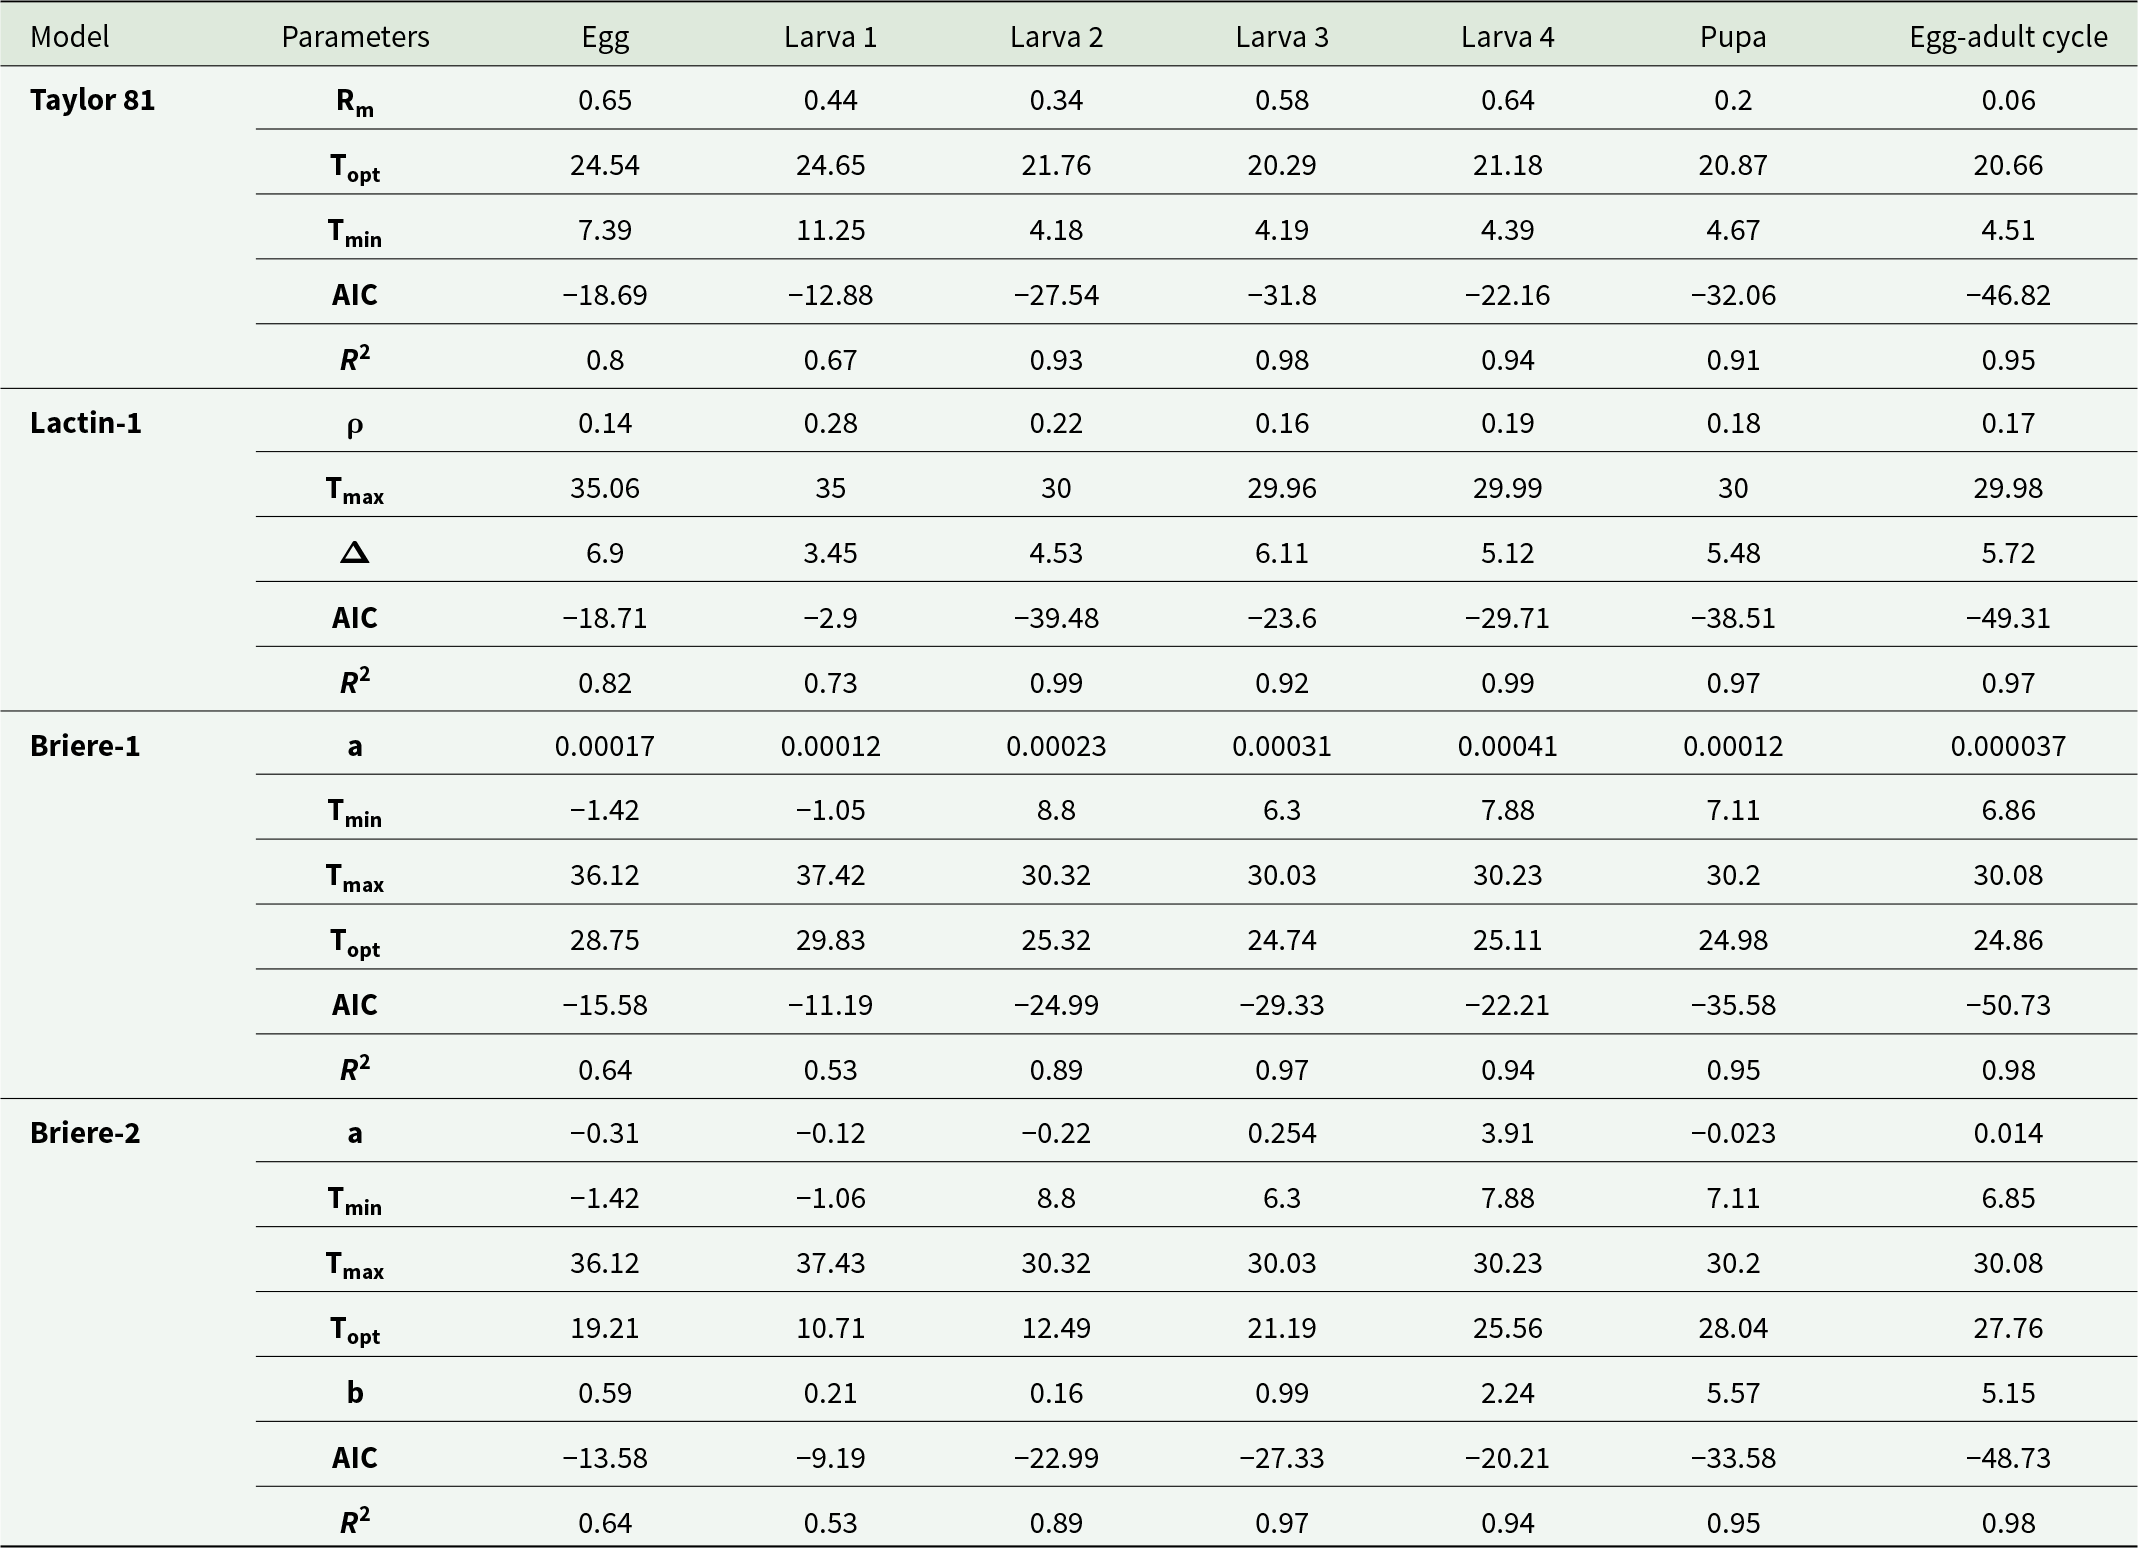
The linear regression for the whole life cycle of P. xylostella using only the ascending part of the development curve showed a good fit (R 2 = 0.96, p = 0.0005). Based on the linear regression, the thermal constant k estimated was 342 and the lower temperature threshold was 6.33°C. Therefore, P. xylostella populations in our study area required 342 degree-days above the lower threshold of 6.33 °C to complete their cycle from egg to adult. When analysing the relationship between temperature and development rate of the different stages of our population of P. xylostella, we found that the models employed varied in their fit to describe this relationship (table 3). Although all the models showed varied performances describing the development of the different stages, based on the AIC and R 2, the best models were Brière (1 and 2) and Taylor (table 3). Nevertheless, in terms of biological information, Brière models were preferred as they provide a minimum and a maximum temperature for the development of each stage of P. xylostella cycle in our region (table 3).
Fitted coefficients and goodness-of-fit indices for the four non-linear models describing the relationship between temperature and the development rate of Plutella xylostella in the city of Córdoba

In the Taylor model, Rm is the maximum development rate. In Lactin-1 model, ρ and ∆ are equation constants. In Brière-1 and Brière-2 models, a and b are equation constants, T0 and Tmax are respectively the lower and upper temperature threshold.
Number of generations
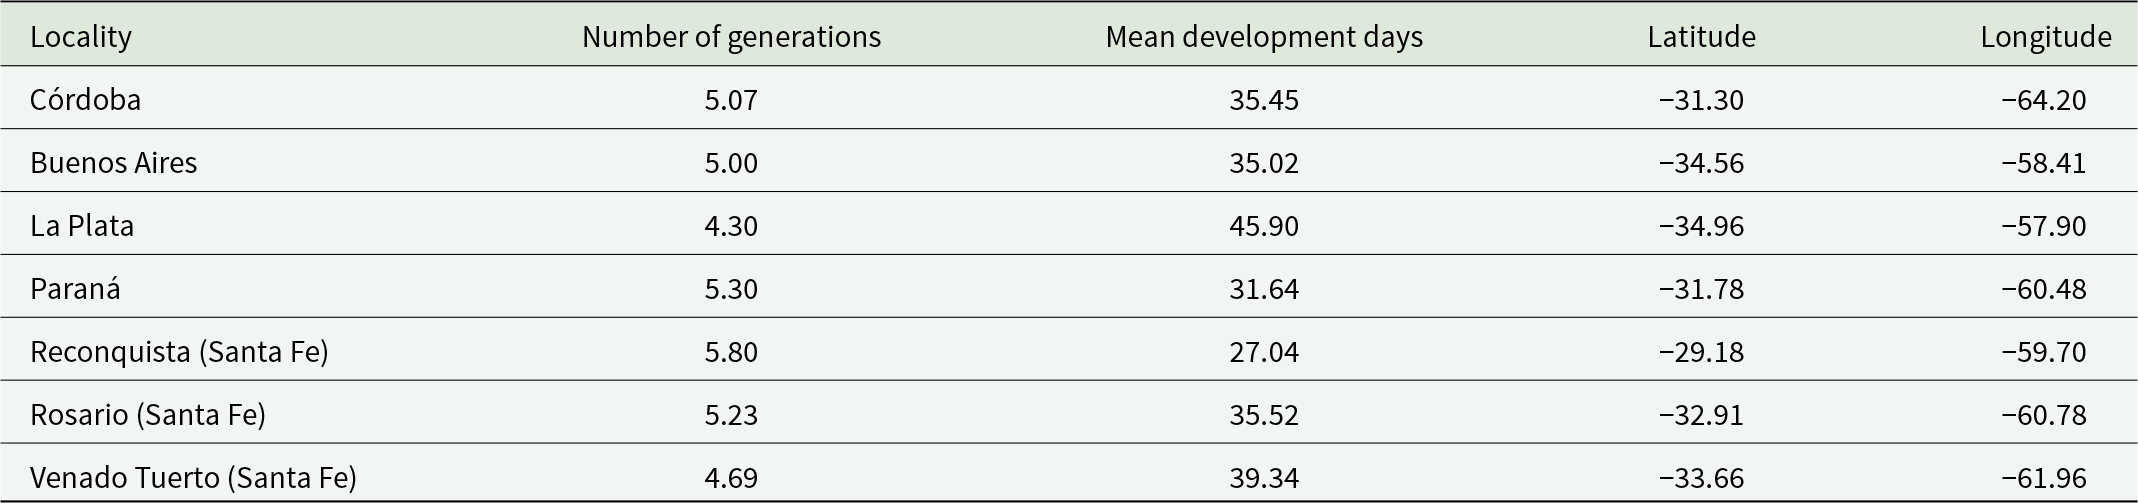
In general, the number of diamondback moth generations increased from South to North following the decreasing latitude of the country (fig. 5). The variability in number of generations estimated for the central area of Argentina is very low. In our study area, around Córdoba city, a mean number of 5.07 generation for the period August to December was estimated, while for Buenos Aires is 5 generations, 4.3 generations in La Plata and 5.3 generations in Paraná, and almost 6 in Reconquista for the same period. The development time from egg to adult for the central area of Argentina also showed very little variability ranging between 35 and 29 days (fig. 5, table 4).
Estimation of the number of generations expected between August and December in central Argentina from the average accumulated degree days of the last 13 years.

Estimated number of generations and mean development days of Plutella xylostella in different regions of Argentina (see figure 5) between August and December

Discussion
Insect survival is influenced by various factors, including host quality, rainfall, natural enemies, and temperature (Campos et al., Reference Campos, Schoereder and DeSouza2006; Marchioro and Foerster, Reference Marchioro and Foerster2016). Among these, temperature stands out as the most critical because it directly affects growth, body size, and the number of generations that can develop in a specific area (Huffaker, Reference Huffaker1944; Shi et al., Reference Shi, Cui and Zang2014; Kobori and Hanboosong, Reference Kobori and Hanboosong2017). Local temperatures significantly impact the developmental threshold and thermal requirements for completing the life cycle of insect populations in their respective regions (Kobori and Hanboosong, Reference Kobori and Hanboosong2017). Understanding the environmental factors influencing these populations is vital for predicting changes in their dynamics and developing sustainable pest control strategies (Kroschel et al., Reference Kroschel, Sporleder, Tonnang, Juarez, Carhuapoma, Gonzales and Simon2013).
Temperature and developmental parameters
There are many abiotic and biotic factors that can affect the life history parameters of the diamondback moth. Guo and Quin (Reference Guo and Quin2010) found no statistical differences in the emergence rate between 50% and 70% relative humidity (RH), but a significant difference in the emergence rate between these RH levels and 90% RH. They concluded that the differences between their results and those obtained by other authors could be attributed to variations in humidity and host plants. In the case of Spodoptera frugiperda, the immature stages are strongly affected by atmospheric and soil humidity (He et al., Reference He, Zhao and Ali2021). Similarly, Tamiru et al., (Reference Tamiru, Getu, Jembere and Bruce2012) showed that the larval period of Chilo partellus (Lepidoptera: Crambidae) was significantly shorter at 40% RH and a temperature of 30°C. It is evident that humidity can be critical for the survival of the immature stages of insects. Based on this information, we maintained the relative humidity at a constant 60% (±5) in our experiments.
Our results demonstrate a strong influence of temperature at a constant humidity of 60% (±5) on the developmental time of Plutella xylostella. This pattern aligns with observations by Marchioro and Foerster (Reference Marchioro and Foerster2011). Temperature also affects fecundity and fertility, with females laying fewer eggs and experiencing reduced egg hatchability at extreme temperatures (5°C and 30°C). The optimal temperature for fecundity was identified as 15°C, where the highest number of fertile eggs was recorded. These findings are consistent with studies on populations in Japan and Australia (Shirai, Reference Shirai2000; Garrad et al., Reference Garrad, Booth and Furlong2016). While 15°C was ideal, females reared at 23 and 25°C also exhibited high fertility rates. When analysing immature stage survival, we found the highest rates occurred between 15 and 23°C, peaking at 23°C. At this temperature, 25% of the population survived to adulthood. Beyond this range, survival rates declined, with no individuals completing development at 5 or 30°C. Extreme temperatures caused high mortality at all developmental stages, with the first larval instar experiencing the highest losses. This aligns with findings by Ngowi et al., (Reference Ngowi, Tonnang, Mwangi, Johansson, Ambale, Ndegwa and Subramanian2017), who noted population declines outside the 10 to 30°C range due to egg mortality. In Tanzania and Kenya, Ngowi et al., (Reference Ngowi, Tonnang, Mwangi, Johansson, Ambale, Ndegwa and Subramanian2017) observed that optimal conditions for population growth occurred between 20 and 25°C, while tropical populations occasionally tolerated temperatures up to 35°C (Shirai, Reference Shirai2000). In contrast, our study found an upper developmental limit of 30°C for local populations, highlighting their adaptation to regional conditions.
Survival and stage-specific trends
Survival rates varied significantly across developmental stages. Eggs and first instar larvae experienced the highest mortality (30–50%) across all temperatures, consistent with Xing et al., (Reference Xing, Ma, Zhao and Han2015) observations of improved egg survival under fluctuating versus constant high temperatures. Among larval instars, stages 3 and 4 had the lowest mortality, particularly between 15 and 23°C. However, other studies (e.g. Golizadeh et al., Reference Golizadeh, Kamali, Fathipour and Abbasipour2007; Liu et al., Reference Liu, Chen and Zalucki2002) reported survival rates peaking at 30°C before declining at higher temperatures, a trend not observed in our study. Pupae showed high survival (95–100%) at 15, 23, and 25°C, consistent with Ngowi et al., (Reference Ngowi, Tonnang, Mwangi, Johansson, Ambale, Ndegwa and Subramanian2017) findings of minimal pupal mortality at optimal temperatures.
Egg survival at extreme temperatures provides critical insights into population dynamics. While eggs laid at 5°C failed to hatch, temperatures between 10 and 15°C allowed moderate survival rates. This is indicative of a thermal threshold that prevents hatching below certain temperatures. In practical terms, this suggests that colder seasons may serve as natural regulators of P. xylostella, populations. Conversely, survival at high temperatures, particularly at 30°C, was extremely limited. High temperatures likely impair enzymatic activity and metabolic processes, causing high mortality in early stages.
Geographical and latitudinal variations
The temperature–development relationship for P. xylostella reveals significant geographical and latitudinal variation. Populations in higher latitudes with cooler climates show shorter development times, while those in tropical regions exhibit greater thermal tolerance (Pan et al., Reference Pan, Chen, Lin, Ridsdill-Smith and Liu2014). For example, Shirai (Reference Shirai2000) found consistent development times across populations in tropical and temperate Asia, but Umeya and Yamada (Reference Umeya and Yamada1973) reported regional differences within Japan. Such variability is attributed to phenotypic plasticity and local adaptation (Gaston, Reference Gaston2009; Bennett et al., Reference Bennett, Duarte, Marbà and Wernberg2019). In Córdoba, Argentina, well-defined seasons with a mean annual temperature of 17°C (Servicio Meteorológico Nacional, 1992) shape P. xylostella populations. These populations thrive within the region’s typical temperature range, showing optimal development near the regional mean temperature. The concept of thermal adaptation is further supported by comparing populations from tropical and temperate zones. In tropical areas, P. xylostella exhibits broader thermal tolerance, enabling survival at higher temperatures up to 35°C. However, in Córdoba, where temperatures rarely exceed 30°C, populations show narrower thermal ranges. This is a prime example of how environmental pressures can shape physiological traits within species. Regional climatic conditions dictate not only survival rates but also population dynamics and reproductive success. Populations adapted to temperate climates may face challenges under global warming scenarios, as their thermal limits are already close to the upper thresholds observed in this study.
Developmental thresholds and non-linear models
Our study tested several non-linear models to describe the temperature–development relationship of local populations. Models by Taylor, Lactin-1, Brière-1, and Brière-2 accurately predicted development time and estimated biologically significant parameters like minimum and optimal temperatures (Golizadeh et al., Reference Golizadeh, Kamali, Fathipour and Abbasipour2007; Jalalai et al., Reference Jalalai, Tirry, Arbab and De Clercq2009). The Taylor model yielded a lower temperature threshold (T₀) of 4.51°C, while Brière models estimated T₀ at 6.86°C. Optimal development occurred near 24°C, contrasting with Marchioro and Foerster’s (Reference Marchioro and Foerster2011) finding of a 30°C optimum for Brazilian populations. These differences highlight the local adaptation of Córdoba populations to lower temperature thresholds and narrower thermal ranges.
The choice of non-linear models is critical for accurately estimating developmental thresholds. In our analysis, the Briere models provided robust estimates of both lower and upper temperature limits. However, the Taylor model, while suitable for estimating T₀, underestimated the optimal temperature range. This discrepancy underscores the importance of testing multiple models when studying temperature-dependent development. Differences between populations in Argentina and Brazil further emphasise the role of local environmental factors in shaping developmental parameters. For pest management, these models can help predict periods of peak activity and vulnerability, enabling targeted interventions.
Implications for population dynamics and pest management
Our findings emphasise the importance of local adaptation in shaping P. xylostella population dynamics. For instance, at 15°C, the egg-to-adult cycle in Córdoba populations lasted 34 days, compared to 39 days in tropical Brazilian populations (Marchioro and Foerster, Reference Marchioro and Foerster2011). This adaptation allows populations to synchronise their life cycle with regional climatic conditions. However, exposure to temperatures exceeding 30°C disrupts enzymatic activity critical for growth and differentiation (Logan et al., Reference Logan, Wollkind, Hoyt and Tanigoshi1976; Bahar et al., Reference Bahar, Soroka, Grenkow and Dosdall2014), increasing mortality in early instars.
From a pest management perspective, understanding the temperature–development relationship of P. xylostella is crucial for designing effective strategies. Local adaptation implies that management practices must be tailored to specific climatic conditions. For instance, predicting periods of peak activity based on thermal requirements can guide the timing of pesticide applications or the release of biological control agents. Additionally, the findings highlight the potential impact of climate change on P. xylostella populations. Rising temperatures may shift the thermal niche of these populations, potentially increasing their geographic range and exacerbating pest pressures in temperate regions.
Furthermore, the study underscores the importance of integrating climatic data into pest management models. For example, degree-day models can provide valuable insights into the timing of key developmental stages, allowing for more precise interventions. In regions like Córdoba, where P. xylostella populations are already adapted to a relatively narrow thermal range, even small temperature increases could have significant ecological and economic implications. Thus, future research should focus on the combined effects of temperature and other environmental factors, such as humidity and photoperiod, on P. xylostella development and survival.
Conclusion
In conclusion, understanding the temperature-dependent development of P. xylostella is crucial for designing pest management strategies tailored to local climates. This study offers the first comprehensive analysis of the species’ thermal biology in temperate Argentina, providing a foundation for predictive models and sustainable control practices. By highlighting the role of local adaptation and environmental factors, the findings contribute to a broader understanding of insect population dynamics and their implications for agricultural ecosystems.
Acknowledgements
We thank Alejandro Barbeito for the figure designs. We received financial support from SecyT Universidad Nacional de Córdoba. We also acknowledge the farmers in the study area who allowed individual collections from their fields. A very special thank to the Centro de Información Meteorológica, CIM (Servicio Meteorológico Nacional, Argentina), for providing daily minimum and maximum temperatures for all meteorological stations in Argentina for the period 2010–2022.
Author contributions
MPG: conceptualisation, methodology, data analysis, interpretation, original draft. EF: data acquisition, data curation, methodology. PSP and RF: conceptualisation and study design. All authors reviewed and approved the final manuscript.
Competing interests
The authors declare no conflicts of interests.