Introduction
Sea anemones are an important component of Antarctic benthic communities, being one of the largest predators in the absence of hard-bodied benthic predators such as decapods (e.g. crabs) or benthic sharks and rays (Smith et al. Reference Smith, Aronson, Steffel, Amsler, Thatje and Singh2017). Antarctic sea anemones have been recorded feeding on Medusozoa (Periphylla periphylla), asteroids (Perknaster fuscus antarcticus) and echinoids (Diplasterias brucei) (Brueggeman Reference Brueggeman1998). A dietary analysis of the sea anemone Urticinopsis antarctica found that it fed on molluscs, ascidians, sea urchins, brittle stars, fish and sea cucumbers (Ivanova & Grebelnyi Reference Ivanova and Grebelnyi2017).
In the Southern Ocean surrounding Antarctica, sea anemones are found in a diverse range of benthic habitats, and their depth distribution ranges from shallow coastal areas to the edge of the continental shelf, with some species being found at deeper than 1000 m (Rodriguez et al. Reference Rodriguez, Lopez-Gonzalez and Gilib2007). Half of the sea anemone species of the Antarctic region are thought to have a circumpolar distribution, but data on Antarctic sea anemones are either from the early twentieth century or come from western regions of Antarctica (Dunn Reference Dunn1983, Fautin Reference Fautin1986, Rodriguez et al. Reference Rodriguez, Lopez-Gonzalez and Gilib2007). There is only one previous fine-scale study of sea anemone distribution and abundance along the Antarctic continental shelf or from the shallow coastal waters of East Antarctica (Watson et al. Reference Watson, Stark, Johnstone, Wapstra and Miller2018).
As most sea anemone species are epilithic and require hard substrate for attachment (Ammons & Daly Reference Ammons and Daly2008), rocky habitat in the shallow coastal region provides an important substrate and shelter for Antarctic sea anemone species. The shallow regions of the Southern Ocean around the Antarctic continental shelf contain a diverse range of benthic habitats, from sheltered embayments to more open coastal areas. These benthic environments are known for their stable sea temperatures and salinity, but sea ice and light exhibit intense seasonal fluctuation and are extremely important drivers of community structure and stability (Clark et al. Reference Clark, Stark, Palmer, Riddle and Johnston2017). Benthic habitats range from rocky boulder/cobble fields to muddy/sandy sediment flats (Smith et al. Reference Smith, O'Brien, Stark, Johnstone and Riddle2015) in areas covered by sea ice for most of the year, to areas that are open water for most of the summer.
Most Antarctic research stations are located in coastal regions, which have highly diverse benthic marine ecosystems (Stark et al. Reference Stark, Kim and Oliver2014). The presence of Antarctic research stations in these regions has resulted in anthropogenic disturbances to marine ecosystems. Disturbances to marine environments associated with stations include fuel and oil spills (Thompson et al. Reference Thompson, Goldsworthy, Riddle, Snape and Stark2007), landfill and waste disposal sites (Stark et al. Reference Stark, Riddle and Smith2004) and sewage and wastewater disposal (Stark et al. Reference Stark, Kim and Oliver2014, Reference Stark, Bridgen, Dunshea, Galton-Fenzi, Hunter and Johnstone2016a). Such disturbances may have negative implications for benthic diversity due to the low connectivity between populations (Baird et al. Reference Baird, Miller and Stark2012) and slow recovery from disturbance (Stark et al. Reference Stark, Kim and Oliver2014).
Disturbance associated with former waste disposal sites at Antarctic research stations include heavy metals, hydrocarbons and high concentrations of organic carbon (Stark et al. Reference Stark, Snape and Riddle2003b, Stark et al. Reference Stark, Riddle and Smith2004). The effects of these disturbances on Antarctic sea anemones are unknown. Other taxa show strong responses to disturbances in Antarctica, such as a decrease in abundance (or absence) in metal-contaminated sediments (e.g. echinoderms, cirratulid polychaetes, cumaceans, ostracods, oligochaetes) (Stark et al. Reference Stark, Kim and Oliver2014) or an increase in abundance in response to higher levels of organic carbon in sediments (e.g. lyssianassid amphipods) (Baird & Stark Reference Baird and Stark2014).
Studies of sea anemone ecology in Antarctic coastal regions can contribute to the baseline knowledge of benthic ecosystems and provide an improved understanding of responses to anthropogenic disturbance in coastal ecosystems, and they help define criteria for the assessment and detection of environmental disturbances in Antarctica. Sea anemones are long-lived, potentially integrating responses to environmental disturbance over long periods, and they occupy a high trophic niche, consuming a broad range of prey. For example, Edwardsia meridionalis, an infaunal Antarctic sea anemone species, is noted as a potential indicator species at McMurdo Station due to its sensitivity to anthropogenic disturbances (Stark et al. Reference Stark, Kim and Oliver2014). Unfortunately, very little is known about E. meridionalis or other Antarctic sea anemone species' abundance, distribution and ecological relationships, particularly in East Antarctica.
This study compares sea anemone distribution and abundance from two regions of East Antarctica through photoquadrat surveys. Surveys were conducted at two Australian Antarctic research stations, Casey Station and Davis Station, which have been the focus of a range of other environmental and ecological studies. We tested the hypotheses that sea anemone distribution is related to habitat composition and examined relationships with the abundance of other species. We also tested whether there were any differences related to human impacts, including sewage outfalls and waste disposal sites.
Methods
We utilized data from two separate studies of benthic communities at Casey and Davis Stations to specifically examine sea anemone ecology. Although each survey used slightly different sampling designs, making direct comparison difficult, the Casey Station survey included locations considered to represent a subset of the habitats surveyed at Davis Station (being mostly ice covered and a mix of rock and sediments), hence enabling a broad comparison of sea anemone–habitat relationships in East Antarctica.
Sampling design
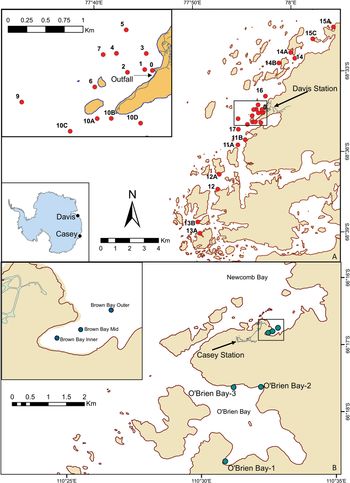
The Casey Station survey was undertaken in the summer of 2009 to assess the impact of a former shore-based waste disposal site on benthic communities in the adjacent bay, Brown Bay (Stark et al. Reference Stark, Riddle and Simpson2003a). Three locations were surveyed within Brown Bay at increasing distance from the shoreline disposal site: Brown Bay Inner (BBI; 50–100 m from shore, 5–8 m depth); Brown Bay Middle (BBM; 150–250 m from shore, 5–8 m depth); and Brown Bay Outer (BBO; 300–400 m from shore, 15–18 m depth) (Fig. 1). Sediments in Brown Bay are contaminated with metals and hydrocarbons that are up to 100 times greater than that of uncontaminated control areas such as O'Brien Bay (Stark et al. Reference Stark, Snape, Riddle and Stark2005). The locations within Brown Bay were compared with three control locations within O'Brien Bay, a large bay to the south of Casey Station that is undisturbed by human activity (Fig. 1). In O'Brien Bay, three locations (ranging from 50 to 200 m from shore) were surveyed: OB1 (5–8 m depth), OB2 (8–10 m depth) and OB3 (8–10 m depth). At both bays, surveys were conducted in two habitats within each location: boulders and flats. For the boulder habitat, photoquadrats were taken around the base of large boulders. For the flats habitat, photographs were taken in areas of non-boulders with flat to undulating slopes of sediment, rock, gravel and cobbles. At one location (OB1), there was also an additional deep flat site (22 m).
Map showing study locations at a. Davis Station and b. Casey Station, East Antarctica. Locations at Davis Station are numbered.

The Davis Station survey was undertaken in 2010 to examine the effects of a sewage outfall, with sampling conducted at 26 locations at a range of distances (tens of metres to over 10 km) from the sewage outfall (Stark et al. Reference Stark, Corbett, Dunshea, Johnstone, King and Mondon2016b). The Davis Station survey represented a greater spatial extent than the Casey Station survey and a more diverse range of habitats from rocky reefs with macroalgae, to varying mixes of sediments and rock to very fine sediments (Fig. 1) (Stark et al. Reference Stark, Bridgen, Dunshea, Galton-Fenzi, Hunter and Johnstone2016a). The locations were all semi-enclosed coastal areas protected by outlying islands or in embayments. Survey depths ranged from 5 to 20 m (Stark et al. Reference Stark, Corbett, Dunshea, Johnstone, King and Mondon2016b).
Within each location at Casey Station, there were two sites (~100 m apart). Within each site, three parallel transects (25 m long) ~5 m apart were surveyed. Two 5 × 2 m plots were haphazardly selected along each transect (5 m long and 1 m either side of the transect tape) so that they did not overlap, and they were at least 5 m apart. Within each plot, 5–10 photographs were taken using a camera mounted on a frame at a fixed distance above the seabed. The frame size of the photoquadrat was 42 × 74 cm.
At Davis Station, each location was a circle of ~50 m radius around a workboat. Three 25 m tape measures were laid out haphazardly within this area and four to six photographs (frame size of the photoquadrat was 48 × 63 cm) were taken in each of two plots on each transect as described for Casey Station. A habitat survey was conducted at Davis Station along the three transects plus an additional fourth 25 m transect, describing the benthic habitat at each location by classifying the substrate (mud, sand, gravel, cobbles, boulders or rock) and the biogenic habitat, if any, occupying the substrate (macroalgae, sessile invertebrates - sponge, ascidian, bryozoan; see Stark et al. Reference Stark, Corbett, Dunshea, Johnstone, King and Mondon2016b for further details).
Photoquadrat analysis
A grid of 100 points was overlaid on each photoquadrat and the habitat type and biota under each point were recorded separately to obtain estimates of habitat composition and percentage cover of biota. Habitat was classified into gravel and pebbles, shell (substrate composed of shell pieces), macroalgae, rock, sediment, rubbish (pieces of rubbish covering the substrate), sand combined (sand with a mixture of gravel and pebbles) and mud combined (mud with a mixture of gravel and pebbles). Biota were classified to class or family level in order to examine associations between major groups of animals (asteroids, echinoids, ophiuroids, gastropods, nemerteans, bryozoans, Porifera, ascidians, pycnogonids, diatoms, macroalgae and bivalves) and sea anemones. A count of all large species (those large enough to be accurately counted in a photograph but generally larger than 2 cm) found in each photograph was conducted to determine densities (asteroids, echinoids, ophiuroids, gastropods, nemerteans, pychnogonids and bivalves).
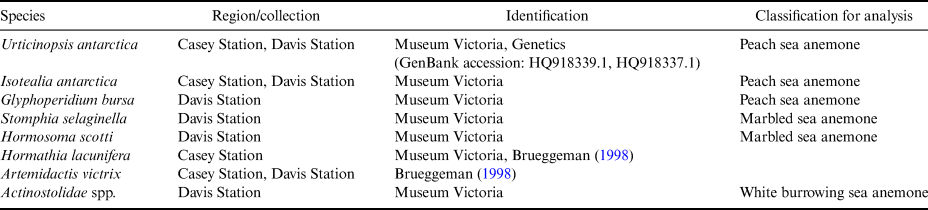
Sea anemones were classified to species level where possible or grouped with similar morphological species when identification was not possible. There are several species of sea anemones that have been identified through morphological and genetic analysis along the continental shelf regions at Casey Station and Davis Station (Urticinopsis antarctica, Isotealia antarctica, Glyphoperidium bursa, Stomphia selaginella, Hormosoma scotti, Hormathia lacunifera, Artemidactis victrix and Actinostolidae species; Table I), and this information formed the basis of the classification of sea anemones in the photoquadrat images. Sea anemones found at Casey Station were mainly the large peach sea anemones, which are very difficult to identify to species level from photographs and could be one of three species that have been identified morphologically and/or genetically at Casey and Davis Stations: U. antarctica, I. antarctica or G. bursa. These species contain overlapping morphological features including size and tentacle numbers (Brueggeman Reference Brueggeman1998). These were grouped together in analyses as peach sea anemones. Two other sea anemones were identified at the O'Brien Bay sites, H. lacunifera (two individuals) and A. victrix (one individual), but both were found in low abundance. Sea anemones found at Davis Station included the peach sea anemones, marbled sea anemones (S. selaginella or H. scotti) and a large white sea anemone with 10–12 tentacles. The white sea anemone species is unidentified but has been initially placed in the Actinostolidae family based on morphological features, which included taxonomic features of a burrowing sea anemone (Mitchell, personal communication 2012).
Species identification and location of sea anemone species from Casey and Davis Stations.

Data analysis
Sea anemone density was converted to number per square metre. A three factor permutational multivariate analysis of variance (PERMANOVA; region, location and plot) was used to assess differences in sea anemone density between and within the two regions (Casey Station and Davis Station) based on a Euclidean distance similarity matrix. Effects of habitat were included in a separate three factor PERMANOVA analysis (region, location and habitat). PERMANOVA analysis (Anderson Reference Anderson2001, Anderson & Braak Reference Anderson and Braak2003) was used due to its ability to handle unbalanced designs and due to the fact that it has fewer assumptions than traditional analysis of variance but gives equivalent results. A separate one factor PERMANOVA was used to compare the potentially impacted sites individually against the combined control locations using planned comparisons on plot averages.
Comparisons of differences in habitats among locations were done using multivariate analysis of the proportion of each habitat at each site (rock, sediment, shell, macroalgae). Percentages of each habitat were square root transformed and a Euclidean distance similarity matrix was used in multivariate analysis using the PRIMER-6 software package (Clarke & Gorley Reference Clarke and Gorley2015). Relationships between habitat and abundance of sea anemones were examined by overlaying scaled symbols to represent abundances on the habitat ordination. This was done separately for each region.
Patterns of community composition and relationships with sea anemones were analysed using count data for the larger species and percentage coverage data for colonial species or where individuals could not be distinguished (bryozoans, ascidians, Porifera, diatoms and macroalgae). All community data were square root transformed and Bray–Curtis similarities were calculated between pairs of samples. Cluster analysis and non-metric multidimensional scaling (nMDS) ordinations were used to explore the relationships with habitat and community patterns. Similarity profile (SIMPROF) permutation test cluster analysis was used to identify significantly different groups and similarity percentages (SIMPER) analysis (PRIMER) was used to identify key species that contributed the most to dissimilarity between groups and similarity within groups. Sea anemone density was then compared to the community nMDS plots and groups in order to look for relationships between sea anemones, habitat and other taxa.
Results
Regional sea anemone distribution and abundance
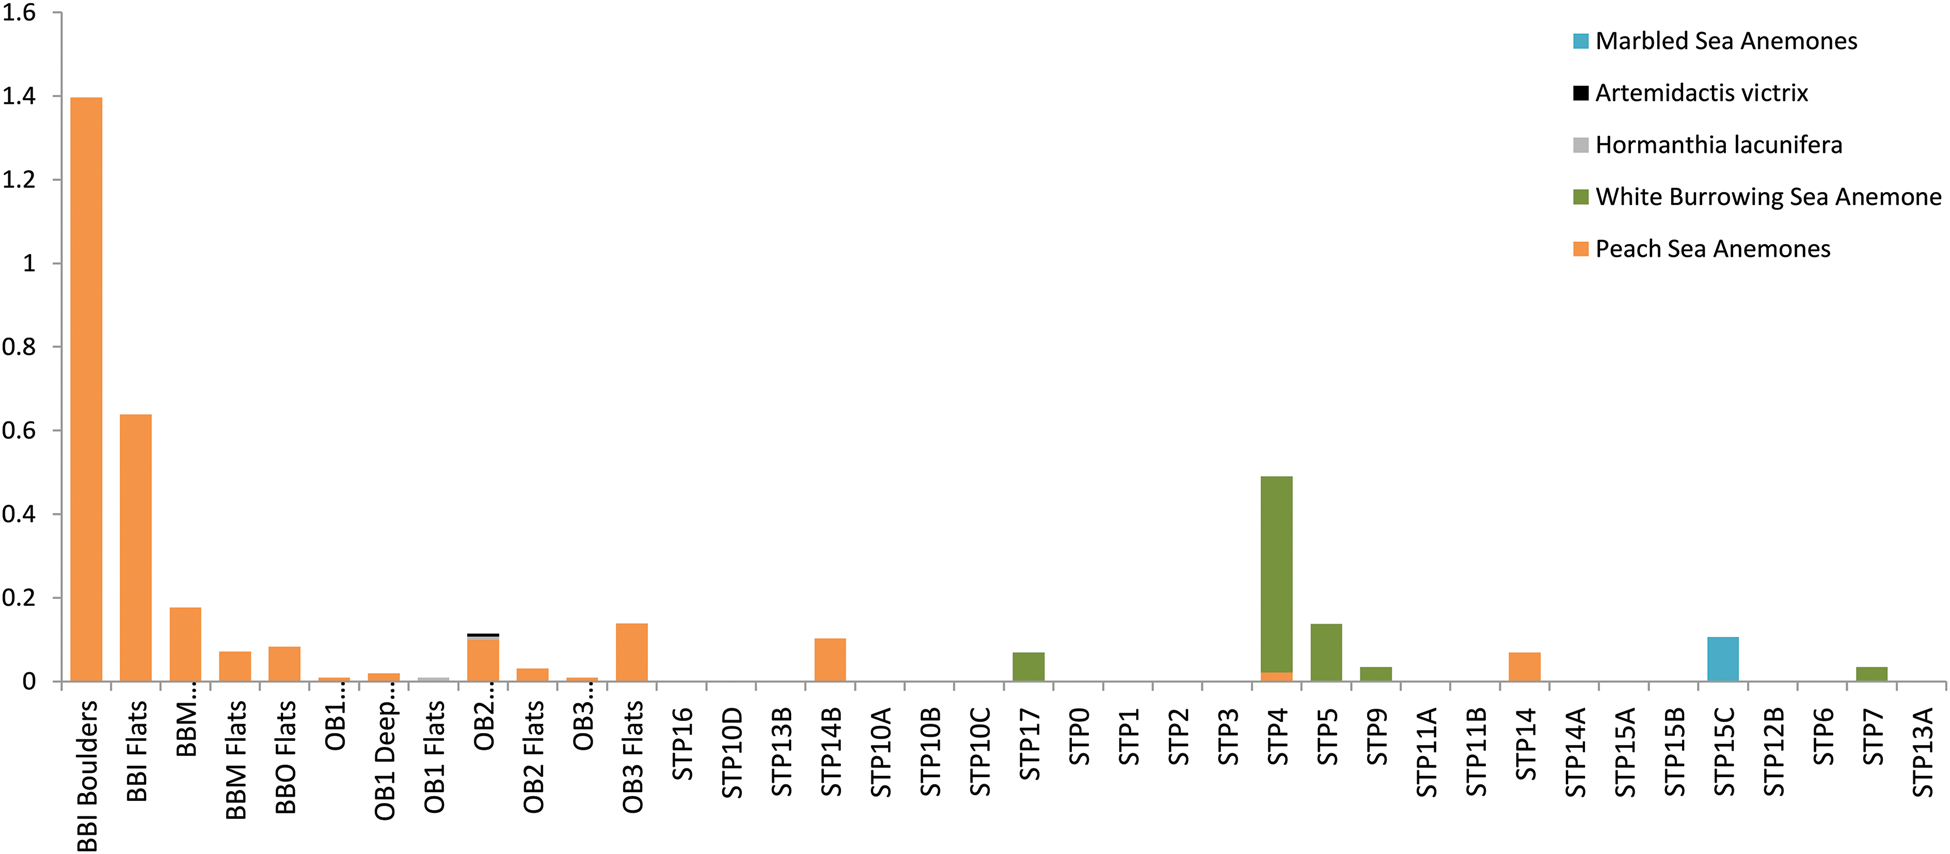
Sea anemones were found at all 12 locations at Casey Station and at eight locations from a total of 26 locations at Davis Station. The Casey Station survey average sea anemone density was 0.22/m2 and average sea anemone density at Davis Station was 0.03 m-2 (Fig. 2). At least three species/species types were recorded at Casey Station: the peach sea anemones (the group consisting of the species U. antarctica, I. antarctica or G. bursa), H. lacunifera and A. victrix. At Davis Station, three species types were found across the eight locations: the white burrowing sea anemones, the peach sea anemones and the marbled sea anemones.
Sea anemone density (number of sea anemones per square metre) from photoquadrat surveys across two regions: Casey Station and Davis Station, East Antarctica. BBI = Brown Bay Inner, BBM = Brown Bay Middle, BBO = Brown Bay Outer, OB = O'Brien Bay.

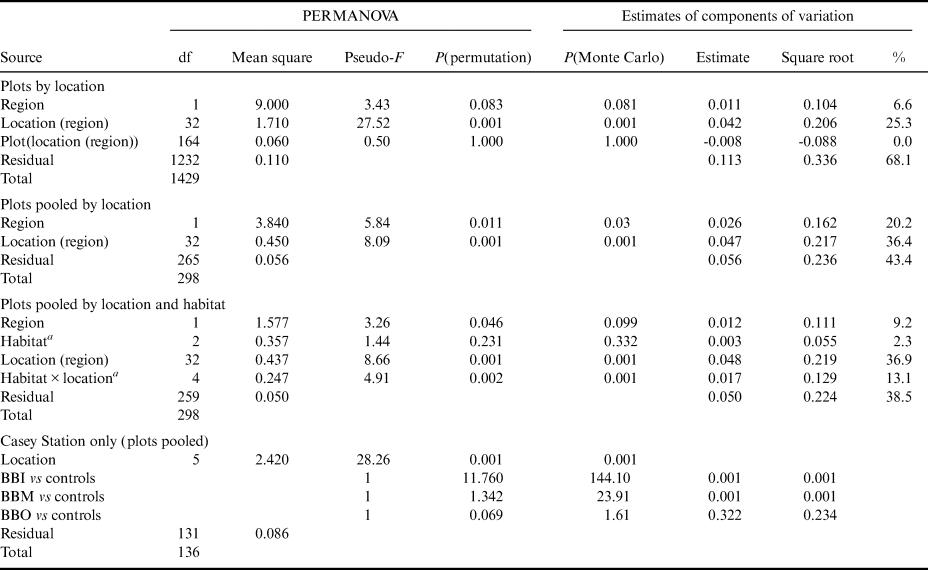
At Casey Station, sea anemone density ranged from 1.40 to 0.008 m-2 amongst habitats within locations. At Davis Station, the regional-level sea anemone density is quite low (0.49–0.00 m-2), but the within-region analysis showed that sea anemone density was high at specific locations. At Casey Station, the highest sea anemone density was at BBI (boulders: 1.40 m-2, flats: 0.64 m-2). BBI and BBM (closest to the waste disposal site) had significantly higher density (1.40–0.07 m-2) compared to the control locations in O'Brien Bay (0.14–0.008 m-2), but BBO was not significantly different from the control sites (Table II).
Results of PERMANOVA analysis on the spatial distribution of total anemones (based on square root-transformed abundances and Euclidean distance similarity).

a Comparison at Casey Station only.
BBI = Brown Bay Inner, BBM = Brown Bay Middle, BBO = Brown Bay Outer.
Analysis of total sea anemone abundance indicated no significant differences between regions (which only accounted for ~7% of the total variation) due to large differences between locations within regions (25% of variation; Table II). There were no significant differences at the level of plot (within locations) due to very large variation between replicate photoquadrats within plots (the residual variation), which accounted for ~68% of the total variance (Table II). This is most probably due to the small photoquadrat size in relation to the size and spacing of sea anemones. In order to reduce the variation at this scale, abundances of sea anemones in replicate photoquadrats were pooled in plots (with up to six photoquadrats per plot) and these pooled plots were used as replicates in further analysis (Table II), which reduced the residual variation to 38%. Pooling plots showed that there was a significant difference between regions, which accounted for ~20% of the total variation in abundance, but with locations with regions accounting for 36% of the total variation (Table II). Thus, differences between locations within a region are greater than those between the regions overall.
Habitat influences
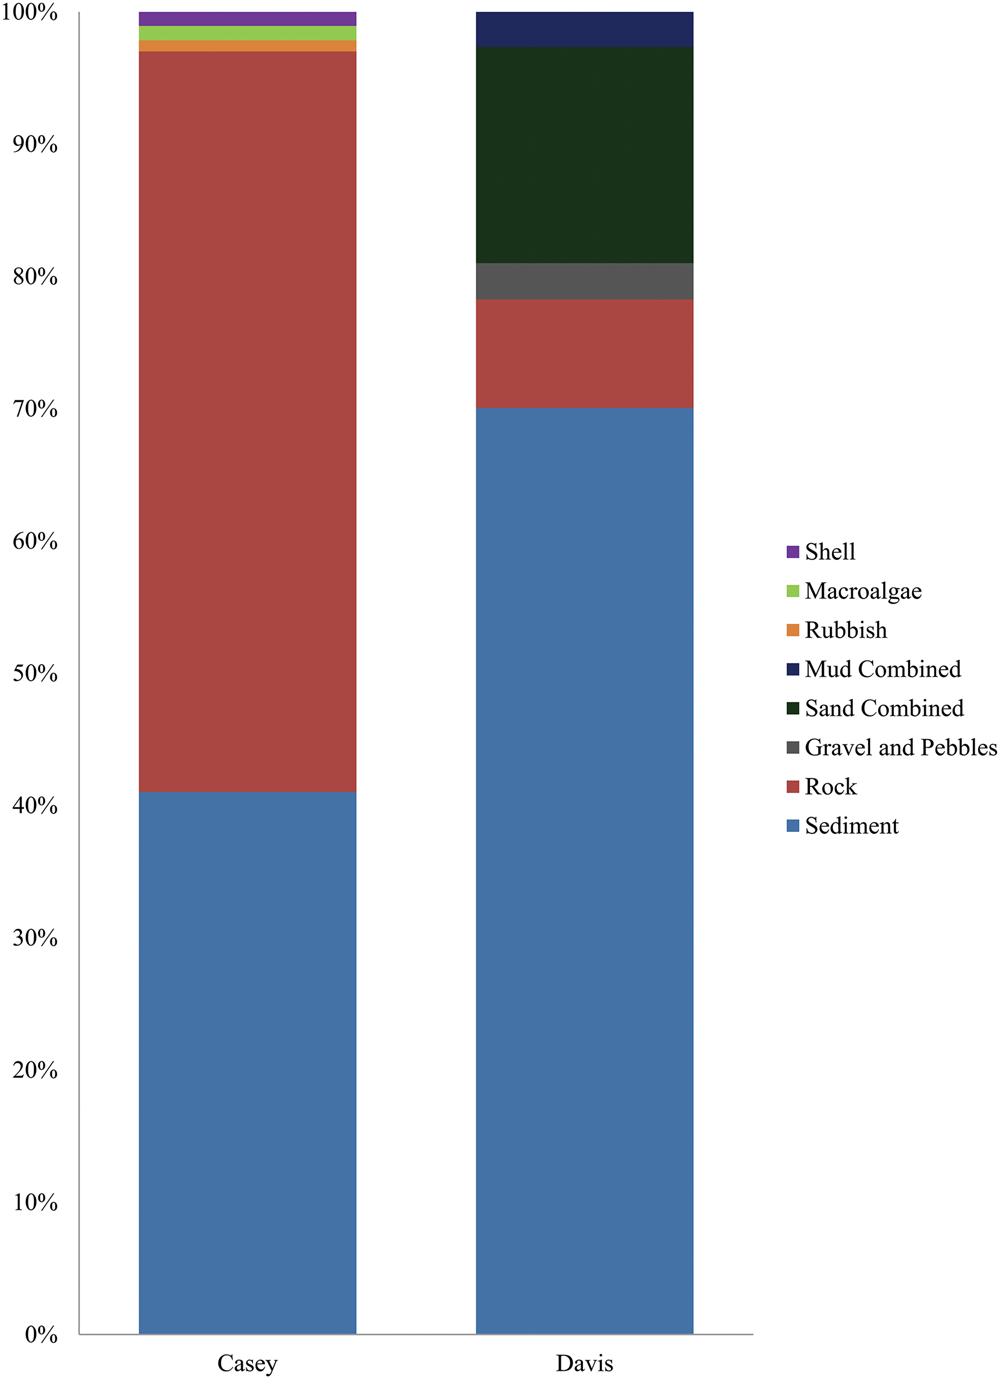
The locations surveyed at Casey Station were a mix of rocky and sediment-dominated habitats with small portions of habitat that included shell, macroalgae and rubbish. At Davis Station, locations had higher proportions of sandy sediment than rock and contained areas with small portions of mud, gravel and pebbles (Fig. 3). Given the differences in the sites selected to survey and different sampling design, further analysis of the influence of habitat on sea anemones was done separately for each region.
Habitat composition from photoquadrat survey locations at Casey Station and Davis Station, East Antarctica.

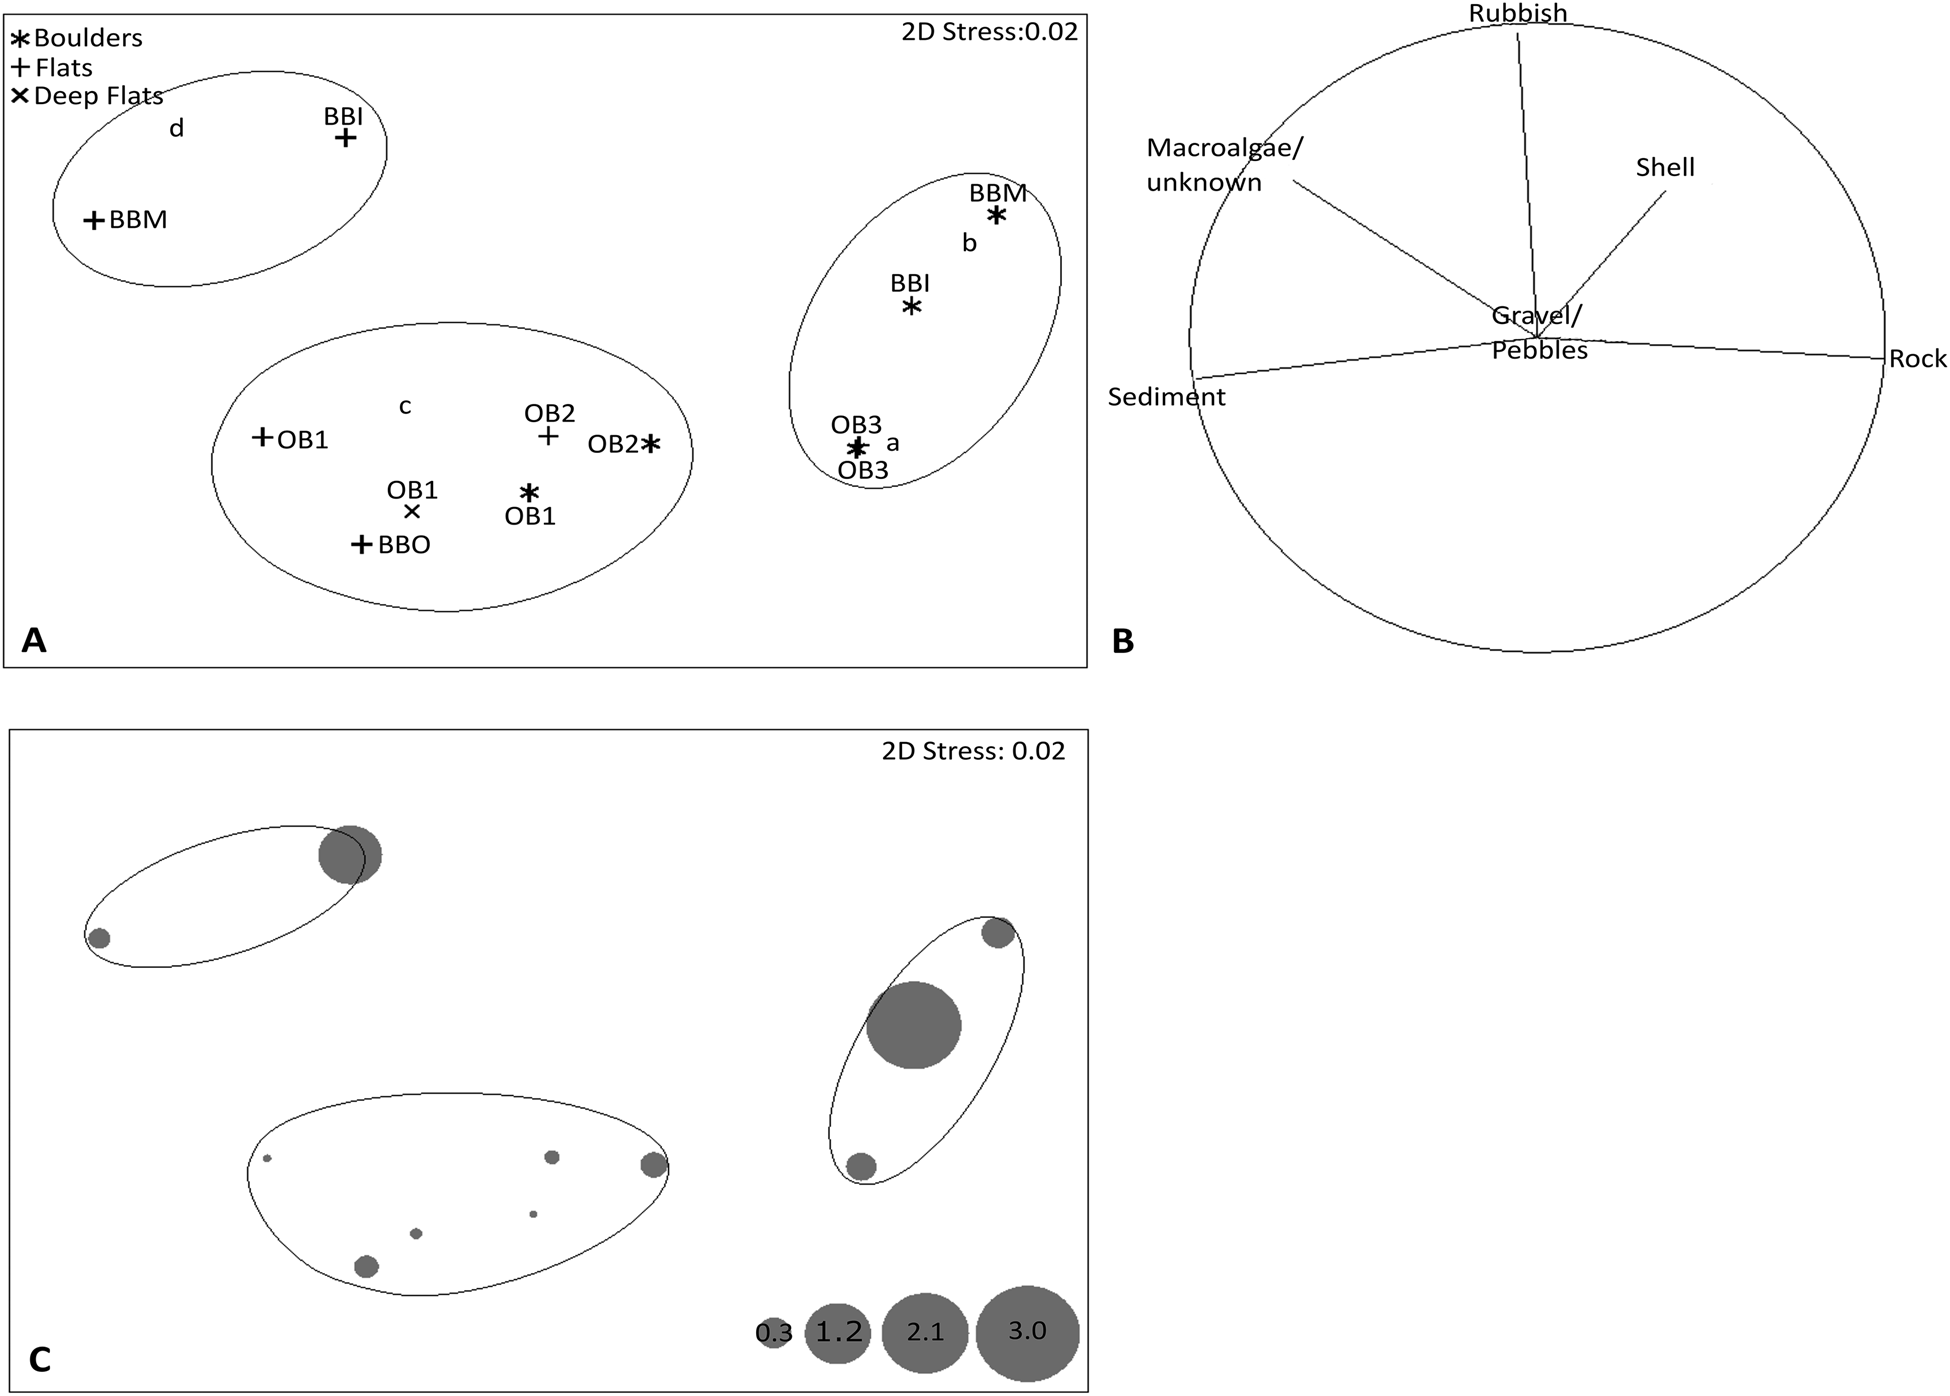
An nMDS and cluster analysis, with a SIMPROF test, of the habitat composition at Casey Station showed that locations could be grouped into three distinct habitats (Fig. 4a) along a gradient from sediment to rock. Those with a high proportion of rock included Brown Bay boulder habitat and the OB3 habitat; those that tended to have the higher proportion of sediment were mainly flat habitats including BBI and BBM; and the third habitat group were locations with a roughly similar mixture of sediment and rocky substrate consisting of BBO, OB1 and OB2 (Fig. 4). Sea anemone densities were highest in rocky and boulder habitats within locations (Fig. 4c). Hormathia lacunifera and A. victrix were found at OB2, which was dominated by gravel/pebbles. An analysis of sea anemone density between habitats (at Casey Station only), comparing boulder habitats to flat, non-boulder habitats, showed that while sea anemone abundance between habitats did not differ significantly overall, there were significant differences between habitats within locations (habitat × location interaction; Table II), and this explained ~13% of the overall variation.
Habitat composition and sea anemone abundance at Casey Station. a. nMDS plot of habitat composition at each location. b. Vector plot of habitat variables correlated with nMDS axes in a. c. Bubble plot of average total sea anemone counts per location overlayed onto the nMDS plot of habitat composition. Significantly different groupings are circled in a. and c. based on Casey Station habitat composition SIMPROF analysis.

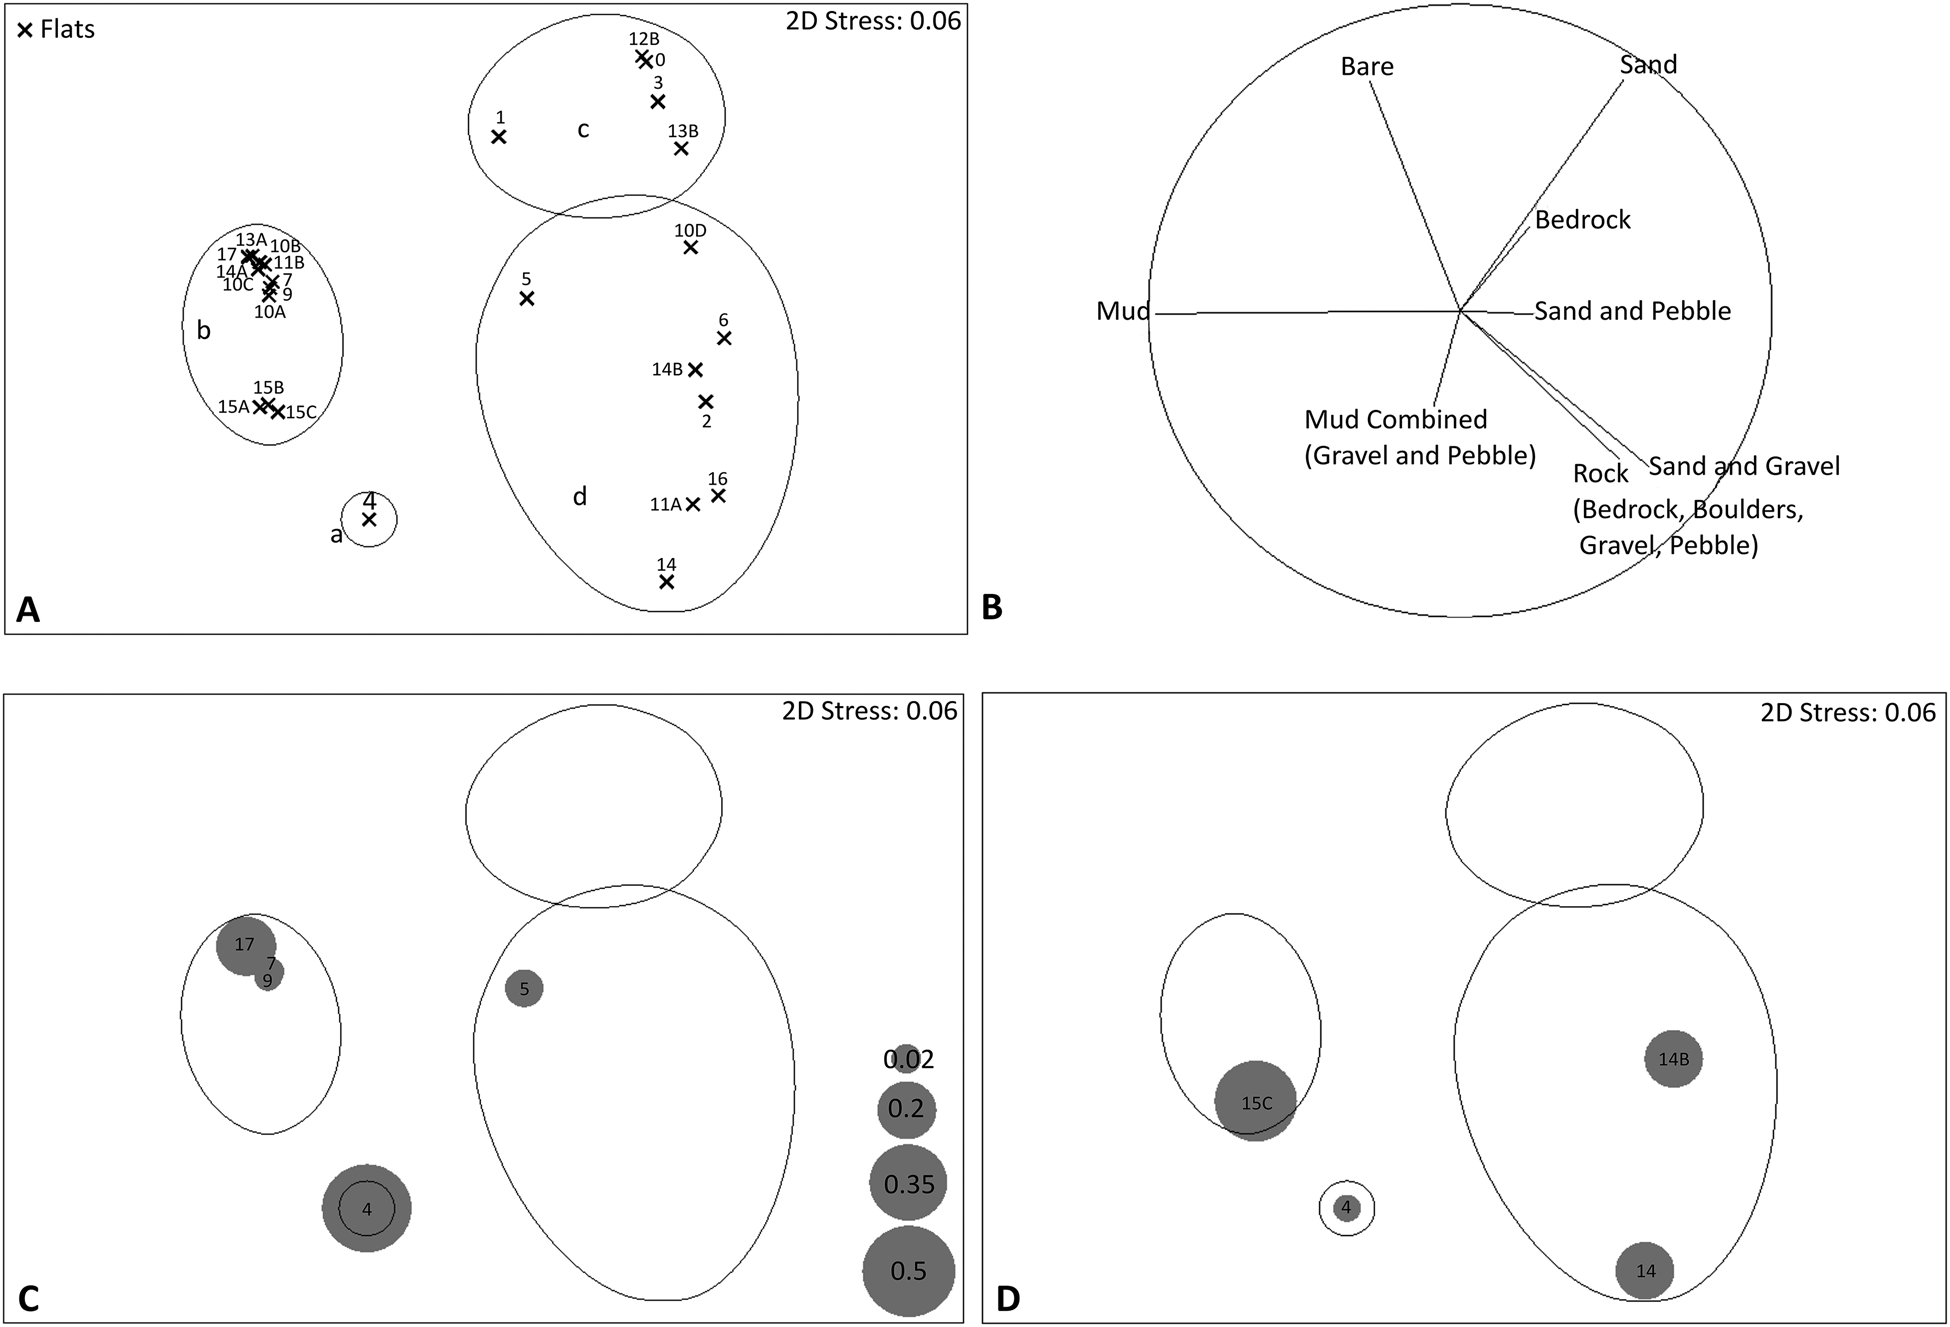
Benthic habitat at Davis Station (from transect surveys) included a diverse range of habitats, with four main habitat groups: sand, mud, rock and a variety of mixed habitats (Fig. 5b). Areas that were covered by macroalgae were mainly rock or a mixture of sediment and hard substrate (gravel or cobbles). The large white burrowing sea anemones were more abundant in sediment habitats (Fig. 5c), while the large peach sea anemones and the marbled sea anemones were more abundant in areas of hard substrate, such as rock, gravel and pebbles (Fig. 5d).
Habitat composition from tape surveys and sea anemone abundance at Davis Station. a. nMDS plot of habitat composition summed over locations (locations numbered). b. Vector plot of habitat variables correlated with nMDS axes in a. c. & d. Bubble plots of total sea anemone counts for c. white burrowing anemones and d. peach sea anemones, overlayed onto the nMDS plot of habitat composition (as in a.). Significantly different groupings circled in a., c. and d. are based on Davis Station habitat composition SIMPROF analysis.

Community patterns
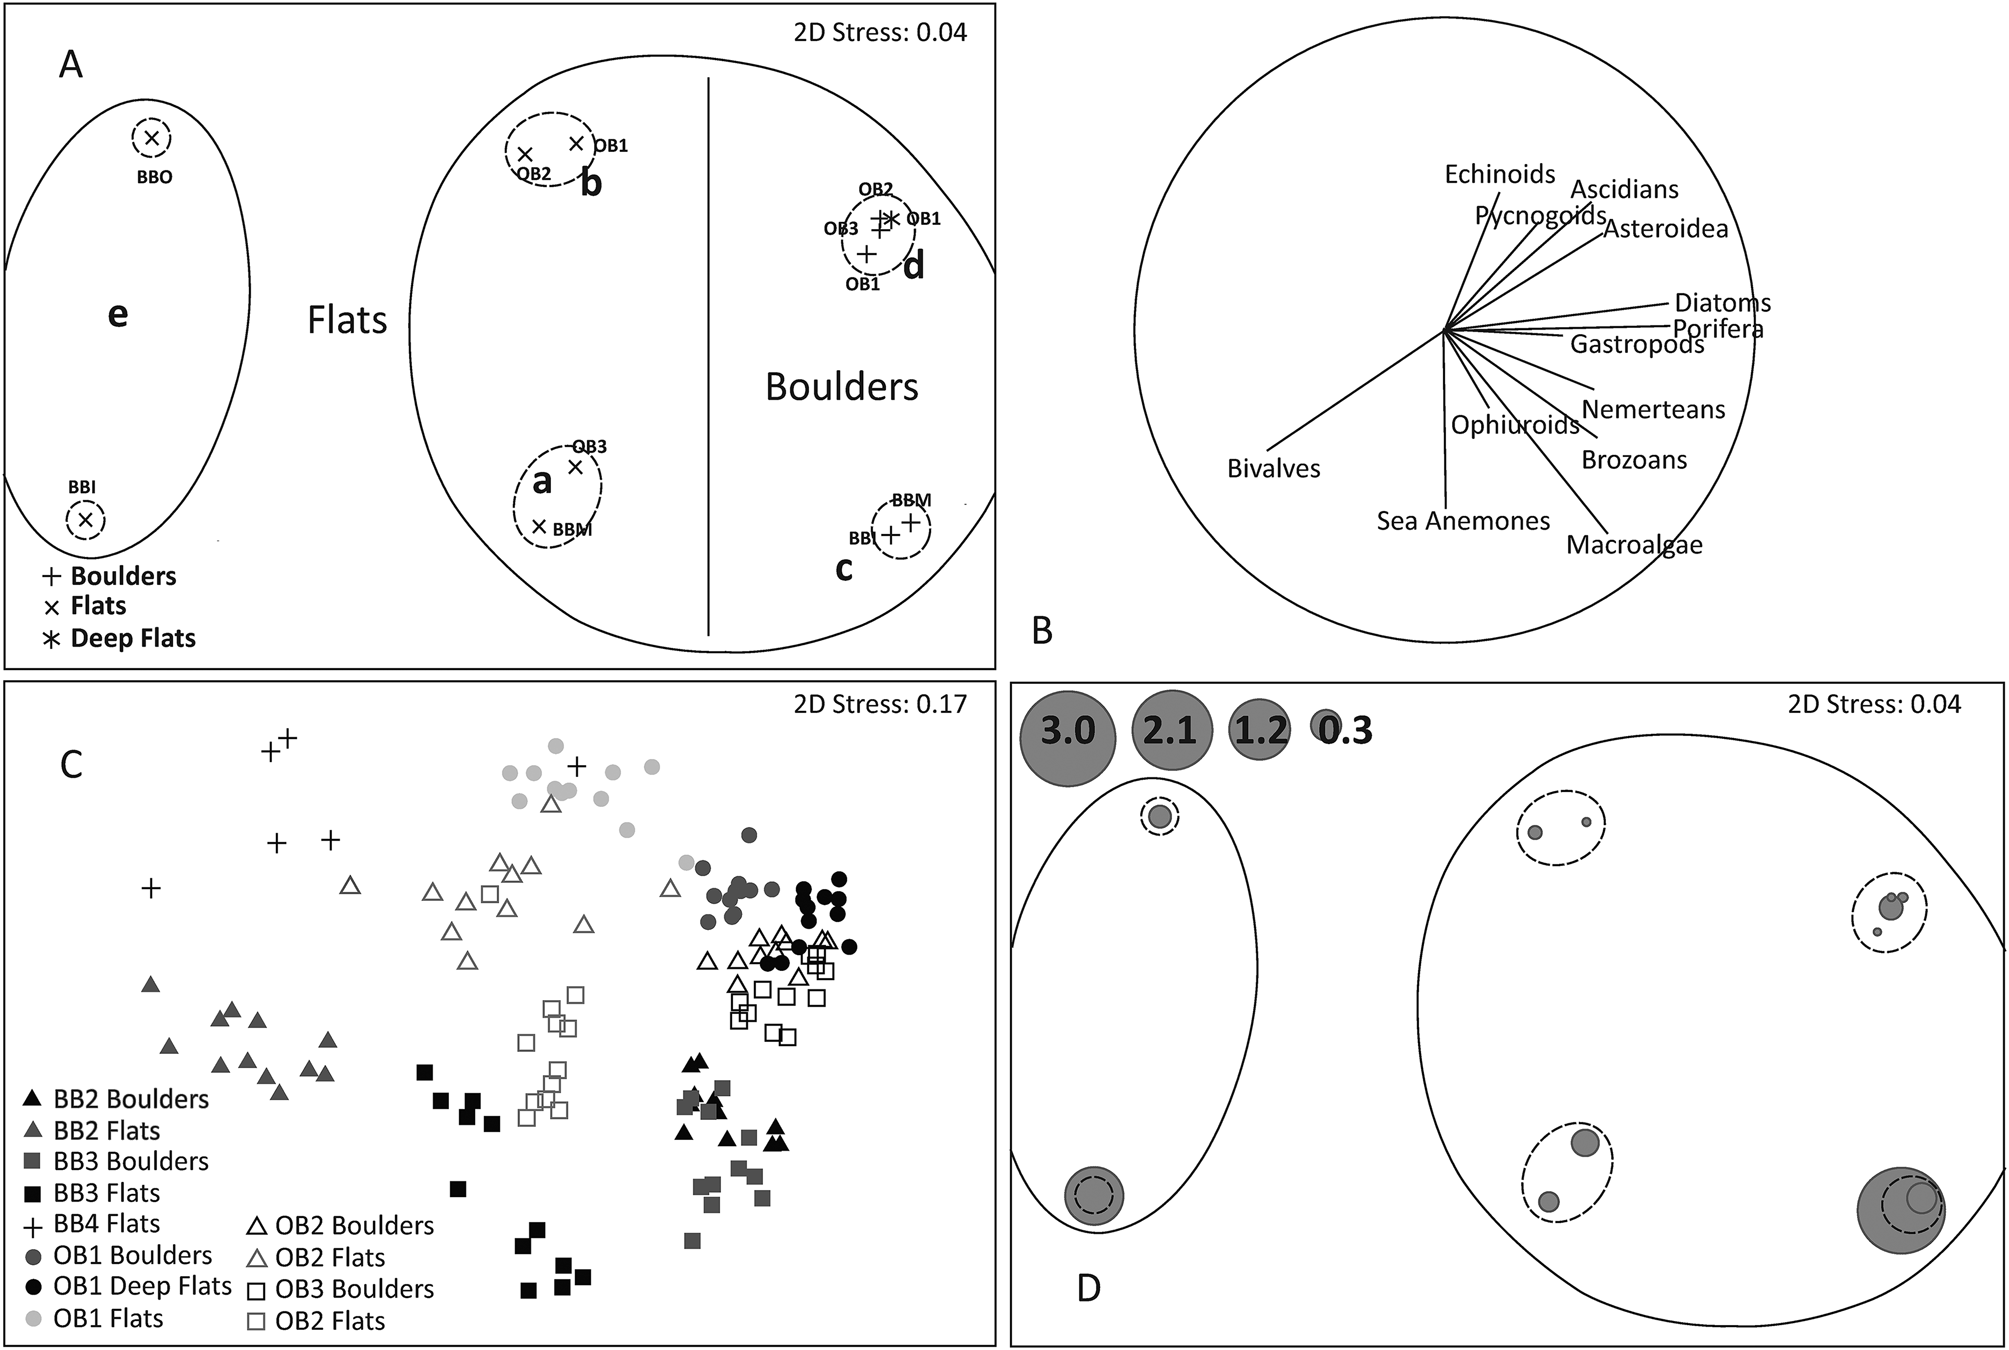
Analysis of the community patterns at Casey Station (by nMDS and cluster analysis, with a SIMPROF test) revealed distinct groups that were strongly related to habitat (Fig. 6); however, there were no specific correlations between sea anemones and any particular taxa at Casey Station. There were significant differences between the boulder and flat habitat communities, although the boulder habitats had a similar number of taxa (24) to the flat habitats (23). Brown Bay and O'Brien Bay locations differed in the types of taxa present except for OB3 flats, which were similar to BBM flats (Fig. 6). The peach sea anemones were most common at Brown Bay boulder communities along with bryozoans with algae, ophiuroids and nemerteans (Fig. 6). Brown Bay flats had fewer peach sea anemones and were more dominated by bivalves than any other region at Casey Station and were more similar to the flat habitats of O'Brien Bay.
Community composition at Casey Station. a. nMDS ordination of community counts averaged over each location. b. Vector plot of communities averaged over each location showing correlations of major taxa with nMDS axes in a. c. nMDS ordination of community counts averaged over plots within each location (n = 4–6 reports per plot, different shades and symbols represent the different locations; see Fig. 1). d. Bubble plot of average total sea anemone counts per location overlayed onto the nMDS plot of habitat composition. Significantly different groupings circled in a. and d. are based on SIMPROF analysis.

O'Brien Bay boulder communities had fewer peach sea anemones, but contained more species of sea anemone, with the presence of H. lacunifera and A. victrix. Ascidians were common in this habitat, along with echinoids, pycnogonids, asteroids and benthic diatom mats (Fig. 6). The deep flat communities at OB1 were very similar to boulder communities at other O'Brien Bay locations (Fig. 6a & c).
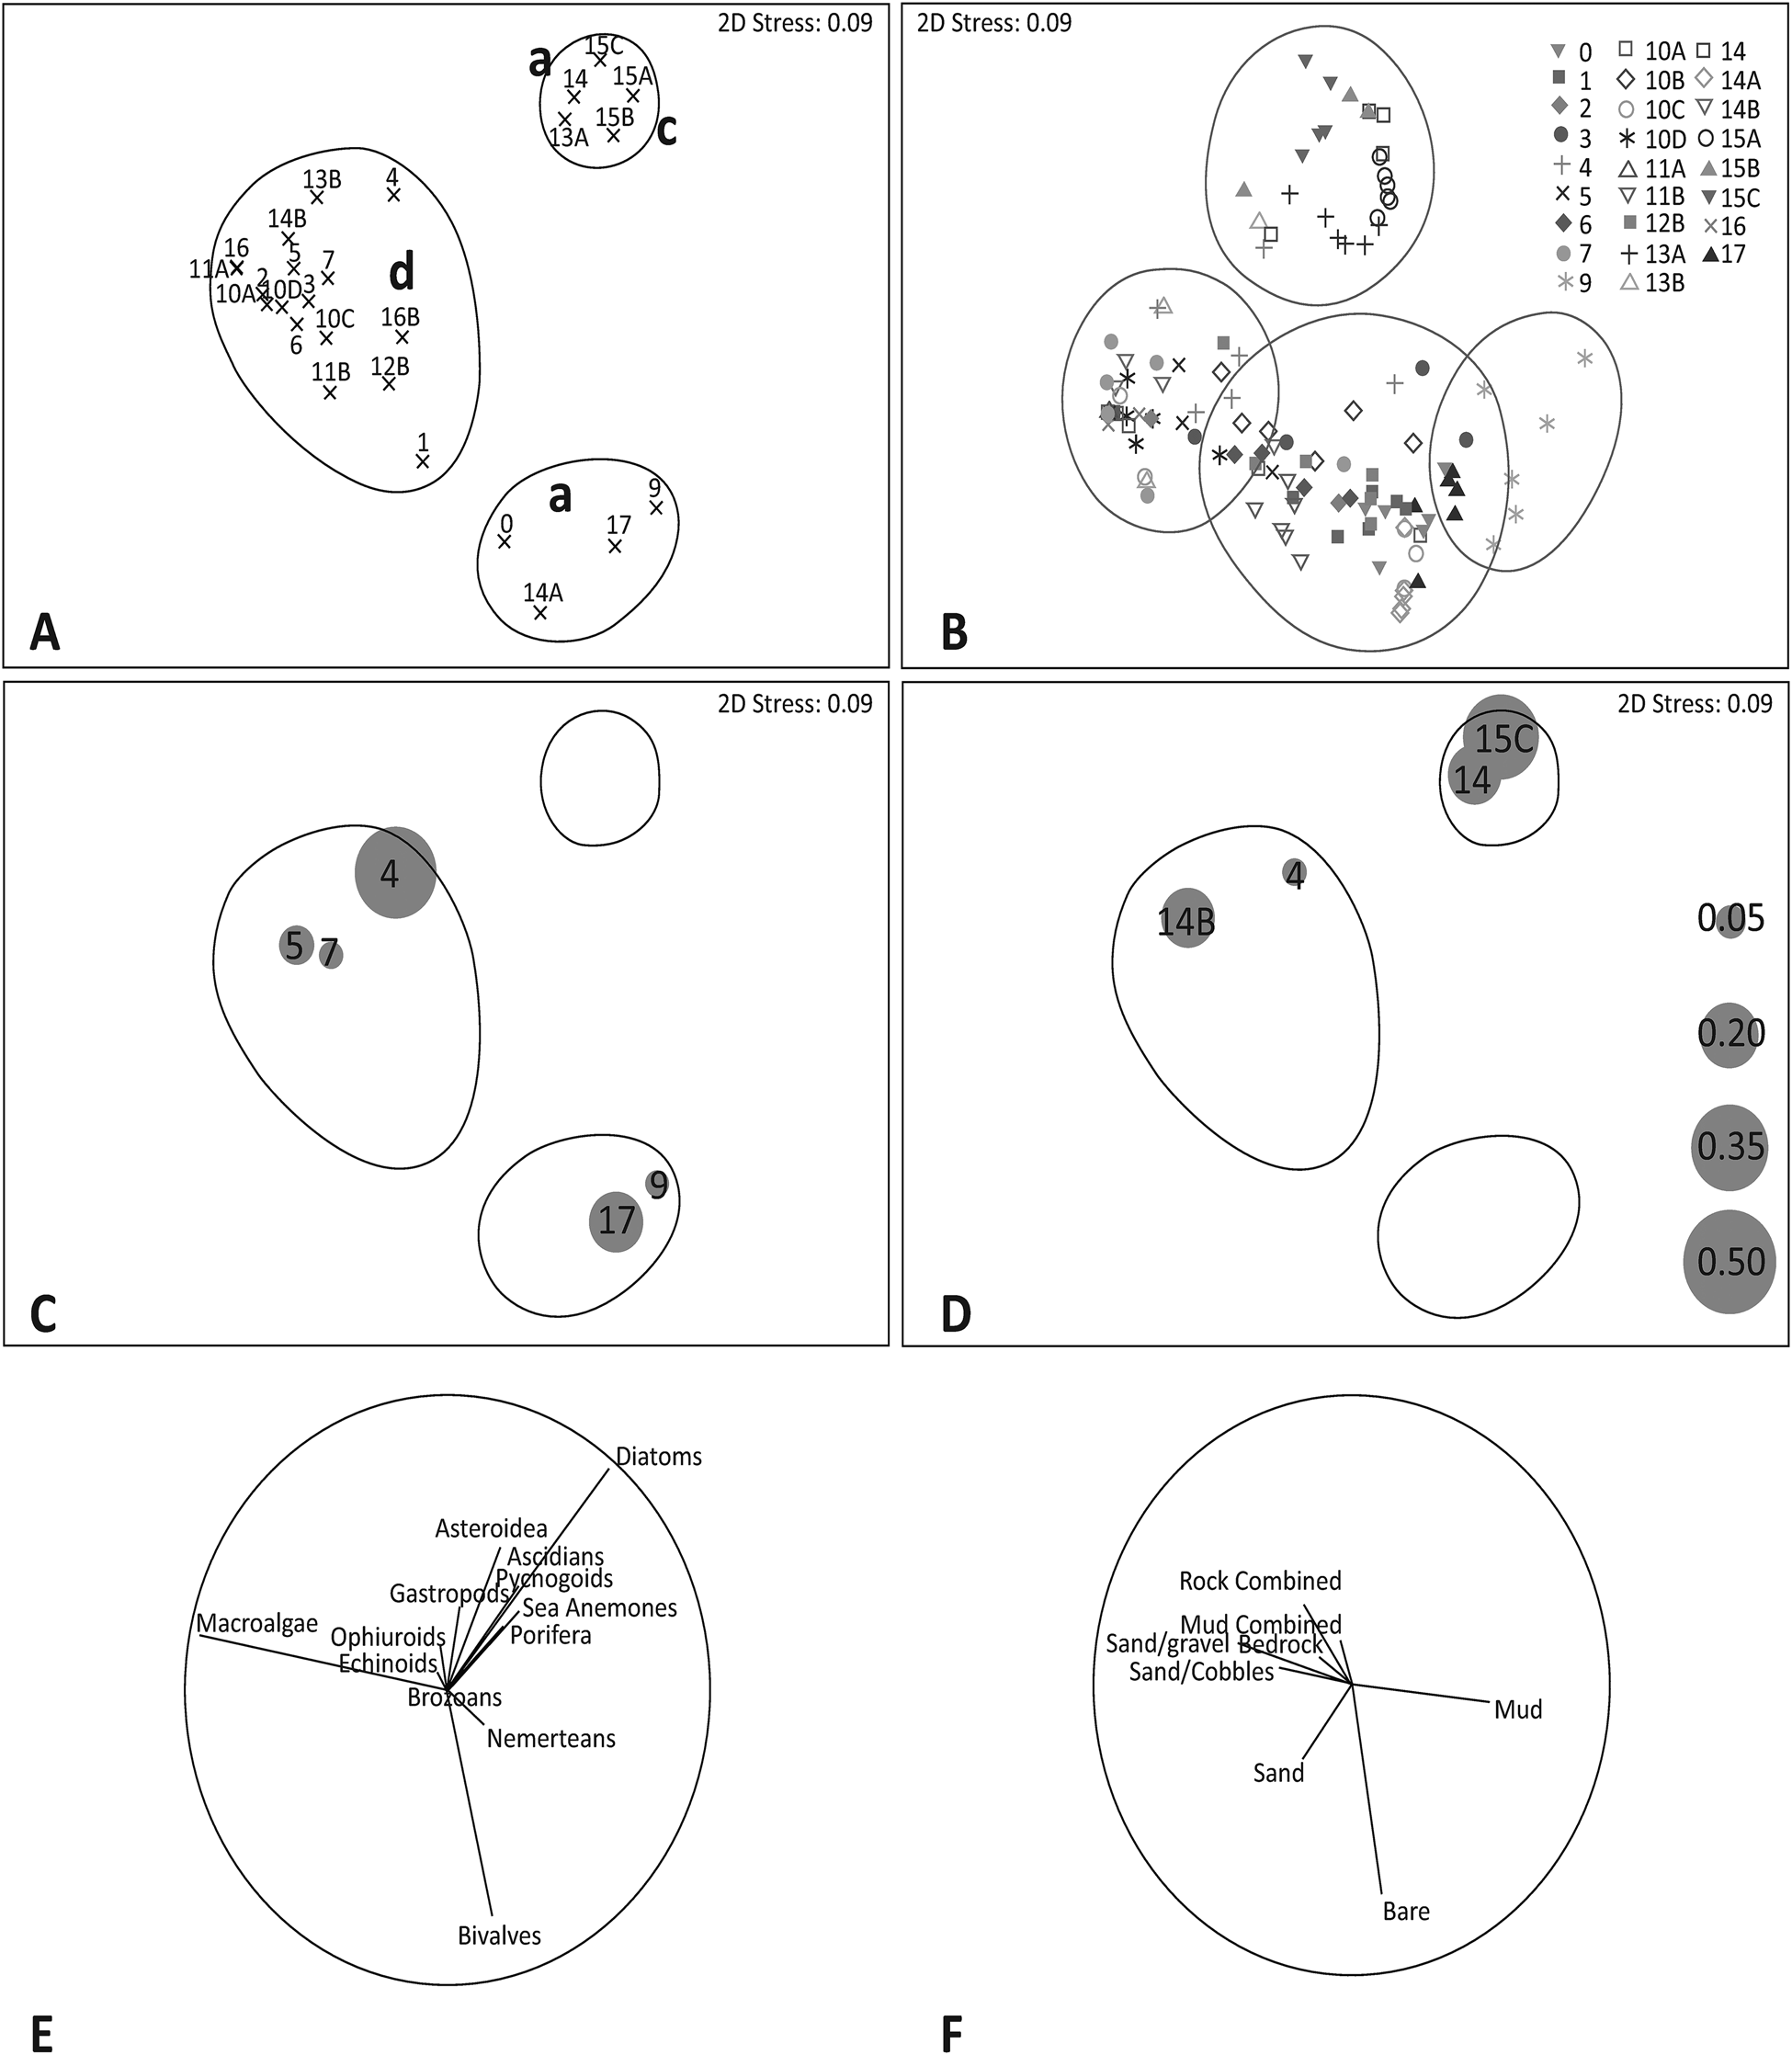
Analysis of community patterns at Davis Station (by nMDS and cluster analysis, with a SIMPROF test) showed three main groups of communities (Fig. 7a); however, there were no specific correlations with sea anemones or any other taxa present at Davis Station. Analysis at the plot and location level (Fig, 7a & b) showed similar patterns, with group D containing the peach sea anemones and the white burrowing sea anemones along with a diverse range of species (18, including echinoids, ophiuroids, gastropods and bryozoans). This group also showed high levels of macroalgae and consisted of a variety of mixed habitats. Groups A and C were not dominated by any particular taxa, but had a wide range of taxa present and a greater proportion of benthic diatom mats instead of macroalgae. The habitat compositions for groups A and C were a mixture of mud and rock sites. Group A consisted of only the white burrowing sea anemones and showed one of the lowest levels of diversity (eight taxa), with an increased association with sediment-dwelling bivalves and nemertean species. Group A habitats had a higher proportion of mud. Group C also had low diversity (eight taxa), but contained a mixture of species, including the peach sea anemone, and was dominated by ascidians, pycnogonids, Asteroidea and Porifera (Fig. 7d & e). Group D only contained site 15C, and the most common sea anemone was the marbled sea anemone alongside a variety of other taxa (12).
Community composition and sea anemone counts at Davis Station. a. nMDS ordination of community counts averaged over each location (locations numbered). b. nMDS ordination of community counts averaged over plots within each location (n = 4–6 reports per plot, different shades and symbols for the different locations; see Fig. 1). c. & d. Bubble plots of total sea anemone counts for c. white burrowing anemones and d. peach sea anemones and marbled sea anemones (site 15C), overlayed onto the nMDS plot of location community composition (as in a.). e. & f. Vector plots of e. communities and f. habitat variables averaged over each location showing correlations of major taxa with nMDS axes in a. Significantly different groupings circled in a., b., c. and d. are based on SIMPROF analysis.

Discussion
Sea anemones were found in the shallow benthic environment around Casey Station and Davis Station in a range of habitats; however, differences in survey design influenced the range of habitats sampled at each region. Sea anemone distribution was related to substrate type either as a mode for attachment, such as rocks and ascidians, or for burrowing in muddy, sedimentary habitats. Sea anemone abundance was significantly higher in locations at Casey Station that have increased human disturbance.
Distribution, abundance and relationships with habitat and other species
The Casey Station survey focused on sheltered rocky coves and embayments, which provide a different physical regime from some of the more open, exposed habitats included in the Davis Station survey. At Casey Station, there was a greater abundance of sea anemones in Brown Bay than at the locations in O'Brien Bay. This may be influenced by a variety of factors including habitat differences, physical environmental differences or human impacts. Habitat composition was different between Brown Bay and O'Brien Bay, with locations in Brown Bay having a higher percentage of hard substrate. Although they are mobile, sea anemones anchor themselves through the use of their basal discs, and rocky habitats provide suitable substrate for attachment for many sea anemone species (Ammons & Daly Reference Ammons and Daly2008, Lee et al. Reference Lee, Xie, Sun, Kei and Qiu2015).
Localized physical conditions such as sea ice duration may also affect sea anemone abundance in this region. Annual sea ice duration differs between the two bays. Brown Bay breaks out in late summer and therefore marine habitats are covered by sea ice for a longer period (and thus experience less potential disturbance by ice scour) compared to O'Brien Bay, which breaks out earlier in summer and has longer periods of open water (Baird & Stark Reference Baird and Stark2013, Clark et al. Reference Clark, Stark, Johnston, Runcie, Goldsworthy, Raymond and Riddle2013). Evidence of a link between life history traits and sea ice duration, extent and disturbance has been found for other species, such as the Antarctic amphipod Orchomenella franklini (Baird & Stark Reference Baird and Stark2013), the Antarctic scallop Adamussium colbecki (Chiantore et al. Reference Chiantore, Cattaneo-Vietti, Berkman, Nigro, Vacchi, Schiaparelli and Albertelli2001) and Antarctic hydroids (Casares & Cantero Reference Casares and Cantero2018).
There may also be influences from the former waste disposal site on the shore of Brown Bay; for example, sediments in Brown Bay have much great concentrations of organic carbon (Stark et al. Reference Stark, Riddle and Smith2004), which may have come from meltwater runoff in summer through the waste disposal site (Stark et al. Reference Stark, Riddle and Smith2004). Inputs of organic matter may influence the composition of benthic communities (Kim et al. Reference Kim, Thurber, Hammerstrom and Conlan2007, Sumida et al. Reference Sumida, Smith, Bernardino, Polito and Vieira2014), and the increase in organic matter in Brown Bay may provide a food source prior to sea ice breakout or attract greater numbers of potential prey items for sea anemones. At Davis Station, an analysis of nitrogen stable isotopes showed that sewage was likely to be taken up into the food chain and determined that feeding strategies may be important in the uptake (Stark et al. Reference Stark, Corbett, Dunshea, Johnstone, King and Mondon2016b). Sea anemones can utilize a variety of feeding methods, including filter-feeding and predation.
At Davis Station, the influence of habitat on sea anemone distribution was evident across the wide range of surveyed habitats, which included a greater proportion of locations dominated by sediments. The white burrowing sea anemones were more abundant in areas of fine, muddy sediments, but were also found in habitats that were a mixture of rock and sediment. Generally, in soft sediments there is a low volume of hard substrate materials for sea anemones to settle on and attach to, and they opportunistically utilize what little hard substrate materials may be present, such as mollusc shells (Schories et al. Reference Schories, Reise, Sanamyan, Sanamyan, Clasing and Reise2011). The peach sea anemones were found more often in rocky habitats. No sea anemones were found in the habitats that were predominantly sand. Large sea anemones have been found in sandy habitats, but are closely associated with plant species, such as sea grass (Hattori & Kobayashi Reference Hattori and Kobayashi2009), and the sea anemones depend on the rhizomes buried in the sediment to stay anchored (Schories et al. Reference Schories, Reise, Sanamyan, Sanamyan, Clasing and Reise2011). Other studies on anthozoan species have also shown that physical features and microhabitat affect the type of species that dominate an area (Fautin Reference Fautin1988).
Analysis of biological associations within epibiotic communities at both stations showed that the peach sea anemones were found in communities with a mixture of species, some of which require hard substrate for attachment (examples: Porifera and bryozoans) (Clark et al. Reference Clark, Raymond, Riddle, Stark and Johnston2015). The white burrowing sea anemone was found in less diverse epibenthic communities alongside other burrowing species that prefer sedimentary habitats, such as bivalves (Schiaparelli & Linse Reference Schiaparelli and Linse2006). Although found with other filter-feeding organisms, burrowing sea anemones have been observed either feeding advantageously on food particles in the water column or predating on larger prey items, such as polychaetes (Durden et al. Reference Durden, Bett and Ruhl2015). One particular sediment-dominated site at Davis Station (site 15C; Figs 6 & 7) had a very diverse epibenthic community. Photoquadrats from this site showed sea anemones utilizing ascidians as an attachment substrate. An association between sea anemones and ascidians was also observed in the Terre Adélie region of the Southern Ocean (Watson et al. Reference Watson, Stark, Johnstone, Wapstra and Miller2018). Ascidians have been described as ecological engineers, creating substrate for attachment for other benthic organisms (Rimondino et al. Reference Rimondino, Torre, Sahade and Tatian2015). The association between ascidians and sea anemones at site 15C provides further evidence of the important role that structure-forming invertebrates play as ecosystem engineers for sea anemones and other taxa in regions around Antarctica.
Anthropogenic disturbances
At Casey Station, sea anemones were more abundant near the former waste disposal site at Brown Bay than at control locations in O'Brien Bay. The highest numbers of sea anemones were found closest to the disposal site at BBI, with abundance decreasing with increasing distance from the shore to become similar to the O'Brien Bay sites. It is improbable that the higher numbers found at BBI are a stress response from the increased heavy metal and hydrocarbon concentrations within Brown Bay, but perhaps are more a response to the habitat factors mentioned above. Effects of metals on sea anemones in laboratory studies can be species-specific and vary among metals, but broadly include tentacle retraction, endosymbiotic loss and, in extreme cases, death (Mitchelmore et al. Reference Mitchelmore, Verde, Ringwood and Weis2003, Elran et al. Reference Elran, Raam, Kraus, Brekhman, Sher and Plaschkes2014). There is very limited information on the responses of sea anemones to hydrocarbons, but the adult sea anemone Nematostella vectensis showed little or no mortality in response to hydrocarbons and crude oil, although it did display changes in gene expression (Tarrant et al. Reference Tarrant, Reitzel, Kwok and Jenny2014).
Other studies examining sea anemone responses to environmental stress have found a decrease in abundance associated with anthropogenic impacts. For example, exposure to crude oil contamination initiated premature spawning of sea anemone larvae, decreasing juvenile survival rates (Ormond & Caldwell Reference Ormond and Caldwell1982). The Mediterranean sea anemone Actinia equina changed from asexual to sexual reproductive modes in response to an increase in sea temperatures towards the outer limits of their distribution (Chomsky et al. Reference Chomsky, Douek, Chadwick, Dubinsky and Rinkevich2009). As a result, there was a decrease in abundance in areas of stress, but an increase in genetic heterogeneity. The reproductive modes of the sea anemones from Casey and Davis Stations are unknown, and research on reproductive strategies amongst impacted and non-impacted sites may provide insight into whether environmental stress is causing a survival trigger effecting reproduction and sea anemone abundance in this region.
Conclusion
Photoquadrat surveys are a useful tool for understanding the ecology of large epibenthic invertebrates such as sea anemones. The influence of habitat on sea anemone density and abundance demonstrated the importance of taking habitat into consideration in such surveys. Surveys limited to specific habitats, such as that done at Casey Station, are important to understanding the influences on the distribution of sea anemones and the potential responses of sea anemones to environmental perturbations. For example, the peach sea anemones were found in greater abundances in boulder habitats and sites with a greater proportion of rock reef. In contrast, the survey done at Davis Station, across a wider range of habitat types, demonstrated interspecies sea anemone habitat preferences, with a white burrowing sea anemone only found in sediments and peach sea anemones found in greater abundances in rockier habitats. Photoquadrat surveys were useful to identifying key areas of sea anemone distribution in order to target in future studies, and they are a useful first step in understanding sea anemones and their potential for environmental monitoring.
Acknowledgements
We would like to thank Michela Mitchell from the Victoria Museum for her help with species identification. In addition, we would like to thank all of those that contributed to the fieldwork in Antarctica at both Casey and Davis Stations during the field season.
Author contributions
JSS and GJ devised the project and collected the data. JSS, GJ and LAW processed the data. LAW and JSS co-wrote the manuscript with significant input and editing from all authors.
Financial support
This work was supported by the Australian Antarctic Division (www.antarctica.gov.au), projects 2948, 4180 and 3051.
Data deposit
The data are part of a larger study currently being completed and are not yet available for open access.
Supplemental material
A supplemental table and two supplemental figures will be found at https://doi.org/10.1017/S0954102019000567.