I. INTRODUCTION
Recent interests on magnetoelectric materials are focused on the materials exhibiting simultaneous ferro/antiferromagnetic and ferroelectric (multiferroics) properties due to their wide range of possible applications in electronic devices.Reference Fiebig, Lottermoser, Fröhlich, Goltsev and Pisarev1, Reference Ramesh and Spaldin2 A large number of materials with lone pair containing elements, like Pb2+, Bi3+, etc., are being explored for coupled electric and magnetic polarization. In the aspect of lead-free environment friendly materials, significant attention had been paid to perovskite (ABO3, A = rare earth, Bi3+; B = transition metal ions like Fe, Mn, Cr, etc.) type materials and in particular on BiFeO3 and BiMnO3 due to their intrinsic high Curie temperature ferroelectric nature.Reference Prellier, Singh and Murugavel3–Reference Eerenstein, Mathur and Scott8 Similarly, a large magnetoelectric effect has been reported in hexagonal RMnO3Reference Yen, de la Cruz, Lorenz, Galstyan, Sun, Gospodinov and Chu9 and RMn2O5,Reference Noda, Kimura, Fukunaga, Kobayashi, Kagomiya and Kohn10 where R = rare-earth cation type materials have also been investigated. The role of magnetic frustration has been attributed to the enhanced magnetoelectric coupling in these materials. However, the intrinsic antiferromagnetic nature of BiFeO3 and RMnO3 compositions or low ferromagnetic transition temperature of BiMnO3 restricts the practical importance of these materials. In addition, these simple perovskites, R2BB′O6 (R = rare earth; B and B′ are 3d transition metal ions) type double perovskites are also being explored for the promising multifunctional properties.Reference Prellier, Singh and Murugavel3, Reference Noda, Kimura, Fukunaga, Kobayashi, Kagomiya and Kohn10–Reference Singh, Grygiel, Sheets, Boullay, Hervieu, Prellier, Mercey, Simon and Raveau20
Among the rare earth-based double perovskite, La2NiMnO6 (LNMO) is one of the most widely studied materials due to its large magnetodielectric properties and nearly ambient temperature ferromagnetic transition (280 K)Reference Yang, Lee, Koo and Jeong11–Reference Singh, Grygiel, Sheets, Boullay, Hervieu, Prellier, Mercey, Simon and Raveau20 It has been reported that LNMO is a ferromagnetic semiconductor, while end components LaMnO3 (LMO) and LaNiO3 (LNO) are of antiferromagnetic and paramagnetic nature, respectively.Reference Ritter, Ibarra, De Teresa, Algarabel, Marquina, Blasco, García, Oseroff and Cheong21, Reference Sánchez, Causa, Sereni, Vallet-Regí, Sayagués and González-Calbet22 Goodenough et al.Reference Goodenough, Wold, Arnott and Menyuk12 initially suggested the ferromagnetism in LNMO is due to Mn3+–O–Ni3+ super exchange interactions while BlasseReference Blasse14 suggested the ferromagnetism is entirely due to Mn4+–O–Ni2+ super exchange interactions. Further studies on La2NiMnO6 suggest the sample prepared in air by solid-state reaction consists of two ferromagnetic (monoclinic and rhombohedral) phases with comparable T c.Reference Dass, Yan and Goodenogh16, Reference Asai, Sekizawa and Iida23, Reference Bull, Gleeson and Knight24 However, in the absence of long-range ordering of the Ni and Mn, the most predominant interactions in La2NiMnO6 arising from the Ni–O–Ni and Mn–O–Mn links are antiferromagnetic. Thus, it is assumed that the disordered octahedral cations interact ferromagnetically by vibronic super-exchange coupling.Reference Yang, Lee, Koo and Jeong11 It has also been mentioned that the orthorhombic distortion of the cation disordered lattice is sensitive to the annealing conditions due to the effect of oxygen nonstoichiometry.Reference Dass, Yan and Goodenogh16, Reference Blasco, Garacia, Sanchez, Campo, Subias and Perz-Cacho19
Booth et al.Reference Booth, Fillman, Whitaker, Abanti Nag, Tiwari, Ramanujachary, Gopalakrishnan and Lofland17 have studied a series of cation ordered monoclinic R2NiMnO6, R = rare earth and Y compositions and reported a decreasing trend in ferromagnetic transition temperature with a decrease in the ionic radius of R3+ ion. Because of the differences in crystal structure of the end members (LMO and LNO), LNMO is likely to exhibit different polymorphism than the end member structures. The cation ordering and magnetic properties of bulk LNMO have been a subject of research in a large number of studies. Several reports indicate absence of any cation ordering in the LNMO lattice while others indicate fully or partially cation ordered lattices.Reference Rogado, Li, Sleight and Subramanian15, Reference Blasco, Garacia, Sanchez, Campo, Subias and Perz-Cacho19, Reference Singh, Grygiel, Sheets, Boullay, Hervieu, Prellier, Mercey, Simon and Raveau20, Reference Asai, Sekizawa and Iida23, Reference Bull, Gleeson and Knight24 The existence of Mn4+, Mn3+, Ni2+, and Ni3+ in the ferromagnetic LNMO sample has been reported.Reference Blasco, Garacia, Sanchez, Campo, Subias and Perz-Cacho19, Reference Asai, Sekizawa and Iida23, Reference Bull, Gleeson and Knight24 The presence of Jahn–Teller distortions in transition metal polyhedra in LNMO have been observed by neutron diffraction studies.Reference Dass, Yan and Goodenogh16, Reference Bull, Gleeson and Knight24 Studies on similar double perovskites with composition, La2CoMnO6, in bulk or thin films also indicate annealing conditions dependent of magnetic and structural properties.Reference Dass and Goodenough25–Reference Singh, Truong, Jandl and Fournier27 The La2CoMnO6 sample prepared at high temperature (~1623 K) shows cation ordered monoclinic lattice while those prepared at lower temperature (~873 K) show pseudotetragonal lattice. In addition, the magnetic properties of La2CoMnO6 show ferromagnetic transition temperature from 226 to 200 K and additional second ferromagnetic transition around 180 to 130 K depending on the atmosphere used for the synthesis.Reference Dass and Goodenough25
Recently, Singh et al.Reference Singh, Truong, Jandl and Fournier26 have reported the role of annealing temperature and atmosphere in controlling cation ordering and magnetic properties of La2CoMnO6 thin films. The cation ordered thin film of La2CoMnO6 can be grown in a narrow range of temperature and oxygen partial pressure (temperature ~1173 K and oxygen partial pressure ~800 mTorr). Any deviation from this condition resulted either in fully or partially disordered lattice in thin films of La2CoMnO6 and La2NiMnO6.Reference Singh, Truong, Jandl and Fournier26, Reference Singh, Truong, Jandl and Fournier27 The cation ordered and disordered lattices for LNMO have been related to the method of preparation and post heat treatment. The cation ordering in the perovskites type compounds are driven by the difference in the ionic radii and charge of the octahedral cations. However, very close ionic radii Ni and Mn prefer to have a cation disordered lattice, while possible valence states of the Ni and Mn can lead to cation ordered lattice in LNMO. The coexistence of both the ordered and disordered lattices with different symmetries makes the LNMO system more complicated magnetically. Thus, it makes a real challenge and interest in getting multiferroic materials with double perovskite lattice.
The dielectric behavior of the LNMO has been reported for bulk and thin film samples. Rogado et al.Reference Rogado, Li, Sleight and Subramanian15 have reported a significant effect of magnetic field on the relaxor-like property of LNMO. The dielectric properties of monoclinic R2NiMnO6 investigated by Booth et al.Reference Booth, Fillman, Whitaker, Abanti Nag, Tiwari, Ramanujachary, Gopalakrishnan and Lofland17 indicate relative permittivity in the range of 15–25 with low loss parameters. Lin et al.Reference Lin, Chen and Liu28 have reported relaxor-type dielectric behavior in polycrystalline LNMO samples at lower temperature and lower frequency, which vanishes at higher frequencies. The presence of variable valence states of the transition metal ions, as mentioned earlier, can lead to ferroelectric or relaxor-like behavior in LNMO.Reference Lin, Chen and Liu28 Such charge frustration leading to ferroelectric (electronic ferroelectric) and magnetic polarization has been observed in several materials, like RFe2O4, RFeMO4 (M = Co, Cu) and RGaCu2O4, where R = Yb and Lu.Reference Yoshii, Ikeda, Matsuo, Horibe and Mori29, Reference Ikeda, Ohsumi, Ohwada, Ishii, Inami, Kakurai, Murakami, Yoshii, Mori, Horibe and Kito30
To study the relation of magnetic and dielectric properties with the annealing environment and their possible origins, we have carried out a systematic study on the well-characterized LNMO. It is observed that an LNMO sample annealed in air shows a dielectric anomaly near the ferromagnetic transition temperature at lower frequency, but the anomaly disappears on annealing this sample in oxygen or nitrogen atmosphere. However, the ferromagnetic fraction is significantly enhanced on annealing in oxygen atmosphere. The observed magnetic and dielectric behaviors of samples in response to the oxygen partial pressure are discussed in this work.
II. EXPERIMENTAL
The LNMO sample was prepared by the gel combustion method from the component nitrates and glycine. The amorphous material thus obtained was calcined at 923 K and then heated at 1523 K for 24 h in air. Pellets of the preformed sample of LNMO were annealed in static air (LNMO-A), flowing oxygen (LNMO-O), and N2 (LNMO-N) atmosphere at 1123 K for 8 h. The phase characterization of these materials was carried out by powder x-ray diffraction (XRD) data recorded on a Panalytical X-pert pro diffractometer (The Netherlands) using Cu Kα radiation. The XRD data were collected in the two-theta range of 15°–90° with step width and time as 0.02° and 2.50 s, respectively. At higher temperature XRD data were recorded using an Anton Parr high temperature attachment (The Netherlands) with a platinum strip as sample holder and heater. The powder neutron diffraction (ND) data recorded at Dhruva Research Reactor, BARC, Mumbai, using neutron of wavelength 1.249 Å. The low temperature neutron diffraction patterns were recorded at several temperatures below ambient temperature using a closed-cycle refrigerator-based cryostat. At each temperature the sample was equilibrated for about an hour and diffraction data were collected between 10° and 140° in about 10 h. The observed XRD and ND data were analyzed by the Rietveld method using the Fullprof-2K software package.Reference Rodriguez-Carvajal31
The magnetic properties of the samples were investigated (between 5 and 300 K) using a superconducting quantum interference device (SQUID) magnetometer (Quantum Design, USA) in both field-cooled (FC) and zero-field-cooled (ZFC) condition. The hysteresis loops of the sample were also recorded at several temperatures. The dielectric properties of the samples in pellet form were studied at several frequencies using a Novacontrol Alpha AN impedance analyzer and Quatro nitrogen cryosystem (Germany) in the temperature range of 160–300 K at several frequency points. Cylindrical pellets (10 mm diameter and 2 mm thickness) of about 85% of theoretical densities were used for dielectric measurements. Silver paint was applied on the sample pellets for proper electrical contact and sandwiched between gold-plated electrodes in a parallel plate configuration for dielectric property measurements.
III. RESULTS AND DISCUSSION
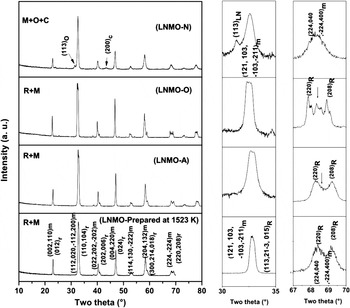
The gray fluffy powder obtained after the gel combustion was amorphous. However, it turns dark gray and crystalline when heated at 1523 K for 24 h in air. The powder XRD pattern shows typical reflections attributable to the La2NiMnO6 without any other reflections attributable to any possible secondary phases. Further studies were carried out from this preformed LMNO powder. XRD patterns of the LNMO samples annealed in different atmospheres are shown in Fig. 1. For comparison, the XRD pattern of sample prepared at 1523 K is included in Fig. 1. The XRD pattern recorded after 1523 K and that obtained for the sample annealed at 1123 K in air do not show any significant difference and indicate no drastic change in the phase of the prepared sample. The annealing temperature is appreciable for causing any significant change in crystal structure and composition. In addition, the temperature around 1073 K has been used for observing cation ordered structure of La2NiMnO6 thin films due to appreciable cation migration. As such rare-earth perovskites crystallize either in the GdFeO3-type orthorhombic lattice or LaCoO3-type rhombohedral lattice with trivalent transition metal ions. In particular, manganates of lighter rare-earth elements have either orthorhombic or rhombohedral lattice depending on the method or preparation and oxygen stoichiometry. In the orthorhombic (Pnma) lattice the Ni and Mn are occupied statistically in 4b (1/2, 0, 0) sites and have two crystallographically distinct oxygen sites, namely 4c and 8d. However, in the cation ordered lattice the symmetry is lowered from Pnma to P21/n with Ni and Mn segregated to 2c (0,1/2,0) and 2d (1/2,0,0) sites. A rhombohedral feature is observed in the XRD data of LNMO-A sample (Fig. 1). However, the exact profile shape of the intense peak at 32.6° (Fig. 1) indicates an additional coexisting phase. The observed powder XRD data of the LNMO-A sample was analyzed by Rietveld refinement by considering the details of earlier reported cation disordered Pnma and  Reference Dass, Yan and Goodenogh16, Reference Blasco, Sanchez, Peraj-Cacho, Garacia, Subias and Campo18 or cation ordered P21/n and
 lattices.Reference Blasco, Garacia, Sanchez, Campo, Subias and Perz-Cacho19, Reference Bull, Gleeson and Knight24 The XRD pattern clearly demonstrates the coexistence of rhombohedral and orthorhombic phases, however, no significant differences are observed for the trials with cation ordered or disordered models. This can be attributed to the smaller difference in the x-ray scattering factor of Ni and Mn. Thus, further analysis of the sample was carried out from the powder ND data.
Powder XRD patterns of LNMO samples (Cu Kα radiation). [Indices of observed peaks are marked, subscripts m and r indicate monoclinic (M) and rhombohedral (R) phase].

The powder ND data of the LNMO-A sample were analyzed by Rietveld refinement similar to the powder XRD data. We have considered the cation ordered monoclinic (P21/n) and rhombohedral  lattices as well as cation disordered orthorhombic (Pnma) and rhombohedral
 lattices for the refinement of the ND data. The background of the neutron diffraction data was modeled using linear interpolation of selected points and the Bragg peak was modeled using the pseudo-Voigt profile function. A clear evidence of cation ordering is observed from the intensity matching of the neutron diffraction profile with those calculated by ordered and disordered models. Thus, we limited our further studies to the cation ordered P21/n and
 models only. The scale factor and unit cell parameters were refined in the initial cycles followed by profile and other structural parameters. After getting a proper match in the profile, the positional parameters and thermal parameters were refined. The distribution of the Ni and Mn in the octahedral 2c and 2d sites of the P21/n and 3a and 3b sites of
 lattices are carried out using the constraint of Ni:Mn = 1:1 in both phases. The quantitative analysis of the rhombohedral and monoclinic phase was obtained from the full structural refinement of the powder ND data. The goodness of the refinements was observed by the residuals (R values) and difference plots. The weight fraction of the coexisting rhombohedral
 and monoclinic (P21/n) in the LNMO-A sample are 69(5)% and 31(4)%, respectively. The refined unit cell parameters for the two phases observed in LNMO-A are: a = 5.497(1), c = 13.216(4) Å, V = 345.9(1) Å3, and Z = 3 (for Rhombohedral,
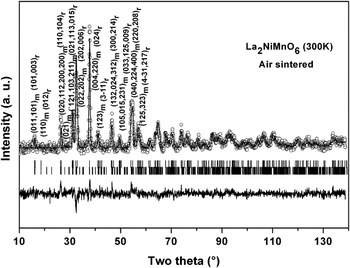
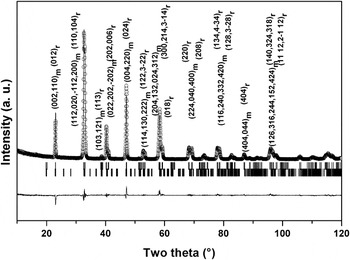
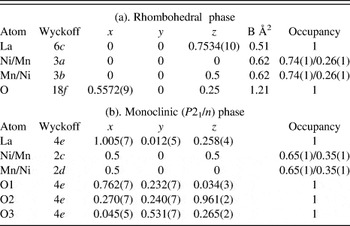
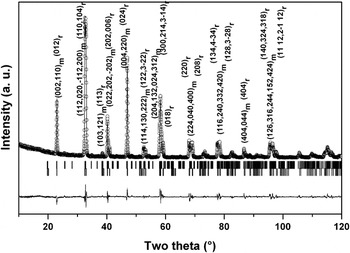
 phase); a = 5.432(3), b = 5.485(3), c = 7.739(4) Å, β = 89.71(6)°, V = 230.6(2) Å3, and Z = 4 (for Monoclinic, P21/n phase). Refined structural parameters for LNMO-A as observed from powder neutron diffraction data are given in Table I. The typical Rietveld refinement plots of powder neutron diffraction and XRD data of the LNMO-A sample are shown in Figs. 2 and 3, respectively.
Rietveld refinement plot of powder neutron diffraction data of LNMO-A sample. Vertical lines indicate Bragg positions for rhombohedral  phase (upper) and monoclinic (P21/n). phase (lower). (Rp = 6.01, Rwp: 7.72, and χ2 = 3.46). (Indices of selected peaks are only marked)
 : a = 5.497(1) and c = 13.216(4) Å, V = 345.9(1) Å3. Weight fraction = 69(5)% P21/n: a = 5.432(3), b = 5.485(3), c = 7.739(4) Å, β = 89.71(6)°, and V = 230.6(2) Å3. Weight fraction = 31(4)%

Rietveld refinement plot of powder XRD data of LNMO-A sample. Vertical lines indicate Bragg positions for rhombohedral  . phase (upper) and monoclinic (P21/n) phase (lower). (Indices of selected peaks are only marked. Subscripts m and r indicate monoclinic and rhombohedral phases).

Structural parameters of LNMO-A at 300 K (from powder neutron diffraction data).

Bov = 1.1(1) Å2.
The cation distribution as observed from the powder neutron diffraction data indicates a significant amount of antisite disorder in the 2c and 2d sites of monoclinic phase as well as 3a and 3b sites of the rhombohedral phase. The typical disordering in the Ni and Mn sites are about 26% in the rhombohedral phase and 35% in the monoclinic phase. It can be mentioned here that earlier structural refinement by Lin et al.Reference Lin, Chen and Liu28 and Booth et al.Reference Booth, Fillman, Whitaker, Abanti Nag, Tiwari, Ramanujachary, Gopalakrishnan and Lofland17 from powder XRD data indicates fully cation ordered monoclinic P21/n lattice for LNMO. However, from powder neutron diffraction data, Bull et al.Reference Bull, Gleeson and Knight24 have reported about 15% antisite disorder monoclinic LNMO at ambient temperature and transforms to the rhombohedral phase with a similar order of cation disordering at a higher temperature. Thus, it can be concluded that the cation ordering in the LNMO is governed mainly by the preparation condition and that remains unchanged under postannealing, whereas the fully cation disordered orthorhombic and/or rhombohedral lattices have been reported in powder XRD studies of Blasco et al.Reference Blasco, Sanchez, Peraj-Cacho, Garacia, Subias and Campo18 Thus, the conclusion about the fully cation ordering reported by Lin et al.Reference Lin, Chen and Liu28 and Booth et al.Reference Booth, Fillman, Whitaker, Abanti Nag, Tiwari, Ramanujachary, Gopalakrishnan and Lofland17 need to be considered with the limitation of XRD.
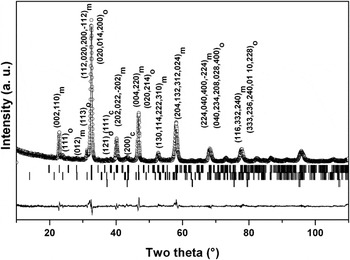
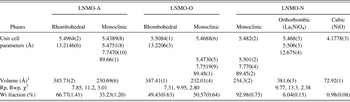
Using the refined structural parameters and occupation numbers obtained from the ND studies, the XRD patterns of samples annealed in oxygen (LNMO-O) or inert (LNMO-N) atmosphere were analyzed by the Rietveld method in a similar manner. The refined unit cell parameters and phases observed in these two samples are given in Table II. The Rietveld refinement plots of powder XRD data of these two samples are shown in Figs. 4 and 5. It is observed that on annealing in oxygen atmosphere the fraction of monoclinic phase increases [weight fractions of monoclinic and rhombohedral phases in LNMO-O are 50(1)% and 50(1)%]. However, in LNMO-N, a phase separation to La2NiO4, La and Ni deficient perovskite type and NiO is observed.
Rietveld refinement plot of powder XRD data of LNMO-O sample. Vertical lines indicate Bragg positions for rhombohedral  phase (lower) and monoclinic (P21/n) phase (upper). (Indices of selected peaks are only marked. Subscripts m and r indicate monoclinic and rhombohedral phases.)

Rietveld refinement plot of powder XRD data of LNMO-N sample. Vertical lines indicate Bragg positions for monoclinic (P21/n) phase (upper), orthorhombic La2NiO4 (Bmab) phase (middle), and cubic, NiO (Fm3m) phase (lower). Indices of selected peaks are only marked. (Subscripts m, o, and c indicate monoclinic, orthorhombic, and cubic phases.)

Unit cell parameter of LNMO sample treated in different atmospheres (from powder XRD data).

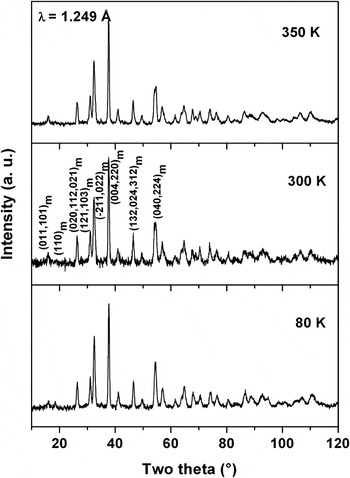
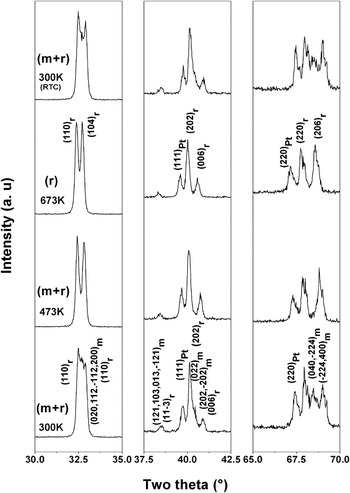
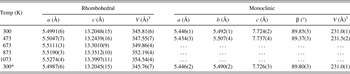
Furthermore, the temperature variations of structural changes of the LNMO-A sample were investigated by ND (below ambient temperature) and XRD (above ambient temperature) studies. All the variable temperature diffraction studies were carried out in static air. Typical powder diffraction data of LNMO-A at some temperatures are shown in Figs. 6 and 7. Similar to the ambient temperature diffraction data, the neutron diffraction data recorded at a lower temperature were analyzed by the Rietveld method. The refined unit cell parameters of these two phases show a feeble decreasing trend with lowering in temperature. The refined unit cell parameters at different temperatures and the corresponding quantitative phase analysis data are summarized in Table III. It is observed from Table III that the monoclinic phase fraction increases as the temperature is lowered. The diffraction data recorded at 473 K show significant amounts of rhombohedral phase, while those recorded at and above 673 K show only rhombohedral phase. The monoclinic to rhombohedral phase transformation of LNMO is in agreement with that reported earlier (648 KReference Bull, Gleeson and Knight24). The unit cell parameters of the LNMO sample were determined at different temperatures by the Lebail profile refinement method and they are given in Table IV. The XRD pattern recorded at ambient temperature after cooling from 1073 K [shown in Fig. 7, as 300 K (RTC)] is similar to that observed at 300 K before heating. Thus, it is inferred that the monoclinic and rhombohedral phase formation depend on the preparation condition. The coexistence of these two phases is related to the competing relative stability of the two phases.Reference Blasco, Sanchez, Peraj-Cacho, Garacia, Subias and Campo18 The environment-dependent phase evolution is further reflected in the magnetic and dielectric properties of LNMO as explained below.
ND plots of LNMO-A sample at different temperatures (recorded in air, λ = 1.249 Å). (Indices of selected peaks are only marked. Subscript m indicates monoclinic phase.)

Selected peaks of XRD patterns of LNMO-A sample at different temperature (recorded in air, λ = Cu Kα). (Indices of peaks are marked in figure. Subscripts m and r indicate monoclinic and rhombohedral phases). (RTC, indicate the XRD data recorded after cooling the sample to ambient temperature after recording the high temperature data.)

Unit cell parameter of LNMO-A sample at different temperatures (from powder neutron diffraction data).

Unit cell parameter of LNMO-A sample at different temperatures (from powder XRD data).

* Data recorded after cooling to ambient temperature (300 K, RTC).
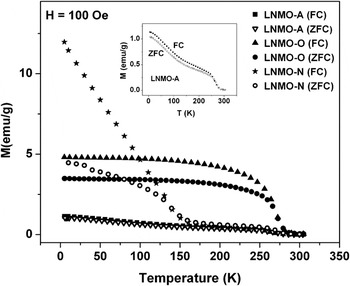
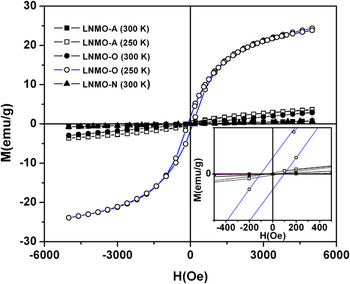
The influence of the annealing atmosphere on the magnetic properties of LNMO was studied by temperature- and field-dependent magnetization. The temperature-dependent magnetization of the sample recorded in FC and ZFC conditions are shown in Fig. 8. Around 275 K, a weak indication of ferromagnetic transition is observed in the case of the LNMO-A sample, while a sharp rise in magnetization is observed in the LNMO-O sample. Ferromagnetic transition temperatures (T c) for the LNMO-O and LNMO-A samples obtained from the change in slope of variation of magnetization with temperature plots are 278 and 272 K, respectively. In addition to this transition, an additional ferromagnetic transition around 100 K is observed in the LNMO-A sample. Similar multiple ferromagnetic transitions have been reported in partially ordered La2CoMnO6 thin films.Reference Singh, Truong, Jandl and Fournier26 A ferromagnetic hysteresis loop with small remanent magnetization and coercive field is observed at 250 K in the LNMO-O sample while all other samples do not show any hysteretic behavior (Fig. 9). The observed transition temperature is similar to the earlier reported T c of LNMO.Reference Goodenough, Wold, Arnott and Menyuk12, Reference Blasse14, Reference Blasco, Sanchez, Peraj-Cacho, Garacia, Subias and Campo18, Reference Blasco, Garacia, Sanchez, Campo, Subias and Perz-Cacho19 Furthermore, it can be added here that the ZFC and FC for the LNMO-O sample show large separation compared to the LNMO-A sample. However, it is important to mention here that the magnetization behavior of LNMO-A and LNMO-O samples show significantly different values of magnetization at 5 K for an applied field of 100 Oe, namely Ms ~4.5 emu/g for LNMO-O and Ms ~1.0 emu/g for LNMO-A. Earlier studies of Blasco et al.Reference Blasco, Sanchez, Peraj-Cacho, Garacia, Subias and Campo18, Reference Blasco, Garacia, Sanchez, Campo, Subias and Perz-Cacho19 on the magnetic properties of LaNi0.5Mn0.5O3+δ, indicate a ferromagnetic transition temperature in between 265 and 285 K depending on the oxygen stoichiometry. Furthermore, they have mentioned that the Ni/Mn ratio is sensitive for the structure and magnetic properties. The compositions with Ni/Mn >1 preferentially form  structure with T c < 265 K while compositions with Ni/Mn <1 form orthorhombic (Pnma) structure with T c < 200 K. In this study the observed transition temperature of 275 K is in agreement with the Ni/Mn = 1 stoichiometry reported by Blasco et al.Reference Blasco, Garacia, Sanchez, Campo, Subias and Perz-Cacho19
Temperature dependent (FC and ZFC) magnetizations of LNMO-O, LNMO-A, and LNMO-N samples. (Inset shows magnified image of LNMO-A data.)

Magnetic hysteresis loops of LNMO-O, LNMO-A, and LNMO-N samples. (Inset shows magnified image at lower applied field.)

As mentioned earlier, both the LNMO-A and LNMO-O samples have coexisting rhombohedral and monoclinic phases. The increasing monoclinic phase in the oxygen annealed sample seems to be a responsible phase for the ferromagnetic behavior. The Ni2+–O–Mn4+ super exchange interactions as explained for the LNMO is a governing factor of the ferromagnetism in this sample. On the other hand, the sample annealed in the inert atmosphere shows only a weak fraction of ferromagnetism in addition to a sharp increase in magnetization (T c) around 150 K. This feature is comparable to the magnetic properties of the cation disordered rhombohedral LaMnO3+x phase (x ≥ 0.1).Reference Dass, Yan and Goodenogh16 It may be mentioned here that the magnetic property of LaMnO3+δ is also strongly influenced by the δ value, namely at δ = 0, LaMnO3 shows exclusively antiferromagnetic interaction while a ferromagnetic interaction is favored for 0 ≤ δ ≤ 0.1.Reference Ritter, Ibarra, De Teresa, Algarabel, Marquina, Blasco, García, Oseroff and Cheong21 This transformation is accompanied with the reduction of Jahn–Teller distortion of the MnO6 octahedra. The increasing ferromagnetic interaction has been attributed to the increasing cation vacancies and double exchange between Mn3+–O–Mn4+ of LaMnO3+δ compositions. As explained earlier, the LNMO-N sample shows segregated La2NiO4 and NiO phases along with a monoclinic LNMO phase. Thus, the LNMO phase in this composition has a Mn excess stoichiometry. A comparison of the magnetic properties of the LNMO-O sample to those of LaNi1–xMnxO3 compositions further confirms the Ni deficiency in this sample.Reference Dass, Yan and Goodenogh16, Reference Blasco, Sanchez, Peraj-Cacho, Garacia, Subias and Campo18 Blasco et al.Reference Blasco, Sanchez, Peraj-Cacho, Garacia, Subias and Campo18 have reported a ferromagnetic transition temperature 152 to 156 K for LaNi0.25Mn0.75O3-type orthorhombic composition. Dass et al.Reference Dass, Yan and Goodenogh16 have reported a frustrated ferromagnetic state in the cation-disordered LNMO sample quenched from 1400 °C. Furthermore, the authors have mentioned that similar cation disordering and magnetic properties are retained even after long annealing at a lower temperature.Reference Dass, Yan and Goodenogh16 Thus, one can conclude that the ordering of the Ni and Mn strongly depend on preparation and thermal history of the sample. In this study the sample prepared at 1473 K shows cation ordered monoclinic lattice, which is retained under all the annealing conditions. The electrochemical measurements show that the Ni2+–Mn4+ is favored by 0.8 eV over the Ni3+–Mn3+ combination in LNMO.Reference Paulsen, Thomas and Dahn32 Thus, the magnetic properties of the LNMO-O and LNMO-A samples are mainly controlled by the fraction of Ni2+–Mn4+ pair and oxygen stoichiometry.
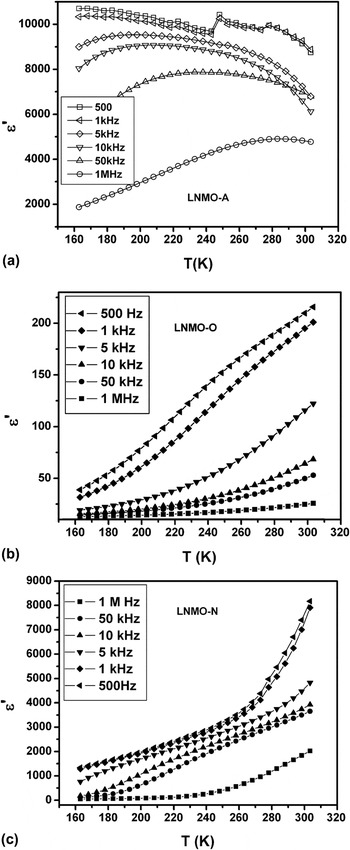
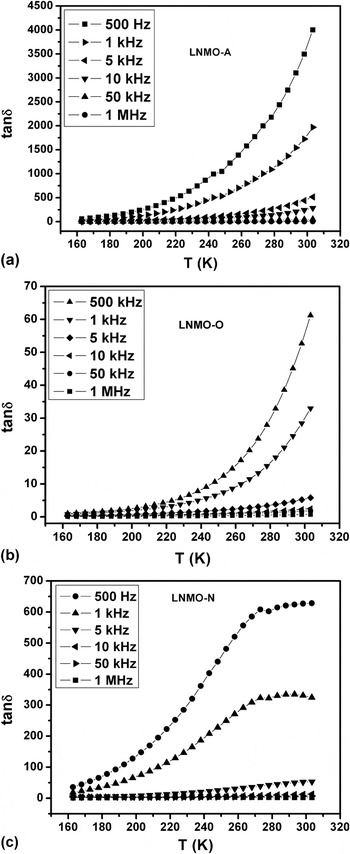
The complex relative permittivities [ε*(ω) = ε′(ω) + i ε″(ω)] in the range of 160–300 K are extracted from the measured impedance data. The variations of a real part of relative permittivity with temperature for the LNMO samples are shown in Fig. 10; higher relative permittivity (~104 at 500 Hz) is observed in the LNMO-A sample compared to others. A relaxor-like behavior with a broad peak in the plot of permittivity with temperature is observed in the LNMO-A sample [Fig. 10(a)]. The broad maximum (~275 K) of the permittivity of the LNMO-A sample is observed around the ferromagnetic transition temperature, which progressively shifts toward lower temperature with decreasing frequency. This observation is similar to that reported earlier by Lin et al.Reference Lin, Chen and Liu28 The observed relative permittivity at 10 kHz of the air annealed sample was about two order higher than the oxygen-treated sample and about one order higher than the value reported earlier by Rogado et al. (relative permittivity = 600).Reference Rogado, Li, Sleight and Subramanian15 However, the LNMO-O sample shows a normal dielectric behavior as permittivity increases monotonically with the increase in temperature [Fig. 10(b)]. The temperature variations of the dielectric loss factor of the LNMO samples at various frequencies are shown in Fig. 11. A significantly higher loss factor is observed in the LNMO-A sample compared to LNMO-O. The temperature dependent relative permittivity of the LNMO-N sample shows quite different behavior compared to the LNMO-A and LNMO-O samples (Fig. 10). It is observed that at lower frequency the relative permittivity shows a sharp increase with temperature while an anomalous broad feature is observed around 225–250 K. The relative permittivity at 500 Hz rises to about 8000 around ambient temperature. The loss factor of the LNMO-N sample is also significantly higher compared to that of the LNMO-O sample. The magnitude of the relative permittivity of the LNMO-N and LNMO-A samples are comparable except for a clear relaxor-like behavior with a large relative permittivity in wider temperature of the LNMO-A sample.
Variation of real part of relative permittivity of (a) LNMO-A, (b) LNMO-O, and (c) LNMO-N with temperature.

Variation of loss factor (tanδ) of (a) LNMO-A, (b) LNMO-O, and (c) LNMO-N with temperature.

The relaxor-like behavior with high permittivity in the LNMO-A sample can originate from (i) interfacial polarization due to two coexisting phases in the sample, (ii) oxygen-ion vacancies in the lattice, and (iii) dynamic fluctuation of oxidation states of transition metal ions.Reference Lin, Chen and Liu28–Reference Ikeda, Ohsumi, Ohwada, Ishii, Inami, Kakurai, Murakami, Yoshii, Mori, Horibe and Kito30, Reference Cao and Randall33, Reference West, Sinclair and Hirose34 The variation of peak maxima can thus arise from the activation of charge carrier, due to dynamic fluctuation of charge on the Ni and Mn sites or oxygen-ion vacancies. The existence of Ni2+, Ni3+ and Mn4+, and Mn3+ in the LNMO sample has been suggested earlier.Reference Blasco, Sanchez, Peraj-Cacho, Garacia, Subias and Campo18, Reference Blasco, Garacia, Sanchez, Campo, Subias and Perz-Cacho19, Reference Asai, Sekizawa and Iida23, Reference Bull, Gleeson and Knight24 In this study, we have also observed similar coexistence of these valence states in the x-ray photoelectron spectroscopy (XPS) data of the LNMO-A sample. In addition, the presence of oxygen-ion vacancies may also lead to high permittivity and high loss behavior. Significantly higher loss character is observed in LNMO-A in LNMO-N samples compared to the LNMO-O sample (shown in Fig. 11). Comparison of the relaxor behavior of the LNMO-A sample with the charge-ordered electronic ferroelectric systems, like RFe2O4, RFeMO4 (M = Co, Cu), and RGaCu2O4 (R = Yb and Lu) type materials suggests that the electronic exchange in the charge-ordered state may be the origin of the dielectric anomaly.Reference Yoshii, Ikeda, Matsuo, Horibe and Mori29, Reference Ikeda, Ohsumi, Ohwada, Ishii, Inami, Kakurai, Murakami, Yoshii, Mori, Horibe and Kito30 However, the more charge-ordered state in the LNMO-O sample as reflected from the magnetic properties show relatively lower relative permittivity compared to LNMO-A. The lower permittivity of the LNMO-O sample supports the annihilation of significant oxygen-ion vacancies. In addition, the presence of oxygen-ion vacancies may also lead to high permittivity and high loss behavior, which is observed in the LNMO-A sample. Thus, the relaxor behavior of the LNMO-A sample may not be solely from the multivalent characters of both coexisting phases, but most dominatingly from the oxygen-ion vacancies. The multiphasic sample of LNMO-N and associated defects give rise to higher permittivity with a distinct feature in temperature variation and higher loss behavior. Earlier, the normal dielectric behavior of the mononclinically ordered R2NiMnO6 was reported by Booth et al.Reference Booth, Fillman, Whitaker, Abanti Nag, Tiwari, Ramanujachary, Gopalakrishnan and Lofland17 The more charge-ordered state in the LNMO-O sample might be responsible for the magnetic properties instead of the dielectric properties. The lower permittivity indicates the annihilation of significant concentration of oxygen-ion vacancies in the LNMO-O sample.
IV. CONCLUSION
In conclusion, we present a peculiar observation on the relaxor and ferromagnetic properties of La2NiMnO6. Structural parameters, magnetic properties of La2NiMnO6 are sensitive to the preparation condition and postannealing conditions. The dielectric behavior of La2NiMnO6 samples are related to the existence of multivalance states leading to a dynamic fluctuation of carriers, oxygen-ion vacancies, and interfacial polarization. The different behavior of dielectric and magnetic properties in the samples studied indicate a different mechanism of multiferroelectricity than the normal electronic ferroelectric systems. It is further concluded that the oxygen vacancies are the origin of high permittivity and relaxor-like behavior of La2NiMnO6.
ACKNOWLEDGMENT
We thank Dr. D. Das, Head, Chemistry Division, Bhabha Atomic Research Centre (BARC) for his support to this work.