Mao was right that I was re-educated, but not re-educated in the direction he wanted. Probably, I was re-educated in the direction he tried to prohibit from happening.
I changed from someone who blindly followed Mao's ideas to a person who is, probably, independent-thinking, with independent ideas. This is clearly not what he wanted.
Tianjian Shi (2005)Footnote 1In a recently published article, we explored hypothesized impacts of age and generational group on political attitudes and participation in contemporary China.Footnote 2 Arguing that attitudes and participation could be affected by the different socialization experiences of youth growing up during five distinct periods – the Republican era, consolidation period, Cultural Revolution, social reform era, and now the “one-child” period – we found that the most consistent pattern is one of the “one-child generation” being markedly different from its predecessors, and not just owing to age differences.
As interesting, though, was the finding that those who grew up during the Cultural Revolution period (1966–1976) were not markedly different from the other generations (except the “one-child” group), and were especially similar in most respects to the older generations. As noted in Hung et al., the Cultural Revolution cohort has “often been characterized as the ‘lost’ generation, given the harsh, bitter, violent struggles they endured during their formative years, which did not prepare them for the changing world.”Footnote 3 During this period, increased communist attacks on Westernism and Confucianism were joined with radical social experiments involving the re-location and “re-education” of nearly 17 million youth. The life circumstances and psychological impacts wrought by such projects have been well-captured in the terms “political chaos,” “civil disorder,” “extreme poverty,” “‘trauma’ for all perspectives of society,” and yet it was “also an era full of idealism and passion for ‘noble causes’.”Footnote 4 For the sent-down youth and other adolescents of the period, the traumas and impacts were nothing short of life-changing. “They were told to sacrifice their youth, material comforts and family life for the welfare of the country.”Footnote 5 But, in spite of spending their adolescence in those harsh and sometimes violent conditions, the “lost” generation does not seem so distinctive after all, at least when compared to their elders, when it comes to political attitudes and behaviour today.
In our earlier study, we did not distinguish between those of the Cultural Revolution generation who actually experienced being “sent down” and those others who observed that phenomenon but did not actually experience it themselves. In other words, an unstated assumption was that all who were socialized during the social experiments of the period would be affected similarly, whether they were sent down or not. In this study, we investigate the veracity of that assumption.
Theory: Direct verus Indirect Experience
There are certainly good reasons to expect that being separated from family, friends and the urban environment within which one had been raised would play significantly – perhaps even uniquely – in shaping the rest of one's life, including orientations and attitudes towards politics and government. Those who did not personally experience these same life-changing events could hardly be affected in exactly the same ways or to the same degree.
Literature from the field of psychology dealing with direct versus indirect experience with a range of types of events/experiences has generally concluded that direct experience is likely to have significantly greater impact on both accuracy of recall of the eventFootnote 6 and formation of attitudes related to the eventFootnote 7 than is the case for indirect experience. Niesser et al. suggest this may be due not so much to the stress associated with the event or even its “consequentiality,” but rather to the likely “rehearsal” of telling the narrative of the experience over and over again.Footnote 8
In the field of history, direct experience is also assigned special significance. Cohen, for instance, notes that “the experienced past is deeply grounded in the senses.”Footnote 9 He continues by saying that:
Closely related to this sensory aspect of the lived past is the fact that experience encompasses the entire range of human emotions, and the closer our contact with real experience the more people's emotional lives – the things that make them sad or angry or nervous or bored, their worries, hatreds, hopes, fears – become foregrounded. We become aware not just of the canal that was built but also of the pain in the backs of men who built it – such awareness being immeasurably facilitated if we ourselves have experienced a comparable pain.Footnote 10
Combining these lines of thought, it is reasonable to conclude that longer-term attitudes and behaviour are more likely to be affected by direct experience than by simply observing an event, for two reasons: (1) the heightened emotive aspects of directly participating in the event, and (2) the reinforcement from ongoing “rehearsal” of the experience both in interactions with other participants and even in the telling and retelling of the experience to others who were not themselves participants.
The “event” in the case of the sent-down experience in China was – for the average participant – certainly more long term than the shorter-term duration of an earthquake,Footnote 11 a classroom experimentFootnote 12 or even an environmental immersion programme,Footnote 13 and usually spanned multiple years (for some as many as eight years, but probably averaging five to six).Footnote 14 Given that a youth was literally plucked from his/her family and urban environment and transplanted to a rural peasant village or mountainous region, never knowing whether the new setting would be temporary or permanent, it is certainly reasonable to assume that the impact on the participant's life would run deeply and broadly and would be sustained throughout the rest of his or her life. While those fellow youth who witnessed the departures of friends and/or siblings and who would hear the first-hand accounts of the experiences of others – but who were not sent down themselves – may have been impacted as well, it is also reasonable to posit that such impact would have been less traumatic and of less duration than for those who were more than mere observers.
The whole “send-down” experiment was premised on the notion that urban youth could be re-educated by being transplanted into rural, peasant society for a substantial period of time. The re-education would presumably enhance the understanding of the need to develop a classless society,Footnote 15 and more generally result in acceptance of communist ideology and the communist regime. To the extent that those expectations were met in practice, we could well find that the formerly sent-down youth, as compared to their peers who were not sent down, have developed attitudes that are even more consistent with that ideology and even more supportive of that regime.
It is those expectations (or “hypotheses”) that we address in the first set of analyses below.
Data
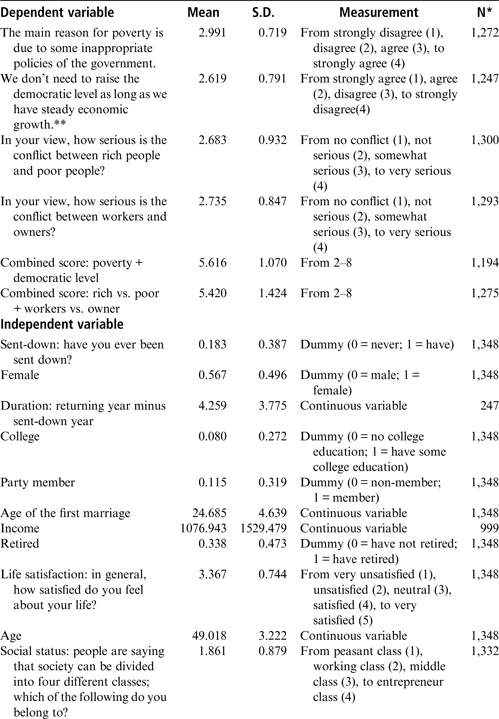
For our previous comparison of the Cultural Revolution generation with other generations of citizens living in China at the time, we used data from the China Survey of 2008, which included a rich array of items on political attitudes as well as the demographic data needed for identifying the various generations. Unfortunately for our purposes in the remainder of this paper, that survey did not ask respondents whether they had ever been sent down. So, for the following analyses, we rely upon data from the 2006 General Social Survey of China (GSSC).Footnote 16 This survey included not only a sufficient number of items on political attitudes which could be seen as related to the intended consequences of the rustication programme, but also the critical item asking respondents, “did you ever experience being sent down?” Most relevant for our analyses are items asking for respondents’ attitudes on the seriousness of class conflict (on two dimensions: rich versus poor, and workers versus owners) and towards the regime (one item on “blaming” government for poverty and the other on acceptance of the current level of “democracy”Footnote 17). (See Table 1 for exact wording and descriptive statistics for these four items.)
Wording of Questionnaire Items and Descriptive Statistics

Source:
General Social Survey of China 2006.
Notes:
*N is for Cultural Revolution generation only (N = 1,348); **see fn. 17 concerning the meaning of “democratic.”
The GSSC of 2006 was a nationwide survey of Chinese citizens. Because the send-down programme of the Cultural Revolution was focused on urban youth, with most of the sent-down youth eventually returning to urban areas, and because the send-down question was only put to urban respondents, we analyse only the data for the urban subsample of 6,013 respondents.Footnote 18
Cultural Revolution Generation: Sent-down versus Not-sent-down
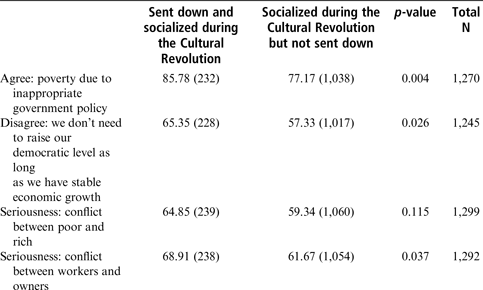
Using data from the urban subsample, we find – as anticipated – that those who had been sent down are substantially more likely to buy into the “class struggle” dimension of communist ideology than those who were not sent down. This is reflected in Table 2, in the items dealing with the perceived seriousness of class conflict between workers and owners (p < .05) and between poor and rich (with the direction as expected, although insignificantly so with p = .115).Footnote 19 To this extent, Mao's experiment may have succeeded, at least in convincing its subjects of the extent to which class struggle was a reality.Footnote 20
Comparison between “Sent-downs” and “Non-sent-downs” (Urban Sample
Source:
General Social Survey of China 2006.
Notes:
Numbers in parentheses are the number of observations in each respective cohort.
However, our findings pertaining to “loyalty to the regime” are markedly inconsistent with Mao's intentions. Rather than being more supportive of the status quo regime, the formerly sent-down youth – as compared to their non-sent-down peers – are today more likely to agree that “the main reason for poverty is due to inappropriate government policy” (p < .01) and less likely to agree that “we don't need to raise our democratic level as long as we have stable economic growth” (p < .05). In other words, the sent-down portion of the Cultural Revolution generation can actually be seen as less blindly and completely loyal to the communist regime than their non-sent-down peers.
But, might these differences be owing less to the sent-down experience itself than to systematic differences in background of those who were sent down versus those who were not? Zhou and Hou investigated a number of possible differences in the backgrounds of these two groups, and concluded that only the education level of the father was significantly related to the likelihood of being sent down.Footnote 21 Of our sample of 1,348 from the Cultural Revolution generation (of whom 247 were sent down), three fathers of sent-down youth had a college education, compared to four fathers of non-sent-downs.Footnote 22 As would be expected, removing those seven individuals from the sample makes no significant difference in our findings.
Overall, then, the findings above attest to the influence of the sent-down experience, as separable from socialization during the Cultural Revolution, which was shared by both peer groups.Footnote 23
Even if the consequences of the “Cultural Revolution experience,” per se, varied between sent-downs and not-sent-downs, it should not be assumed that the sent-down experience itself was invariable. Indeed, recent literature has suggested that different durations of that experience had long-term life consequences, and that men and women were affected differently.Footnote 24 Our purpose in the following sections is to determine whether differential consequences, along both duration and gender lines, apply to political attitudes as well.
Duration of Sent-down Experience
Zhou and Hou, using data on “a representative sample of urban residents drawn from a multi-stage scheme in 20 cities in China in 1993 and 1994,”Footnote 25 conclude that “the longer a respondent stayed in the rural area, the more severe its impact on the life course.”Footnote 26 Using General Social Survey data for 2003, Qian and Hodson find that the sent-down experience was particularly “traumatic” and disruptive of “life course developments and process of socioeconomic attainment” for “those who stayed in the countryside for an extended period of time.”Footnote 27 Among the differences, those with shorter periods of being sent down “had more personal income than late returnees” and “were happier about their life!”Footnote 28
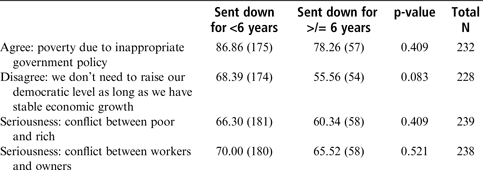
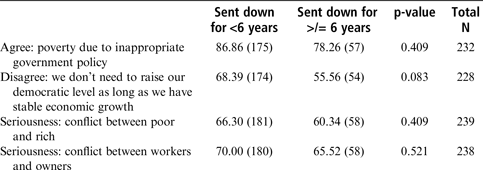
But, whether those different life experiences and attitudes about life in general would translate into – or at least be joined by – different political attitudes remains, until now, an open question. There may be reasons to anticipate such consequences. One might think, for instance, that since longer duration has resulted in greater negative life consequences, greater resentment and thus greater willingness to criticize the government would follow. Alternatively, though, one might think that the longer the sent-down experience, the more one could be socialized into the rural, relatively passive political culture, with the result of lessened willingness to criticize government or express positive attitudes towards a regime alternative. Our evidence from the 2006 GSSC data (see Table 3), while more consistent with the second of those arguments, does not include a significant relationship at the .05 level between duration and either willingness to blame the government for poverty or positive attitudes towards democratic reform, although the latter would be significant at the .10 level.Footnote 29 That is, those who returned after a longer period experiencing peasant life (i.e. more than five years for Table 3) are slightly less likely today to blame government for poverty and to prefer raising the “democratic level,” but not significantly so.
Comparison by Duration of Sent-down Experience (Urban Sample; Sent-downs Only)
Source:
General Social Survey of China 2006.
Notes:
Numbers in parentheses are the number of observations in each respective cohort.
Similarly, there could be two alternative, and again, contradictory, expectations relating the length of sent-down experience to perception of strong class conflict. One might think that the longer the sent-down experience, the longer the person had to build up resentment of their rural peasant life, as contrasted with recollections of what life had been like in the city, and thus to accept the class-conflict basis of communist ideology. Alternatively, one might argue that the longer the sent-down experience, the more time there was to be fully socialized into and accept the peasant lifestyle, while for those whose time in the countryside was too short for that socialization process, the contrast between their brief experience as a peasant and the return to urban life would be even more stark and thus result in a stronger perception of class conflict. Once again, while our evidence (shown in Table 3) tends in the direction of supporting the second argument, neither of the relationships between duration and perceptions of class conflict are significant, even at the .10 level.Footnote 30
Our overall conclusion, then, must be that duration of the sent-down experience in one's youth does not significantly impact political attitudes three decades later.
Men versus Women
Although young sent-down men may well have experienced unwelcome shocks to their educational and career aspirations, women suffered even broader and deeper consequences that had the potential to affect virtually all aspects of their future lives, including social, economic, and perhaps even political. The young, educated, urban women who were sent down to the countryside, and then were forced to experience life as a traditional peasant woman, were likely to have the most shocking, discomforting, humiliating experience of all. This is, at least partly, because Mao's programme of equalization for women and men was already beginning to bear fruit in the urban areas but not in the rural areas, where women (and men) were still expected to play traditional roles.Footnote 31 As Honig notes: “Many sent-down youth had to confront not only the unexpected reality of women's subordination, but their first experiences of gender inequality as well.”Footnote 32 Adding to the humiliation was the fact that many young sent-down females were seen as ill-equipped for hard work in the fields, and thus were assessed more as burdens than as helpers, and were treated accordingly.Footnote 33 Following this line of argument, it would not be surprising to find that women's attitudes would change even more so than those of men as a result of the sent-down experience during the Cultural Revolution.
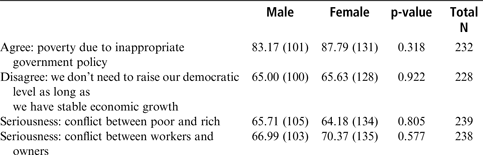
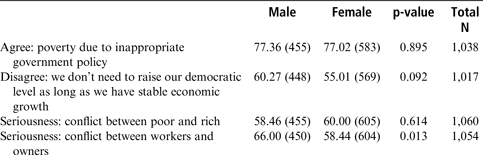
To address these expectations, we have broken the Cultural Revolution cohort into four groups: sent-down men, sent-down women, not-sent-down men and not-sent-down women. Comparing first across genders, we find no significant differences between sent-down men and women (see Table 4), although there are inter-gender differences within the not-sent-down group (see Table 5). Not-sent-down women were more likely than their male counterparts to agree that the democracy level does not need to be raised (p < .10) and were less likely than the men to see substantial conflict between workers and owners (p < .05).
Comparison between Male and Female Sent-downs (Urban Sample)
Source:
General Social Survey of China 2006.
Notes:
Numbers in parentheses are the number of observations in each respective cohort.
Comparison between Male and Female Non-sent-downs (Urban Sample)
Source:
General Social Survey of China 2006.
Notes:
Numbers in parentheses are the number of observations in each respective cohort.
Comparing within gender sent-down versus not-sent-down, we find no significant attitudinal differences between the two groups of men, but significant differences between the two groups of women (see Table 6). The sent-down women were significantly more likely than their not-sent-down counterparts to blame poverty on government policy (p < .01), to disagree that the democratic level does not need to be raised as long as economic growth remains stable (p < .05), and to perceive substantial conflict between workers and owners (p = .01).
Comparison between Sent-downs and Non-sent-downs by Gender (Urban Sample)
Source:
General Social Survey of China 2006.
Notes:
Numbers in parentheses are the number of observations in each respective cohort.
Drawing the findings together, it seems reasonable to speculate that the differences that exist between sent-down and not-sent-down groups overall – with sent-downs more likely to perceive class conflict but less “blindly loyal” to the regime – are owing primarily to changes that occurred in the women's attitudes (but not the men's) because of their sent-down experiences. We have now found, after all, that sent-down and not-sent-down men do not differ on the items being analysed, while the two groups of women do differ, with the sent-down women being more willing to criticize the government, to see merit in democratization and more likely to see the class struggle as being relevant today. We also find that women and men in the not-sent-down group did differ significantly on two of the items. We find it plausible that it is the change in attitudes among sent-down women as a result of that experience that resulted, ultimately, in women having essentially the same attitudes as men among the group with the sent-down experience.
We recognize the limitations of developing what is in effect a longitudinal argument to explain what we are seeing in cross-sectional data. Nonetheless, we find the argument to be compelling, logical and certainly consistent with the empirical findings.
The “Experience” versus Later Consequences
Thus far, we have found evidence to support a conclusion of long-term attitudinal consequences of having been sent down, at least for some of the former sent-down youth, but we have not yet addressed whether those consequences are owing to the experience itself or rather attributable to other, social/economic impacts of the experience. If the formerly sent-down youth suffered negative life course consequences as a result of the forced experience in the countryside, it is possible that it is those life consequences, rather than psychological trauma associated with the sent-down experience itself, that are responsible for any differences in political attitudes found to exist today.
Qian and Hodson have noted that, while in the countryside for as many as ten years, the sent-down youths’ “lives and careers were significantly delayed or disrupted, including delayed marriage, disrupted education, and lost job experience.”Footnote 34 Qian and Hodson found from a 2003 survey that those who had been sent down were not significantly less well-off financially, but they were more likely to have faced forced early retirements than was true for others of their generation.Footnote 35
This burden represents the convergence of lasting ripple effects of the send-down experience: the years spent in rural areas did not contribute to accumulated job skills or enterprise specific seniority setting up the send-down generation for heightened risk of layoffs during the downsizing and privatization periods starting in the 1990s and beyond. These findings are consistent with those of Zhao and Zhou (Reference Zhou2004) who found that the generation of the Cultural Revolution had lower promotion rates than adjacent cohorts. In aggregate, these negative outcomes for both men and women reinforce the image of the sent-down youth as “the unlucky generation” that faced privation both in their youth and again at the end of their careers.Footnote 36
Qian and Hodson sum up the reality for many of the formerly sent-down youth: “They had to work harder, get more education, start their families later, and face early retirement.”Footnote 37
With regard to gender differences, Qian and Hodson report that “young women during the Cultural Revolution indeed held up more than half of the sky – women were more likely to be sent down in the first place and less likely to return home within 5 years.” Hence, women of the “unlucky generation” are even more likely than men to have experienced the dual privation.Footnote 38
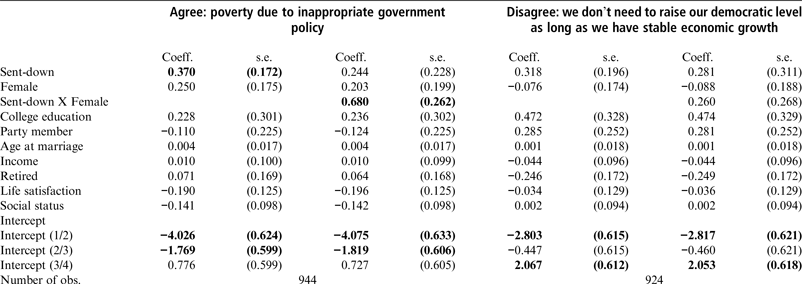
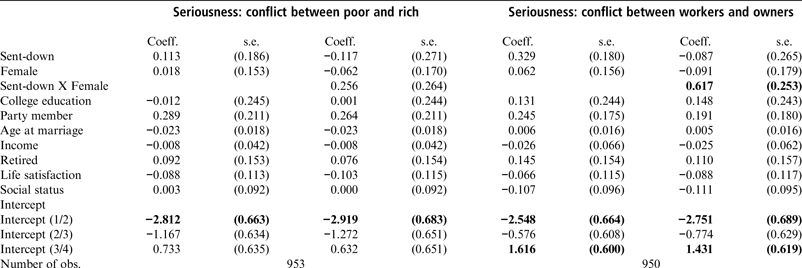
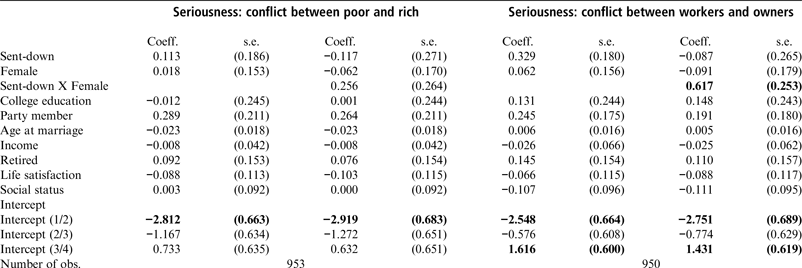
Given the later social and economic consequences of their sent-down experience, it is certainly reasonable to think that atypical disillusionment with the status quo regime and continued perceptions of class struggle might stem at least as much – if not more, perhaps even exclusively – from these later life consequences of the sent-down experience than from lingering unhappiness over the experience itself. After all, extant literature on China has reported a significant relationship between material life satisfaction and support for the current regime.Footnote 39 To assess whether the sent-down experience itself has a significant impact on attitudes today pertaining to the regime and to ongoing class struggle, net influence of subsequent social and economic consequences, we have conducted multivariate analyses which include as independent variables not only whether the subject had been sent down and the respondent's gender, but also indicators of post-sent-down life course: current income, age at first marriage, whether college-educated, whether retired (as of 2006),Footnote 40 perceived social status, and reported life satisfaction. Party membership is also controlled because CCP membership could be important in shaping respondents’ attitudes towards government, democracy and social class. The results of these analyses are reported in Tables 7 and 8.
Regression Estimates for Political Attitudes
Source:
General Social Survey of China 2006.
Notes:
Variables that are significant at the .05 level are highlighted in bold. The models (DV = poverty and democratic level) are estimated by the ordered logistic regression with survey weights because these dependent variables are ordinal with four-point scale.
Regression Estimates for Perceived Class Conflict
Source:
General Social Survey of China 2006.
Note:
Variables that are significant at the .05 level are highlighted in bold. The models (DV = rich vs. poor, and workers vs. owners) are estimated by the ordered logistic regression with survey weights because these dependent variables are ordinal with four-point scale.
In the most important respects, the findings of these multivariate analyses are consistent with findings from cross-tabulation analyses as reported above. None of the control variables is significant in any of the models. Having been sent down is by itself significant in the first model for “poverty due to inappropriate government policy.” But, the most significant impacts are owing to the interaction of having been sent down and being female for both the latter dependent variable and the perception of serious conflict between workers and owners. These findings from multivariate analysis suggest that the sent-down experience itself has affected the attitudes of formerly sent-down youth, and especially formerly sent-down females, even when controlling for other economic and social consequences of that experience.Footnote 41
Conclusion
If the “send-down” programme resulted in the re-education that was first envisioned and intended by Mao's regime, and if those consequences had a lasting effect, then it might well be expected that the formerly sent-down youth – as compared to their peers who were not sent down – would today have attitudes even more consistent with that regime's class-based ideology and be even more supportive of the regime itself. Our findings here are consistent with the expectation that those who were sent down are more likely to buy into the “class struggle” dimension of communist ideology,Footnote 42 but not with the expectation that they would be more loyal to the current communist regime.Footnote 43 Indeed, those who were sent down during the Cultural Revolution are actually less blindly and completely loyal to the status quo, communist regime than their non-sent-down peers. From the standpoint of psychological theory positing differential impacts of direct experience versus indirect knowledge, our findings of different political attitudes many years after the sent-down event are largely consistent with that theory.
Not content to assume that all sent-down experiences are alike, and hence that all consequences would be the same, we further explored possible attitudinal distinctions caused by different durations of sent-down experiences and the different experiences of sent-down men versus women. Although the different lengths of stay in the countryside did not result in significantly different attitudes, we do find evidence to support the argument that the attitudinal impact of the sent-down experience was greater for women than for men. While significant differences exist between men and women who were not sent down, there are no such gender differences among those who were sent down. We find it plausible to speculate that the sent-down women's attitudes became more like their male counterparts – i.e. more willing to criticize the government, to see merit in a higher “democratic level,” and to see the class struggle as relevant today – as a consequence of their particularly shocking and discomforting sent-down experience.
The end result is a group of formerly sent-down youth – and particularly sent-down women – which, as compared to not-sent-down peers, is today more willing to accept the class-struggle foundation of Mao's communist ideology but which, at the same time, is more willing to assess the performance and structure of the communist regime critically. Furthermore, results of multivariate analysis suggest that, even when controlling for other social and economic consequences of having been sent down, the sent-down experience itself significantly impacted these attitudinal differences.