Implications
It is important to assess the effect on growth traits when selecting by ovulation rate and litter size since growth is one of the main objectives in rabbit selection programs. The increase of litter size at weaning and at slaughter time after two-stage selection by ovulation rate and litter size does not reduce weaning and commercial weight. The selection does not also modify growth traits variability. Therefore, two-stage selection by ovulation rate and litter size could be used as a selection criterion in maternal rabbit lines since no negative consequences on growth traits were observed.
Introduction
Growth rate (GR) and litter size (LS) are the most common selection criteria for commercial lines. Two-stage selection by ovulation rate (OR) and LS has been proposed as a way to improve more efficiently LS at birth, weaning and slaughter than direct selection for LS at weaning in rabbits (Badawy et al., Reference Badawy, Peiró, Blasco and Santacreu2019). However, the consequences of this kind of selection on growth traits (weaning weight (WW), slaughter weight (SW) and GR) and their variability (DWW, DSW and DGR, respectively) in rabbits are unknown. It is known that increasing the number of total kits born can reduce the weight at birth and increases the intralitter weight variability, reducing the probability of postnatal survival in rabbits (Argente et al., Reference Argente, Santacreu, Climent and Blasco1999) and pigs (Damgaard et al., Reference Damgaard, Rydhmer, Løvendahl and Grandinson2003; Wolf et al., Reference Wolf, Záková and Groeneveld2008; Zhang et al., Reference Zhang, Wang, Shi, Yan, Zhang, Liu, Pu, Liang, Zhang, Zhao and Wang2016). Genetic correlations between LS and growth traits in rabbits are generally low, showing a high standard error (see review by Mocé and Santacreu, Reference Mocé and Santacreu2010). These low genetic estimations are in agreement with the low or null correlated responses on growth traits obtained in maternal lines selected by LS (Mínguez et al., Reference Mínguez, Sánchez, el Nagar, Ragab and Baselga2016).
There is no information about genetic correlation between OR and growth traits in rabbits, whereas low positive or null genetic correlations of OR with birth weight (Hsu and Johnson, Reference Hsu and Johnson2014), OR with WW (Ruíz-Flores and Johnson, Reference Ruíz-Flores and Johnson2001; Rosendo et al., Reference Rosendo, Canario, Druet, Gogue and Bidanel2007), OR with weight at 125 and 178 days (Ruíz-Flores and Johnson, Reference Ruíz-Flores and Johnson2001) and OR with GR (Bidanel et al., Reference Bidanel, Gruand and Legault1996; Rosendo et al., Reference Rosendo, Canario, Druet, Gogue and Bidanel2007) were found in pigs. Under our knowledge, genetic parameters of weight variability at weaning and at slaughter and their relationship with LS or OR were never studied in rabbit.
Growth traits are economically important traits in commercial rabbit selection programs. The increase of LS by selection could modify growth traits and their variability. The aim of this study is to estimate the correlated responses on WW, SW and GR and their variability from a two-stage selection experiment for OR and LS in rabbits.
Materials and methods
Animals and experimental design
Animals involved in this experiment came from a synthetic line (line OR_LS), which underwent 17 generations of selection. From base generation to generation 6 (first selection period), females were selected only for the OR. From generation 7 to 17 (second selection period), a two-stage selection for OR and LS was performed. The average number of females and males per generation was 74 and 17, respectively. Details about breeding and feeding management were described by Badawy et al. (Reference Badawy, Peiró, Blasco and Santacreu2019).
Traits
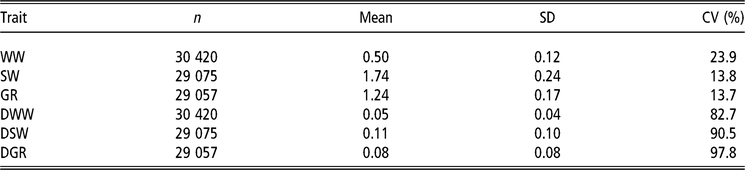
Weaning weight (kg) and SW (kg) of each young rabbit were measured individually at 28 and 63 days of age, respectively. Growth rate (kg) was estimated as the difference between SW and WW. The variability of WW, SW and GR was calculated as the absolute value of the difference between the individual value and the mean value of their litter (DWW, DSW and DGR in kg, respectively). Litter size was measured as the total number of kits born per litter up to five parities. The ovulation rate, estimated as the number of corpora lutea, was measured at second and last gestation. More details about reproductive traits have been given by Badawy et al. (Reference Badawy, Peiró, Blasco and Santacreu2019). The number of records for WW, SW and GR was 30 420, 29 075 and 29 057, respectively. The same number of data was also used to estimate the growth traits variability (Table 1). These data came from 1 317 dams with 4 027 litters. Data from 1 210 ORs and 4 480 parities were analyzed. The number of animals in the pedigree was 30 666.
Descriptive statistics for WW (kg), SW (kg), GR (kg) and their variability (DWW, DSW and DGR) in the OR_LS line 1

n=Number of records; SD=standard deviation; CV=coefficient of variation; WW=weaning weight; SW=slaughter weight; GR=growth rate; DWW=weaning weight variability; DSW=slaughter weight variability; DGR=growth rate variability.
1 OR_LS line is a rabbit line selected for the ovulation rate at second gestation from generation 0 to 6 and later for the ovulation rate at second gestation and litter size of the first two parities from generation 7 to 17.
Statistical analysis
Bayesian inference methods were used to analyze data from all generations of selection. Trivariate animal models were fitted to estimate genetic parameters and responses. Each trivariate analysis included the selected traits (LS and OR) and one of the growth traits (WW, SW, GR, DWW, DSW and DGR). The repeatability animal model used for analyzing OR and LS was described by Badawy et al. (Reference Badawy, Peiró, Blasco and Santacreu2019).
The model used for analyzing WW, SW, GR, DWW, DSW and DGR was
 $${y_{ijkl}} = b\,{NBA_{ijk}}+{YS_{i}} + {PO_{j}} + {m_{k}} + {c_{ijk}} + {a_{ijkl}} + {e_{ijkl}}$$
in which yijkl is the record of the trait of animal l; NBAijk is the number of kits born alive in which the animal l was born and b is the regression coefficient on NBA; YSi is the effect of year season (3 months per each year season; 46 levels); POj is the effect of the parity order in which the animal was born (four levels: 1st, 2nd, 3rd and >3rd); mk is the environmental maternal random effect of the overall parities of the dam of the animal l; cijk is the random effect of the common litter in which the animal l was born; aijkl is the random additive value of animal l and eijkl is the residual effect.
A common litter effect ratio (c 2) was defined as the ratio between the variance of common litter effects and the phenotypic variance, and a maternal effect ratio (m 2) was defined as the ratio between the variance of permanent environmental effects and the phenotypic variance. The joint prior distribution assumed for additive genetic effects was N(0,A⊗Ga ), where Ga was the genetic (co)variance matrix between the traits and A was the additive genetic relationship matrix. Environmental maternal effects (mk ) of growth traits and permanent environmental effect of the doe (pk ) on LS and OR are correlated. The joint prior distribution for the permanent environmental effect of the doe (pk ) and the maternal effect on growth trait (mk ) was N(0,I⊗Gp ), where Gp was the (co)variance matrix between these effects. There is a correlation between the residual term of the reproductive trait and the common litter effect (cijk ) of the growth trait (García and Baselga, Reference García and Baselga2002; Mínguez et al., Reference Mínguez, Sánchez, el Nagar, Ragab and Baselga2016); therefore, an environmental covariance structure between growth traits and reproductive traits was established. The prior distribution for the common litter effect (cijk ) of one of the growth traits and the residual term of one of the reproductive traits was N(0,I⊗Gc ), where Gc was the (co)variance matrix between these effects. The residual prior distributions for all traits were N (0,Iσ e 2). The order of the identity matrix Ι was equal to the number of records measured in each case. Bounded uniform priors were used for the components of the (co)variance matrices. The program TM (Legarra et al., Reference Legarra, Varona and López de Maturana2008) was used for Gibbs sampling procedures. Chains of 3 000 000 samples each were used, with a burn-in period of 750 000. One sample in each 100 was saved to avoid high autocorrelation between consecutive samples. Geweke’s Z score was estimated to test the chain convergence.
A heritability higher than 0.10 was considered relevant for growth traits. Selection on growth traits with heritability lower than 0.10 leads to low genetic responses per generation. Similarly to Badawy et al. (Reference Badawy, Peiró, Blasco and Santacreu2019), the relevant value for correlation was 0.3 (in absolute value) considering the low percentage of the explained variance. The features of the marginal posterior distributions shown in Tables 2 and 3 were also described by Badawy et al. (Reference Badawy, Peiró, Blasco and Santacreu2019).
Results and discussion
Means, standard deviations (SD) and coefficients of variation (CV) for growth traits and their variability are shown in Table 1. Values for growth traits were similar to those presented in several maternal lines selected for the number of kits at weaning (García and Baselga, Reference García and Baselga2002; Mínguez et al., Reference Mínguez, Sánchez, el Nagar, Ragab and Baselga2016). For example, Mínguez et al. (Reference Mínguez, Sánchez, el Nagar, Ragab and Baselga2016) obtained mean values of 0.57 ± 0.13 kg and 1.86 ± 0.26 kg for WW and SW, respectively and 36.70 ± 5.70 g/day for average daily gain during the fattening period, after analyzing a large set of data from four maternal lines. Up to now, there is no information about the individual variability of weights at weaning and slaughter in rabbits. The raw values for growth traits variability were low, ranging from 0.05 to 0.11 kg, and the CV were high. Argente et al. (Reference Argente, Santacreu, Climent and Blasco1999) studied the SD of WW within litter obtaining a value close to 0.07 kg.
The effect of the covariate NBA for all growth traits was negative (−0.028 ± 0.002 for WW, −0.041 ± 0.003 for SW and −0.012 ± 0.001 for GR; data not shown) and showed high accuracy. These results were in concordance with the correlated response on growth traits in selected maternal lines found by García and Baselga (Reference García and Baselga2002) and Mínguez et al. (Reference Mínguez, Sánchez, el Nagar, Ragab and Baselga2016). Drummond et al. (Reference Drummond, Vázquez, Sánchez-Colón, Martínez-Gómez and Hudson2000) and Poigner et al. (Reference Poigner, Szendrő, Lévai, Bíró-Németh and Radnai2000) also observed that larger litters had a lower average birth weight and lower GR from birth to weaning than smaller litters. The effect of the covariate NBA for all growth traits variability was positive (0.0008 ± 0.0001 for DWW, 0.0032 ± 0.0001 for DSW and 0.0021 ± 0.0001 for DGR) and also showed high accuracy.
Genetic parameters
Heritabilities
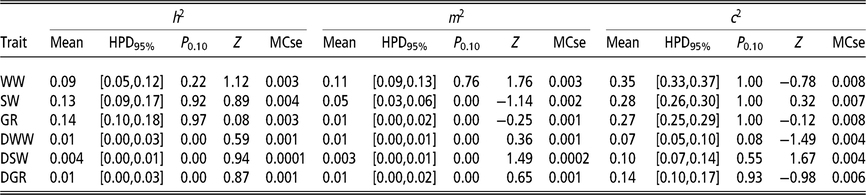
The heritabilities for the selection criteria traits, OR and LS, were 0.25 (HPD95%=0.17 to 0.33) and 0.10 (HPD95%=0.05 to 0.14), respectively (Badawy et al., Reference Badawy, Peiró, Blasco and Santacreu2019). Features of the marginal posterior distributions of the heritability for growth traits and their variability are shown in Table 2. Heritability estimates for growth traits were low. The probability of the heritability being higher than 0.10 was high for SW and GR, whereas the heritability of WW was likely to be lower than 0.10. Low to moderate heritabilities for growth traits, depending on the rabbit populations or the methods of estimation, have been reported (Argente et al., Reference Argente, Santacreu, Climent and Blasco1999; Drouilhet et al., Reference Drouilhet, Gilbert, Balmisse, Ruesche, Tircazes, Larzul and Garreau2013; Mínguez et al., Reference Mínguez, Sánchez, el Nagar, Ragab and Baselga2016). Monte Carlo standard errors for all estimations were small, less than or equal to 0.008, and no lack of convergence was detected by the Geweke test.
Features of marginal posterior distributions of the heritability (h2), proportion of the maternal effect variance with respect to phenotypic variance (m2) and proportion of the common litter effect variance with respect to phenotypic variance (c2) for WW, SW, GR and their variability (DWW, DSW and DGR) in the OR_LS line 1

HPD95%=high posterior density interval at 95%; P 0.10=probability of the proportion being higher than 0.10; Z=Geweke’s Z score; MCse=Monte Carlo standard error; WW=weaning weight; SW=slaughter weight; GR=growth rate; DWW=weaning weight variability; DSW=slaughter weight variability; DGR=growth rate variability.
1 OR_LS line is a rabbit line selected for the ovulation rate at second gestation from generation 0 to 6 and later for the ovulation rate at second gestation and litter size of the first two parities from generation 7 to 17.
Genetic variation for growth traits variability was negligible. In rabbits, no previous estimations of heritabilities for growth traits variability were reported. In pigs, heritabilities for variability of weight at birth and at weaning, measured as intralitter SD, were also low, ranged from 0.05 to 0.08 (Damgaard et al., Reference Damgaard, Rydhmer, Løvendahl and Grandinson2003; Wolf et al., Reference Wolf, Záková and Groeneveld2008; Zhang et al., Reference Zhang, Wang, Shi, Yan, Zhang, Liu, Pu, Liang, Zhang, Zhao and Wang2016). The heritabilities of weight variability were lower than those for weight at birth and at weaning as in our results (from 0.10 to 0.39).
Common litter (c2) and maternal (m2) effect ratio
Features of marginal posterior distributions of common litter and maternal effect ratio for growth traits are shown in Table 2. All estimations showed a high accuracy. The estimated values for the common litter effect ratio were moderate for all growth traits being 0.35 for WW, 0.28 for SW and 0.27 for GR, and with high probability of being higher than 0.10. These results show that a common litter effect ratio decreases over time, as expected. Maternal effect ratio was low for WW and SW and negligible for GR. Similar estimations for common litter effect ratio for WW, SW and GR were obtained in rabbit maternal lines by García and Baselga (Reference García and Baselga2002) and for the common litter and maternal effect ratio by Mínguez et al. (Reference Mínguez, Sánchez, el Nagar, Ragab and Baselga2016). However, higher estimations for the maternal effect ratio (0.18, 0.21 and 0.26, respectively) were reported by García and Baselga (Reference García and Baselga2002). In agreement with our results, relevant litter common ratios were also found in rabbit lines selected by GR and food efficiency traits (Drouilhet et al., Reference Drouilhet, Gilbert, Balmisse, Ruesche, Tircazes, Larzul and Garreau2013). Our results support the important influence of a preweaning environment provided by the female on growth at least until slaughter in rabbits. Regarding variability growth traits, the common litter effect ratio for DWW, DWS and DGR showed values closed to 0.10. However, the maternal effect ratio showed very low values for these traits. No literature values were found for common litter and maternal effect ratios neither in rabbits nor pigs for growth traits variability.
Correlations between reproductive traits and growth traits
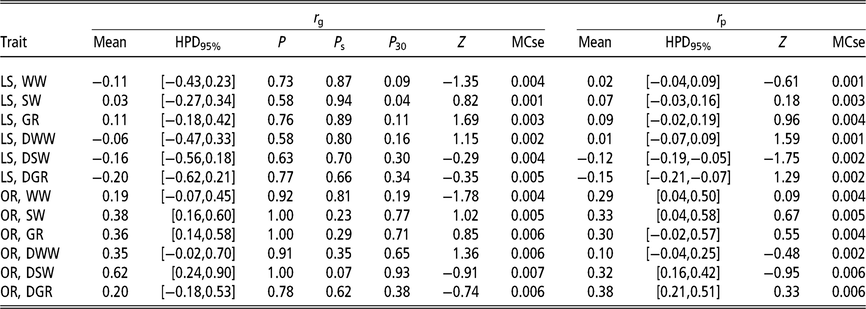
Features of the marginal posterior distributions of the genetic and phenotypic correlation between the studied traits are shown in Table 3. All genetic correlation values were estimated with a high posterior density interval at 95% probability. We considered 0.30 as a relevant value as it represents less than 10% of the variance of one trait explained by the other one. We also considered the probability of similitude, P s, as the probability of a correlation being in absolute value lower than 0.30. No relevant genetic correlations were observed between LS and growth traits and also between LS and growth traits variability, since values were close to zero and P s were high. Likewise, phenotypic correlations were also null between LS and growth traits and also with growth traits variability. There are only few estimates of genetic correlations between LS and growth traits in rabbits with no clear pattern. In addition, most correlations were low with high standard errors (Mocé and Santacreu, Reference Mocé and Santacreu2010; Mínguez et al., Reference Mínguez, Sánchez, el Nagar, Ragab and Baselga2016). In pigs, a broad range of correlation estimates between LS at birth and litter WW were found using different models (Damgaard et al., Reference Damgaard, Rydhmer, Løvendahl and Grandinson2003; Wolf et al., Reference Wolf, Záková and Groeneveld2008; Zhang et al., Reference Zhang, Wang, Shi, Yan, Zhang, Liu, Pu, Liang, Zhang, Zhao and Wang2016), and no clear pattern was found.
Features of marginal posterior distributions of the genetic (rg) and phenotypic (rp) correlation of LS and OR with WW, SW, GR and their variability (DWW, DSW and DGR) in the OR_LS line 1

HPD95%=high posterior density interval at 95%; P=probability of the r g being higher than zero when the mean is positive or lower than zero when it is negative; P s=probability of similitude; probability of the r g being between −0.30 and 0.30; P 30=probability of the r g being higher than 0.30 when r g>0 or lower than −0.30 when r g<0; Z=Geweke’s Z score; MCse=Monte Carlo standard error; LS=litter size; WW=weaning weight; SW=slaughter weight; GR=growth rate; DWW=weaning weight variability; DSW=slaughter weight variability; DGR=growth rate variability; OR=ovulation rate.
1 OR_LS line is a rabbit line selected for the ovulation rate at second gestation from generation 0 to 6 and later for the ovulation rate at second gestation and litter size of the first two parities from generation 7 to 17.
In rabbit line OR_LS, low positive genetic correlation was found between OR and SW and also between OR and GR, both with a probability of relevance (P 30) higher than 0.70. However, the probability of relevance for the correlation between OR and WW was low, 0.19. Low and moderate positive genetic correlations between OR and DWW and between OR and DSW were also found, with a probability of relevance for both correlations of at least 0.65. There are no studies about the genetic relationship between OR and growth traits in rabbits. In pigs, no consistent correlated responses between OR and weight from birth to the end of the fattening period were obtained, being most of them close to zero (Ruíz-Flores and Johnson, Reference Ruíz-Flores and Johnson2001; Rosendo et al., Reference Rosendo, Canario, Druet, Gogue and Bidanel2007; Hsu and Johnson, Reference Hsu and Johnson2014). In agreement with our results, Bidanel et al. (Reference Bidanel, Gruand and Legault1996) reported positive and low genetic correlations between OR and average daily gain (0.20 ± 0.06). Finally, line OR_LS also showed positive genetic correlations between OR and growth traits variability, which are the first estimations in commercial prolific species. Phenotypic correlations between OR and growth traits and between OR and growth traits variability were also positive.
Correlated response to selection
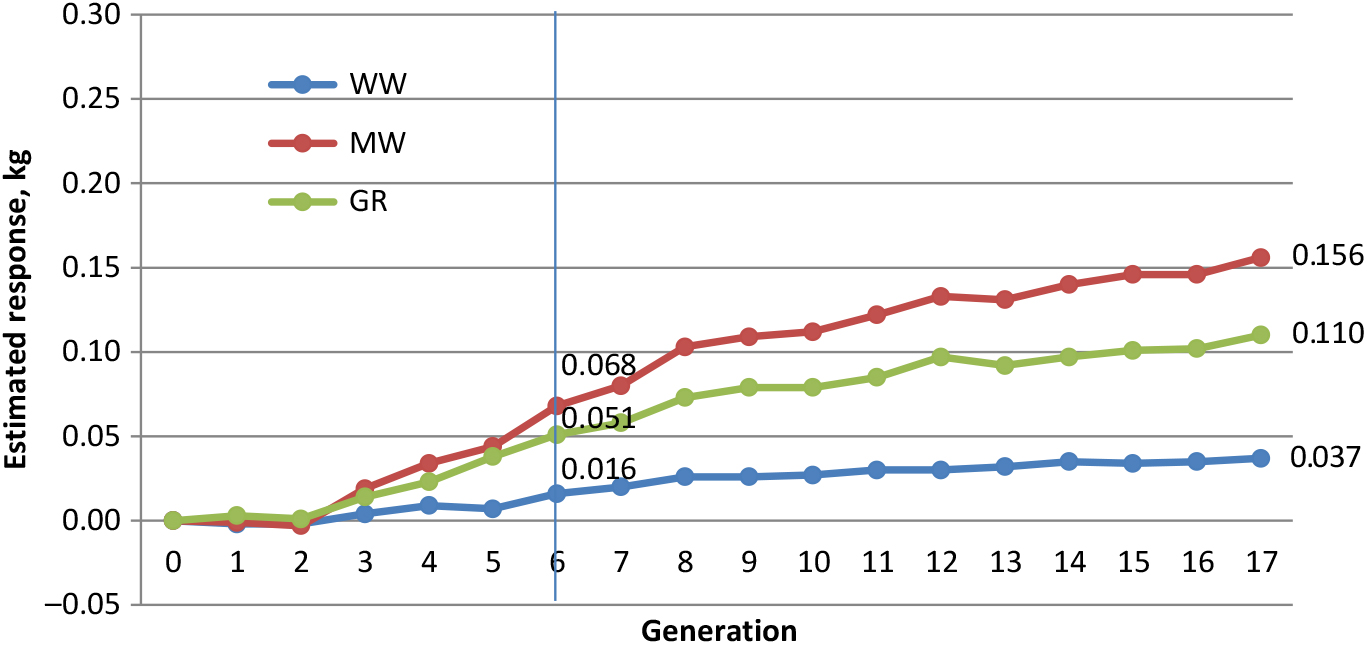
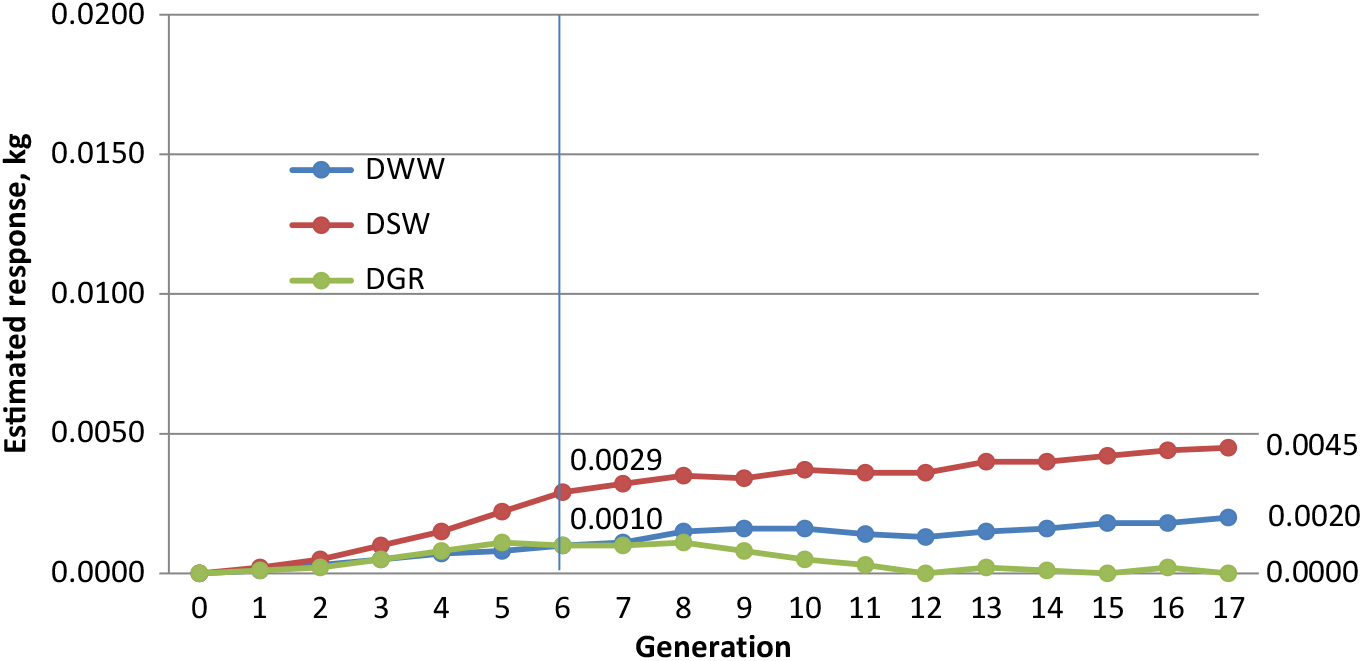
Rabbit line OR_LS was obtained by the selection of high OR for 6 generations (first period) and then by two-stage selection for OR and LS for 11 generations (second period). The correlated responses to selection were estimated at the end of both selection periods as the difference of the average breeding values between the end and the beginning of each period. Both selection periods are shown in all figures. In the first period, selection for the OR for six generations improved OR in 0.24 ova per generation (corresponding to an improvement of 1.5% per generation) but showed a low correlated response on LS (0.07 kits per generation, 0.8% per generation) (Badawy et al., Reference Badawy, Peiró, Blasco and Santacreu2019). Correlated responses on WW, SW and GR were found (Figure 1) being 2.7, 11.3 and 8.5 grams per generation, respectively. The correlated response on WW corresponded to 0.5% per generation which was estimated as the percentage of the response of selection by generation (0.016/6) with respect to the raw mean (0.50). Similarly, the response on SW and GR corresponded to 0.7% and 0.7% per generation, respectively. However, the correlated response on growth traits variability was close to zero (Figure 2). In pigs, selection by the OR increased the weight at puberty, although no correlated response on WW was found (Rosendo et al., Reference Rosendo, Canario, Druet, Gogue and Bidanel2007). In the selection experiment by the OR performed by Cunningham et al. (Reference Cunningham, Engl, Young and Zimmerman1979), no correlated responses were obtained for litter birth weight and litter WW.
Genetic trends for WW, SW and GR of the OR_LS line. OR_LS line is a rabbit line selected for the ovulation rate at second gestation from generation 0 to 6 and later for the ovulation rate at second gestation and litter size of the first two parities from generation 7 to 17. Values represent the mean of the estimated breeding value of the trait at the end of both selection periods. WW=weaning weight; SW=slaughter weight; GR=growth rate.

Genetic trends for DWW, DSW and DGR of the OR_LS line. OR_LS line is a rabbit line selected for the ovulation rate at second gestation from generation 0 to 6 and later for the ovulation rate at second gestation and litter size of the first two parities from generation 7 to 17. Values represent the mean of the estimated breeding value of the trait at the end of both selection periods. DWW=weaning weight variability; DSW=slaughter weight variability; DGR=growth rate variability.

In the second period of selection, Badawy et al. (Reference Badawy, Peiró, Blasco and Santacreu2019) found a lower response in OR (0.17 ova; i.e., 1.0% per generation) and a higher response in LS (0.17 kits; i.e., 1.9% per generation) than in the first period after 11 generations of two-stage selection. During this second period of selection, in agreement with a reduction of response on OR, the correlated response on growth traits was lower (Figure 1); 1.9, 8.0 and 5.4 g, which means an improvement around 0.4%, 0.5% and 0.4% per generation for WW, SW and GR, respectively. In addition, the correlated responses on growth traits variability were not found (Figure 2). No substantial changes in weight variability are in agreement with the nonvariation in postnatal survival from birth to slaughter previously described in this line by Badawy et al. (Reference Badawy, Peiró, Blasco and Santacreu2019).
The moderate positive genetic correlation estimated between OR and growth traits could explain the differences in correlated response between the two selection periods. During the first period of selection, a higher increase of OR was achieved, which is associated with a higher correlated response on growth traits. The positive correlated response in growth traits was in concordance with the results obtained in a pig line selected by the same selection criterion, a first period by the OR and thereafter by two-stage selection for the OR and number of fully formed pigs (Ruíz-Flores and Johnson, Reference Ruíz-Flores and Johnson2001). These authors showed a positive correlated response on weight at birth, at weaning and at 125 days. No information about correlated response on weight variability was provided in this two-stage experiment in pigs.
To sum up, selection for OR and for independent culling levels for OR and LS resulted in a slight increase in weight at weaning and slaughter, whereas the variability of these weights did not increase. These results are in concordance with the no correlated responses on survivals at weaning and at slaughter found in rabbit line OR_LS (Badawy et al., Reference Badawy, Peiró, Blasco and Santacreu2019). No negative consequences on growth traits can be expected in current commercial maternal lines.
Acknowledgements
This study was supported by the Ministerio de Economía y Competitividad (AGL2014-55921-C2-1-P) and by funds from Generalitat Valenciana research programme (Prometeo 2009/125).
M. A. Santacreu, 0000-0002-6847-9551
Declaration of interest
The authors declare no conflict of interest in this article.
Ethics statement
All experimental procedures involving animals were approved by the Universitat Politècnica de València Research Ethics Committee.
Software and data repository resources
None of the data were deposited in an official repository.