Implications
This study provides novel information on the effect of increasing the level of straw bale provision on welfare-related parameters in commercial broiler chickens. While levels may be stipulated in quality assurance schemes, there appears to be very little published research in this area. The results of this study suggest that increasing the number of straw bales provided in a standard windowed broiler house from 30 to 45 (or from 1 bale/44 m2 to 1 bale/29 m2 floor space) does not lead to significant improvements in welfare. This highlights the requirement for further research to determine the optimum level of provision of enrichment stimuli to maximize the welfare of birds within large commercial flocks.
Introduction
The effectiveness of environmental enrichment is thought to rest on the biological significance of the enrichment for the target species (Newberry, Reference Newberry1995). The provision of straw bales (SBs) may enable the performance of behaviours that have the potential to improve the welfare of commercial broiler chickens. Bales may conceal birds from any perceived threats during the performance of resting and preening behaviours (Newberry and Shackleton, Reference Newberry and Shackleton1997), which may reduce stress. Foraging behaviour has been shown to be increased in laying hens provided with access to straw on the ground compared with those without access (Aerni et al., Reference Aerni, El-Lethey and Wechsler2000). The addition of dry straw to the litter from the dismantlement of SBs by birds may therefore promote increased levels of ground pecking or foraging, which are typical fowl behaviours. This may also improve litter quality and, combined with increased activity levels, promote better leg health. SBs are an economically viable form of environmental enrichment and are easily replaced between rearing cycles, making their use as enrichment stimuli common within the UK broiler industry.
Past research showed a significant increase in activity levels in commercial broiler chickens when SBs were provided at a density of ∼1 bale/17 m2 of floor area compared with when none were provided (Kells et al., Reference Kells, Dawkins and Borja2001). However, more recent research carried out in windowed houses suggests that SBs, provided at a density of ∼1 bale/44 m2 of floor space, had no significant effect on activity levels (Bailie et al., Reference Bailie, Ball and O’Connell2013). Provision of SBs within the latter study did, however, exert some positive effects on leg health; a factor which was not measured in the study by Kells et al. (Reference Kells, Dawkins and Borja2001). The difference in the effect on activity levels observed in these two studies may have been attributable to the difference in the density of SBs supplied within houses.
At present there is no legislation governing the provision, or optimal levels, of enrichment stimuli for commercial broiler chickens in the EU (Council Directive 2007/43/EC, 2007). Chickens reared under assured welfare schemes, or those marketed by independent retailers as ‘improved welfare’ birds, are usually provided with access to environmental enrichment during rearing. However, the numbers and types of enrichments required by different schemes and retailers differ. In the United Kingdom the RSPCA Freedom Foods scheme, for example, requires a minimum of ‘1.5 standard sized, long chopped SBs per 1000 birds’, in addition to perches and pecking devices and access to natural light (RSPCA Welfare Standards for Chickens, 2011). Several large UK retailers also advertise birds from their improved welfare chicken ranges as having been reared in windowed houses with access to SBs, although the numbers and density of bales supplied is not specified to the consumer.
The aim of this experiment was to determine the effects of two levels of SB provision on the behaviour and leg health of commercial broiler chickens. The effects of providing either 30 bales (1bale/44 m2 of floor space) or 45 bales (1bale/29 m2 of floor space) per house were investigated. This study was performed as a follow-up to a previous commercial trial (Bailie et al., Reference Bailie, Ball and O’Connell2013). As such, the base level of 30 SBs was dictated by the level provided in this previous trial. Subsequently, however, there had been industry interest in increasing SB levels within windowed broiler houses, and provision of 45 bales reflected the new commercial practice on our partner farms. This was chosen as our comparative treatment (45SB) as it appeared to reflect a level that producers would be willing to implement in the absence of specific legislative requirements. We hypothesized that both the activity levels and walking ability of birds would be improved by the use of more SBs.
Material and methods
Treatments and experimental design
The effects of SB density on the behaviour and welfare of broiler chickens was assessed in a study incorporating two treatments: (1) 30 straw bales (30SB) and (2) 45 straw bales (45SB). The study took place in Northern Ireland between January and October 2011. Bales of wheat straw, each measuring 80×40×40 cm, were supplied from day 10 of the rearing cycle. These were dispersed as evenly as possible throughout the house at an average density of ∼1 bale/44 m2 of floor space in the 30SB treatment, and 1 bale/29 m2 in the 45SB treatment. As is normal commercial practice for the company on whose farms this research took place, plastic covering was left around the edges and across the top of opened bales. This increased the time the bales remained intact over the course of the rearing cycle. Over the course of the study, all bales were cut open by the research team in order to minimize differences in the size of area exposed to the birds (Bailie et al., Reference Bailie, Ball and O’Connell2013). In all, 24 bales in the 30SB treatment and 36 bales in the 45SB treatment were initially cut open on day 10 of the rearing cycle. Plastic was removed from the remaining bales after thinning occurred, during week 5. Bales were not replaced during the cycle. Two houses that were located on one farm and were identical in floor area, rectangular design and orientation were selected for this study. Each treatment was replicated six times (across six production/rearing cycles), with treatments alternated between houses in each replicate.
Animals, husbandry and housing
A total of 276 000 Ross and Cobb broiler chickens obtained from one breeding company (Aviagen Ltd, Newbridge, Midlothian, Scotland, UK) were used in this experiment. Approximately 23 000 birds were placed in houses ‘as hatched’, resulting in mixed-sex houses. The total floor area/house available to the birds was 1320 m2, resulting in an approximate initial stocking density of 17 birds/m2. Approximately half of the birds from each house were removed for slaughter during week 5 of the production cycle, and the remaining birds were removed during week 6. Stocking densities did not exceed 30 kg/m2. Temperature, ventilation and feeding regimes, and feed sources and blends, were identical between houses. Birds were fed on an ad libitum basis and received three different commercially available diets across the cycle.
Natural light was supplied through 46 windows per house (measuring 220 cm wide×60 cm high) that were located at a height of 1.5 m along the length of the two ‘long’ sides of the house. Windows comprised double glazed, toughened glass that allowed both visible wavelengths and a small amount of UV radiation to pass through. Artificial light was also provided in each house using two rows of 24 fluorescent strip lights running parallel to each other along the length of the house. Rows were placed 8 m from the nearest wall. In all, 48 1.2 m low frequency T8 tubes, emitting 3000 lumens each, were used in each house (F40w/29–530/RS warm white energy rating B; Disano Illuminazione UK Ltd, Doncaster, South Yorkshire, UK). Identical light fittings were also used in both houses (4 ft Disano Hybro 951 IP65 fitting; Disano Illuminazione UK Ltd).
The artificial lighting regime used was normal practice for the commercial supplier and was identical in both houses. The hours of darkness supplied rose by 1 h/day from 1 h at a day old, to 6 h by 7 days old. This regime was then maintained from 7 until 28 days old. From 29 days old, hours of darkness were gradually reduced by 1 h/day to 1 h by 33 days old. The darkness of 1 h was then maintained until the end of the rearing cycle. The dark period was between 0000 and 0600 h. Both lights and shutters were automatically controlled using timers. Shutters were set to automatically close and open at the start and end of the dark period, respectively.
Large fan heaters were placed in two uniform lines down the length of all houses and all drinkers were of the nipple variety and included cups. As is the usual practice on this farm, bedding comprised of wood shavings was placed in the house before the birds arriving. A total of 66 kg wood shavings was supplied per thousand birds. Additional sawdust was added to specific areas of the houses when deemed necessary by the farmer.
Measurements
Behavioural observations
Behaviour was assessed using direct focal observations that occurred between 0900 and 1200 h, and between 1300 and 1600 h on one particular day each week starting in week 3 and ending in week 5 of the rearing cycle. All measures were taken before thinning during week 5. The house shape was mapped and virtually divided into 36 equal-sized quadrants. Quadrants in which measures were carried out were preselected each week using random number tables. They were categorized as being either at the edge or centre of the house, and containing SBs or not. Individual focal observations of eight birds per house per week were conducted using an electronic data recorder (Psion Workabout mx; Motorola Solutions, Inc., Basingstoke, Hampshire, UK). Each observation within a given day was conducted in a different quadrant, and these were selected to include an equal number of edge and centre quadrants, and an equal number of quadrants with and without SBs. The observations were continuous and lasted for 10 min. A 5 min settling period was implemented before each focal observation. Successive observations alternated between the houses, and the house in which initial observations were carried out was alternated on a weekly basis. The bird to be observed was chosen by placing an ‘x’ on a randomly chosen section of a perspex grid divided into 36 5 cm² squares (Kells et al., Reference Kells, Dawkins and Borja2001). The Perspex was held up at arm’s length at the edge of the selected quadrant and an observation made of the bird observed closest to the ‘x’. The behaviours recorded during focal sampling are shown in Supplementary Table S1. The frequency of behaviours and the total percentage of time the birds spent performing different behaviours was determined.
Leg health
Leg health was assessed using a latency to lie test (Weeks et al., Reference Weeks, Knowles, Gordon, Kerr, Peyton and Tillbrook2002) and spontaneous gait scoring. These assessments were performed once a week starting in week 3 and ending in week 5 of the rearing cycle. Latency to lie measures were performed in one house, followed by spontaneous gait scoring, before moving on to the second house. The house that observations started in was alternated weekly, and observations always took place between 1200 and 1500 h. Gait scoring and latency to lie testing were performed in 25 quadrants in each house each week. Quadrants were randomly selected for each measure each week with the added provision that each quadrant was only selected once for each measure in order to limit the possibility of selecting the same bird repeatedly. Birds were selected for gait and latency to lie scoring in the same way as birds were selected for focal observations. The bird observed closest to the ‘x’ was gait scored, and the bird observed lying closest to the ‘x’ was assessed for latency to lie. The latency to lie test involved gently encouraging a lying bird into a standing position. A stopwatch was then used to record the time spent standing before the bird sat down. The test was terminated if no attempt to sit was witnessed after 5 min (Weeks et al., Reference Weeks, Knowles, Gordon, Kerr, Peyton and Tillbrook2002). The longer a bird remained standing, the better the leg health of that bird was deemed to be. The test was performed without use of a water bath (e.g. Sherwin et al., Reference Sherwin, Lewis and Perry1999; Bailie et al., Reference Bailie, Ball and O’Connell2013) in order to limit stress associated with bird handling and removal from house. Gait was scored on a scale of 0 to 5 where 0=normal movement and 5=unable to walk (Kestin et al., Reference Kestin, Knowles, Tinch and Gregory1992). No birds with a gait score of 5 were recorded during the trial. Of the 750 birds that were gait scored throughout the trial, only four birds were assigned a score of 4. These birds were brought to the attention of the farmer. The percentage of lame birds with a gait score of 3 and above was determined. The incidences of podo dermatitis and hock burn at slaughter were recorded by slaughterhouse staff, as described in Bailie et al. (Reference Bailie, Ball and O’Connell2013). The incidence of hock burn was recorded in 200 birds at thinning and 200 birds at slaughter. A total of 200 ft removed from birds at thinning and 200 ft removed from birds at slaughter were examined for the presence of podo dermatitis.
Environmental parameters
Light intensity (lux) values were recorded immediately following each focal observation from the centre of each of the four −SB quadrants selected for focal observations and from the nearest long side of a SB in the +SB quadrants in each house each week using a light meter (Digital lux meter LX1010B; Handsun Co. Ltd, Shanghai, China), held at arm’s length, at bird height. Four readings were taken at right angles to one another (N, S, E and W) and averaged in order to give one reading for each quadrant. Readings for all quadrants were averaged each week to give an average house light intensity value. UV wavelengths (µW/cm²) were measured using a UV meter (UV-340 meter; Lutron Electronic Enterprise Co. Ltd, Taipei, Taiwan) following the same procedure, with the exception that a single measurement was taken in each quadrant, pointing the meter towards the nearest source of UV light.
Productivity and mortality
The numbers of birds that died and that were culled for lameness and other reasons in each house were taken from company records on a weekly basis. Birds were culled as normal by farmers throughout the study.
Statistical analysis
Data were analysed using SPSS (version 20.0). Owing to logistical problems and equipment failure, behavioural data for both houses during Cycle 1, week 5; Cycle 3, weeks 3 to 5; and Cycle 4, week 3 were missing from the analysis. Gait scoring and latency to lie data from Cycle 1, week 5; Cycle 3, week 5; and Cycle 4, week 3 were also missing from the analysis for both houses. Histograms and QQ plots of the data were scrutinized for normality, and data were subjected to statistical testing for normality using the Shapiro–Wilk test and for homogeneity using Levene’s test. The frequency of immobility, preening, eating, idling, resting and ground pecking; the duration of standing, walking, resting, preening, eating, drinking and ground pecking; and the average gait score and percentage of lame birds did not meet either the assumptions of normality or homogeneity and were therefore transformed using log10 transformations. Data regarding the frequency of drinking and experiencing a disturbance were transformed using a square root transformation. Data containing zero values had 0.5 added to each value before transformation. The means of these measures (and of those that originally met assumptions of normality and homogeneity) were compared using ANOVA with the main effects of SB density, week and the interaction between these variables as treatment factors and ‘house’ as a blocking factor.
For all measures except slaughter weights, hock burn and podo dermatitis incidences, and cumulative percentage of dead birds at day 30 of the rearing cycle, average values per treatment, week and house were used as experimental units. All main effects, and interactive effects of treatment and week, were determined. For all other measures, average values per treatment and house were used as experimental units and main treatment effects were determined. Back transformed means, with 0.5 removed from each value where appropriate, are included in the results section for those measures that required transformation. Root mean squared error (RMSE) values are presented for ANOVA data and were calculated by taking the square root of error mean square values. Significant differences between weeks were ascertained using Tukey HSD post hoc tests. Some data did not meet assumptions of normality or homogeneity after transformation. These included the duration of immobility, the frequency of running, dust bathing, aggression and of bale pecking, the duration of running, lying, dust bathing, aggression, bale pecking and of vigilance, and the total number of birds culled by day 30 of the rearing cycle. Kruskal–Wallis test was therefore used to test the significance of the effect of bale density and week on each of these measures, except in the case of total number of culls, for which the effect of bale density alone was determined. Significant differences between weeks were ascertained using post hoc pairwise comparison tests.
Results
Environmental parameters
There was no significant difference in light intensity (30SB=57.95, 45SB=51.01, RMSE =29.85 lux, P=0.56) or UV wavelengths (30SB=4.10, 45SB=3.55, RMSE=1.06 µW/cm², P=0.19) between bale density treatments.
Behaviour
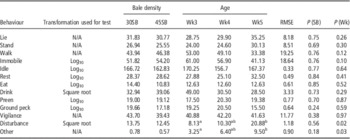
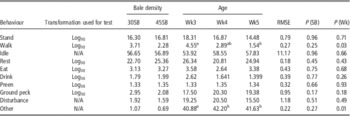
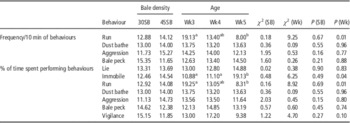
SB density had no significant effect on the frequency (per 10 min observation) of lying, standing, walking, immobility, vigilance, disturbances, preening, drinking, eating, idling, resting and ground pecking (Table 1) or on the frequency of running, dust bathing, aggression or bale pecking. Bale density also had no effect on the percentage of time birds spent walking, standing, resting, preening, eating, drinking, being idle, being disturbed and ground pecking (Table 2) or on the percentage of time spent lying, immobile, running, dust bathing, being aggressive, bale pecking or engaged in vigilance (Table 3).
Effect of straw bale density and age on normally distributed data on the mean frequency of behaviours performed during 10 min focal observations

N/A=not applicable; SB=straw bales, for the effect of straw bale density on all behaviours (d.f. 1, 25); Wk=week, for the effect of age on all behaviours (d.f. 2, 25); RMSE=root mean squared error.
Data analysed by ANOVA with ‘SBdensity×week’ as a treatment factor and ‘house’ as a blocking factor.
a,bMeans (within either the frequency or duration behaviour category) in the same row with a different superscript differ significantly. Data not presented in this table were not normally distributed and were therefore analysed using a Kruskal–Wallis test, the results of which are detailed in Table 3.
Effect of straw bale density and age on normally distributed data on the mean% of time spent performing behaviours during 10 min focal observations

N/A=not applicable; SB=straw bales, for the effect of straw bale density on all behaviours (d.f. 1, 25); Wk=week, for the effect of age on all behaviours (d.f. 2, 25); RMSE=root mean squared error.
Data analysed by ANOVA with ‘SBdensity×week’ as a treatment factor and ‘house’ as a blocking factor.
a,bMeans (within either the frequency or duration behaviour category) in the same row with a different superscript differ significantly. Data not presented in this table were not normally distributed and were therefore analysed using a Kruskal–Wallis test, the results of which are detailed in Table 3.
Effect of straw bale density and age on non-normally distributed data on the mean frequency and the mean% of time spent performing behaviours during 10 min focal observations

SB=straw bales, for the effect of straw bale density on all behaviours (d.f. 1, 25); Wk=week, for the effect of age on all behaviours (d.f. 2, 25).
Ranked means are displayed for each level of straw bale density and for each week.
Data were analysed using a Kruskal–Wallis test with ‘straw bale density’ and ‘week’ as treatment factors.
a,bRanked means (within either the frequency or duration behaviour category) in the same row with a different superscript differ significantly. Data not presented in this table were normally distributed and were therefore analysed using ANOVA, the results of which are detailed in Tables 1 and 2.
The average frequency of disturbances experienced by focal birds increased significantly with age, although the frequency of lying, standing, walking, immobility, vigilance, preening, drinking, eating, idling, resting and ground pecking remained unaffected (Table 1). The frequency of running decreased significantly with age, however, no significant age effects were shown for dust bathing, aggression and bale pecking (Table 3).
The average percentage of time spent walking decreased with age, whereas the percentage of time spent standing, resting, preening, eating, drinking, being idle, being disturbed and ground pecking were unaffected by age (Table 2). The percentage of time spent running decreased, and the percentage of time spent immobile increased with age (Table 3). There was no significant effect of age on the percentage of time spent lying, dust bathing, being aggressive, bale pecking and being vigilant (Table 3).
Leg health
SB density had no significant effect on average gait score (30SB=1.25, 45SB=1.30, RMSE=0.06, P=0.29), the percentage of lame birds (30SB=12.78, 45SB=13.02, RMSE=0.18%, P=0.80), the percentage of birds with hock burn (30SB=15.67, 45SB=12.00, RMSE=6.41%, P=0.37) or on the percentage of feet with podo dermatitis (30SB=55.25, 45SB=53.41, RMSE=18.86%, P=0.88). However, average latency to lie was significantly longer in the 30SB treatment than in the 45SB treatment (30SB=23.38, 45SB=18.62, RMSE=4.16 s, P<0.01).
There was a significant increase in gait score with age (week 3=0.68, week 4=1.21, week 5=1.94, RMSE=0.06, P<0.01). In addition, there was a significant increase in the percentage of lame birds (week 3=1.20, week 4=7.00, week 5=30.50, RMSE=0.18%, P<0.01) and a significant decrease in average latency to lie (week 3=25.71, week 4=20.32, week 5=16.98, RMSE=4.16 s, P<0.01) with age.
Culls, mortalities and productivity
SB density had no significant effect on the average slaughter weight of birds recorded during thinning and clearing (30SB=2261.46, 45SB=2151.15, RMSE=131.74 g, P=0.21), on the number of birds culled (ranked means: 30SB=6.67, 45SB=6.33, χ²(1, n=12) 0.03, P=0.87), or on the cumulative percentage of dead birds recorded at day 30 of the rearing cycle (30SB=2.86, 45SB=2.76, RMSE=0.55%, P=0.76).
Discussion
Research performed under commercial conditions showed that provision of SBs at a density of 1 bale/17 m2 led to significant increases in activity levels of broilers compared with when no bales were provided (Kells et al., Reference Kells, Dawkins and Borja2001). More recent research performed within windowed houses showed no significant effect of access to SBs provided at a lower density of 1 bale/44 m2 on the percentage of time birds spent engaged in behaviours such as lying, standing, resting, eating, preening and aggression or on the frequency of any of the behaviours recorded within the study (Bailie et al., Reference Bailie, Ball and O’Connell2013). The results of the current study suggest that increasing the number of SBs by 50%, and therefore increasing the density of bales from ∼1 bale/44 m2 to 1 bale/29 m2 of floor space, had no significant effect on welfare-related parameters such as activity levels, walking ability or incidence of podo dermatitis and hock burn. However, no significant differences in slaughter weights, mortalities and culls were evident between treatments, suggesting that increasing the density of SBs had no detrimental effects on productivity.
As the present study was performed in windowed houses, it is possible that variations in the light intensity and UV levels within houses may have influenced broiler behaviour (Newberry et al., Reference Newberry, Hunt and Gardiner1988; Maddocks et al., Reference Maddocks, Cuthill, Goldsmith and Sherwin2001; Bailie et al., Reference Bailie, Ball and O’Connell2013). However, results showed no significant difference in the intensity or UV content of light between treatments, suggesting that these factors would have had limited effects on the frequency or duration of performed behaviours. The lack of a significant treatment effect on the majority of measures in this study may have reflected the relatively small difference in the numbers of bales provided in each treatment. For example, as bales were dispersed as evenly as possible throughout houses, the average distance between bales would have been 6.6 and 5.4 m in the 30SB and 45SB treatments, respectively. In addition, competition for bales would not have differed greatly between treatments, with ∼1 bale/500 birds in the 45SB treatment and 1 bale/760 birds in the 30SB treatment. However, in order for this study to be applicable to the broiler industry, treatments were designed to reflect baseline and increased levels of SB provision likely to be seen in commercial practice.
The significant increase in the frequency of disturbances experienced by birds as they aged was most likely owing to the increase in stocking density and crowding over the course of the rearing cycle (Hall, Reference Hall2001). The significant decrease in locomotion with age echoes results of past research (Knowles et al., Reference Knowles, Kestin, Haslam, Brown, Green, Butterworth, Pope, Pfeiffer and Nicol2008) and may be attributable to an increase in stocking density (Estévez et al., Reference Estévez, Newberry and Arias de Reyna1997). It may also have been because of the negative effect of weight gain on leg health (Julian, Reference Julian1998; Kestin et al., Reference Kestin, Gorden, Su and Sorensen2001) that was reflected within this study in the significant increase in gait score, and decrease in latency to lie, across weeks.
Results showed an increased latency to lie in birds provided with 30 bales compared with those provided with 45 bales. The leg health implications of this finding are difficult to interpret in the absence of an accompanying significant improvement in gait score. As birds rarely used SBs for perching, possibly owing to difficulty in accessing the top of high bales (Carley Bailie, personal observation), it is possible that increased numbers of SBs may have resulted in decreased floor space available for use by the birds (Kells et al., Reference Kells, Dawkins and Borja2001). Increased bale numbers may therefore have effectively increased stocking density, and this has been shown to have a detrimental effect on latency to lie in broilers (Buijs et al., Reference Buijs, Keeling, Rettenbacher, Van Poucke and Tuyttens2009). However, as bales tended to disintegrate over the course of the rearing cycle, the resultant decrease in floor space associated with the provision of extra SBs may not have been an issue during the latter weeks of the rearing cycle. In any case, the initial floor area taken up by SBs was 9.6 m2 in the 30 bale treatment and 14.4 m2 in the 45 bale treatment. This meant that the difference in the size of area allowed for each individual bird was little more than 2 cm2 and that the reduction in space per bird, and the resultant increase in stocking density, with the provision of 45 bales was not likely to be biologically meaningful.
Under natural conditions, fowl tend to seek out cover for the performance of resting behaviour (Woodgush et al., Reference Woodgush, Duncan and Savory1978), and 2- to 3-week-old broilers continue to display a similar behavioural repertoire to their Red Jungle Fowl ancestors (Collias and Collias, Reference Collias and Collias1967). Modern broilers have shown a tendency to gather around SBs, poultry house roof supports and walls (e.g. Kells et al., Reference Kells, Dawkins and Borja2001). Laying hen strains have also been shown to spend more time in areas containing vertical cover panels, and also to display an increase in preening and resting behaviours when provided with panels (Newberry and Shackleton, Reference Newberry and Shackleton1997). The increased performance of these behaviours may indicate a reduction in fearfulness, or vigilance. Therefore, owing to the way in which the latency to lie test was carried out, it is also possible that the increased latency to lie in 30SB birds was because of increased fearfulness associated with reduced (SB) cover within the windowed houses. However, no difference in vigilance was observed between treatments within this study, suggesting that birds provided with 30 bales were no more apprehensive of their environment than birds provided with 45 bales.
In conclusion, increasing the level of SBs provided did not exert significant effects on the activity levels or productivity of commercial broiler chickens. Walking ability and leg health in general remained largely unaffected by the numbers of SBs provided. This suggests that an increase in the level of SBs of the magnitude, which is likely to be seen in commercial practice, may not be sufficient to significantly improve broiler chicken welfare. Further research is required to determine the optimum level of provision of enrichment stimuli to maximize the welfare of birds within large commercial flocks.
Acknowledgements
This research project was funded by the Department of Agriculture and Rural Development in Northern Ireland. The authors also wish to thank Moy Park Ltd for allowing access to their farms, and for their support and advice throughout the project.