1. Introduction
It has been shown that bilinguals, especially if they still do not have a high proficiency in the second language (L2), can display difficulties in some aspects of their linguistic competence, including vocabulary (Bialystok, Luk, Peets & Yang, Reference Bialystok, Luk, Peets and Yang2010; Oller, Pearson & Cobo-Lewis, Reference Oller, Pearson and Cobo-Lewis2007), lexical access, as measured by rapid naming tasks (Gollan, Fennema-Notestine, Montoya & Jernigan, Reference Gollan, Fennema-Notestine, Montoya and Jernigan2007) and processing of complex morphosyntactic structures (Sorace, Serratrice, Filiaci & Baldo, Reference Sorace, Serratrice, Filiaci and Baldo2009; Vender, Garraffa, Sorace & Guasti, Reference Vender, Garraffa, Sorace and Guasti2016).Footnote 1 If having a less rich vocabulary in each of the two languages with respect to monolinguals is a distinctive and persistent trait of the linguistic competence of bilinguals at any age, grammatical difficulties appear to be more strongly related to a still immature competence in the L2 and are thus likely to dissipate over time, as the levels of exposure and competence in the target language increase. This is the case, for instance, of clitic production, a structure which, due to its morphosyntactic complexity, is particularly difficult to master: bilingual children with 3 years of exposure to Italian struggle in the production of the correct pronoun (Vender et al., Reference Vender, Garraffa, Sorace and Guasti2016), whereas children with a longer (i.e., 7 years) exposure reach the monolingual standard (Vender, Delfitto & Melloni, Reference Vender, Delfitto and Melloni2018).
An area which seems to be instead less affected by bilingualism and by aspects related to the exposure to the target language is provided by nonword repetition, a task in which subjects are asked to repeat pronounceable but meaningless strings of sounds modeled after the target language. In the following sections, we introduce the cognitive and linguistic underpinnings of this task (section 1.1.), presenting the results reported in the literature concerning the performance in nonword repetition of bilinguals (section 1.2) and dyslexics (section 1.3), and we discuss the possibility of using this measure to integrate the diagnostic procedure of dyslexia in both monolinguals and bilinguals (section 1.4). In the next sections, we present our experimental protocol, testing monolingual and bilingual children, with and without a diagnosis of dyslexia, in nonword repetition, and we discuss its results and implications.
1.1. Nonword repetition: Cognitive and linguistic underpinnings
To perform successfully in a nonword repetition task, subjects need to create a well-specified acoustic representation of a novel word modeled after the target language, and to maintain it in memory to support articulation. This apparently easy task actually taps a variety of cognitive and linguistic processes, including phonological working memory, speech perception and articulation, phonological processing and lexical knowledge (Coady & Evans, Reference Coady and Evans2008; Melloni & Vender, Reference Melloni, Vender, Babatsouli and Ballforthcoming). Phonological memory skills are crucial in this task, as the participant has to keep in memory a meaningless string of sounds and to analyze its segmental and prosodic structure. Phonological awareness and processing abilities, both representationally and computationally independent from memory, are also needed to create a well-specified acoustic representation of the nonword and to support its successive articulation (Snowling et al., Reference Snowling, Chiat and Hulme1991). The complexity of the task makes it particularly sensitive to a variety of language and learning disorders, such as Specific Language Impairment (SLI; Bishop, North & Donlan, Reference Bishop, North and Donlan1996; Conti-Ramsden, Botting & Faragher, Reference Conti-Ramsden, Botting and Faragher2001; Leonard, Reference Leonard2014) and Developmental Dyslexia, as we will discuss in detail in section 1.3. Children with developmental dyslexia, in particular, are expected to underperform their typically developing peers in nonword repetition, since developmental dyslexia is a neurobiological disorder characterized by poor phonological processing and verbal working memory skills. On the other hand, nonword repetition should be independent from language exposure, as it deploys verbal stimuli that are not part of the speaker's lexical knowledge. Therefore, as we will see below, nonword repetition tasks could be adopted to identify language disorders in bilingual children, who might show a degraded linguistic profile in tasks based on the lexicon of the L2, whilst performing at ceiling in tasks based on nonwords modeled after the L2. We will discuss the issue more thoroughly below.
1.2. Nonword repetition skills in bilingual children
Given their independence from the subject's vocabulary knowledge and their sensitivity to learning and language impairments, as we will discuss below, nonword repetition tasks can provide a particularly precise measure of phonological coding and phonological memory abilities, especially in the case of bilinguals, who could be more penalized in similar tasks assessing real-word repetition or sentence imitation (Thordardottir & Brandeker, Reference Thordardottir and Brandeker2013). They also constitute a useful tool for assisting in the identification of language and reading disorders in bilinguals. Indeed, a number of studies have investigated the role of nonword repetition as a possible measure to identify language impairments in bilingual children. Typically developing bilingual children have been reported to perform more accurately in nonword repetition in their second language in comparison to monolingual children with language impairment (Girbau & Schwartz, Reference Girbau and Schwartz2008), although in some cases less optimally than their monolingual peers, as evidenced by Kohnert, Windsor and Yim (Reference Kohnert, Windsor and Yim2006), who assessed nonword repetition skills in English L2 of a group of Spanish L1 children, and by Messer, Leseman, Boom and Mayo (Reference Messer, Leseman, Boom and Mayo2010), who investigated nonword repetition in Dutch L2 of a group of Turkish L1 children. Differences between monolingual and bilingual typically developing children in nonword repetition seem to be related, at least to some extent, to their competence in the tested language, as witnessed by the fact that accuracy rates are typically higher in the L1 than in the L2 (Masoura & Gathercole, Reference Masoura and Gathercole1999; Thorn & Gathercole, Reference Thorn and Gathercole1999). Although a disadvantage for bilinguals in nonword repetition is reported in some languages, including English (by far the most investigated language) and Dutch, monolingual-likeFootnote 2 performance is reported in other languages, like Italian (Guasti, Maggioni & Vernice, Reference Guasti, Maggioni, Vernice and Grassi2013). Specifically, Vender et al. (Reference Vender, Garraffa, Sorace and Guasti2016) reported that 120 preschool bilingual children having Italian as L2 and Albanian, Arabic or Romanian as L1 performed at ceiling and similarly to Italian monolingual children in nonword repetition, despite exhibiting difficulties in grammatical tasks (i.e., clitic production). Importantly, no differences were found amongst the three groups of bilinguals, who showed a very accurate performance, which allowed the authors to exclude the presence of a transfer from the L1 to Italian. Moreover, no correlations were found between accuracy in nonword repetition and indexes of exposure to the L2, indicating that these factors play only a minor role, if any, in nonword repetition (see also Thordardottir & Brandeker, Reference Thordardottir and Brandeker2013).Footnote 3
The contrasting results emerging from languages like English and Dutch on the one hand, and Italian on the other, suggest that crosslinguistic differences in nonword repetition could be related to the phonotactic structure of the target language, which is arguably more complex in English and Dutch than in Italian, in terms of syllabic structure and phonemic inventory.
This explanation is in line with Vender et al. (Reference Vender, Garraffa, Sorace and Guasti2016), who also argue that the monolingual-like performance of L2 Italian bilinguals could be related to the fact that Italian has a simpler syllabic and phonemic structure than English or Dutch. Italian can thus be considered a language with a relatively simple phonotactic system, in consideration of its reduced phonemic inventory, simple syllable structures and clear syllable boundaries (Kramer, Reference Kramer2009).
Interestingly, Tamburelli, Sanoudaki, Jones and Sowinska (Reference Tamburelli, Sanoudaki, Jones and Sowinska2015) reported an advantage for Polish–English bilinguals compared to English monolinguals in a nonword repetition task modeled after English, arguing that this benefit could be related to the extremely high phonological complexity of Polish, which might have accelerated the development of a phonologically less complex language. Notice that this hypothesis could also explain the difficulties in nonword repetition found by Kohnert et al. (Reference Kohnert, Windsor and Yim2006) and Messer et al. (Reference Messer, Leseman, Boom and Mayo2010): both Spanish and Turkish, indeed, have simpler phonotactics than English and Dutch. Consistently, an interesting study conducted by Boerma, Chiat, Leseman, Timmermeister, Wijnen and Blom (Reference Boerma, Chiat, Leseman, Timmermeister, Wijnen and Blom2015) reported that, while Dutch L2 bilingual children with different L1 backgrounds displayed a disadvantage with respect to their monolingual peers in a nonword repetition task modeled after Dutch, differences disappeared when the task was “simplified” using only phonological features that are most commonly represented across languages. This confirms that the difficulties displayed by bilinguals were indeed related to the complexity of the Dutch phonotactics and to their lower familiarity with some troublesome and language-specific aspects of this language.
Summarizing, when administering to bilingual children a nonword repetition task modeled after their L2, it seems quite reasonable and in effect essential to look at the simplicity/complexity of the L2 phonotactics, rather than to the distance between the L1 and the L2. More particularly, when the task is administered in a language with a simple phonotactics, like Italian, no effects related to the nature of the L1 are expected to arise, since bilinguals generally achieve quite early a good performance in the task irrespective of the L1.
1.3. Nonword repetition skills in Developmental Dyslexia
Developmental Dyslexia is a disorder characterized by the presence of reading and spelling deficits in individuals displaying normal intelligence level and adequate school opportunities, in absence of physical and neurological deficits. Beyond the well-known difficulties related to the acquisition of literacy, dyslexics typically present deficits affecting their linguistic competence, including phonology, but also morpho-syntax, lexical access and pragmatics, and their processing functions (Nicolson & Fawcett, Reference Nicolson and Fawcett2008; Vender, Reference Vender2017). Phonological impairments, in particular, have been extensively reported as a hallmark of dyslexia, occurring in school-aged children (Ramus, Pidgeon & Frith, Reference Ramus, Pidgeon and Frith2003), as well as in preschool children (Scarborough, Reference Scarborough1990) and in adults who apparently compensated for their difficulties (Bruck, Reference Bruck1992).
Nonword repetition constitutes a widely investigated domain: dyslexic individuals have been found to perform significantly worse than both chronological-age and reading-age matched children (Kamhi & Catts, Reference Kamhi and Catts1986; Szenkovits & Ramus, Reference Szenkovits and Ramus2005; Tijms, Reference Tijms2004, among others) and independently from the languages tested (Paulesu, Démonet, Fazio, McCrory, Chanoine, Brunswick, Cappa, Cossu, Habib, Frith & Frith, Reference Paulesu, Démonet, Fazio, McCrory, Chanoine, Brunswick, Cappa, Cossu, Habib, Frith and Frith2001). Deficits are particularly severe as the length of the nonwords increases, although marked difficulties can be noticed also with shorter stimuli (Couture & McCauley, Reference Couture and McCauley2000; Grivol & Hage, Reference Grivol and Hage2011; Snowling, Reference Snowling1981).
As mentioned above, nonword repetition tasks are sensitive to both language and learning disorders: Catts, Adlof, Hogan and Weismer (Reference Catts, Adlof, Hogan and Weismer2005) found that nonword repetition deficits are even more marked in dyslexia and in children with comorbid dyslexia and SLI than in children with SLI only. Given that this task requires both phonological short-term memory and phonological skills, allowing segmentation of the stimulus in temporally ordered speech units as well as access to solid phonological representations (see Ramus & Szenkovitz, Reference Ramus and Szenkovits2008 for a discussion on this topic), nonword repetition tasks cannot disentangle between phonological competence and memory effects. The difficulties exhibited by dyslexics in this domain could thus be captured by theories proposing that dyslexia is characterized by a phonological deficit (Snowling, Reference Snowling1995; Ramus, Reference Ramus2003) and a working memory and phonological memory inefficiency (Beneventi, Tønnessen, Ersland & Hugdahl, Reference Beneventi, Tønnessen, Ersland and Hugdahl2010; Vender, Reference Vender2017).
1.4. Nonword repetition as a possible diagnostic measure for monolingual and bilingual dyslexic children
Beyond the lexical and morphosyntactic difficulties reported in bilingualism and discussed above, some studies indeed indicate that bilingual children might struggle in the acquisition of literacy skills, especially if they learn to read and write for the first time in their second language, without having prior literacy instruction in their first language (August & Shanahan, Reference August and Shanahan2006; Bernhardt, Reference Bernhardt2003). Although these difficulties are particularly marked for languages with an opaque orthographic system, as English or French, differences between monolinguals and bilinguals have been reported also for languages with a transparent orthographic system, like Italian or German (see Seymour, Aro & Erskine, Reference Seymour, Aro and Erskine2003 for a discussion on the impact of the orthographic system in literacy acquisition). In Italian, which is characterized by regular correspondences between phonemes and graphemes, a number of studies reported a lower accuracy in real word reading for bilinguals in comparison to monolinguals (Cornoldi, Tressoldi & Perini, Reference Cornoldi, Tressoldi and Perini2010; Murineddu, Duca & Cornoldi, Reference Murineddu, Duca and Cornoldi2006). A more severe deficit in the accuracy of word reading, in comparison to nonword reading, has been found also in bilingual dyslexic children with Italian as L2, who were even more impaired than monolingual dyslexics in this domain (Scortichini, Stella & Morlini, Reference Scortichini, Stella and Morlini2012). This selective difficulty is likely related to the competence in Italian of the bilingual children, who often are still in the process of acquiring their L2, and in particular to their poorer vocabulary skills. For instance, their less developed lexicon could hinder the recognition and the decoding of familiar words, which are instead more easily read by children with a richer vocabulary, like the monolingual peers (Bellocchi, Bonifacci & Burani, Reference Bellocchi, Bonifacci and Burani2016; Primativo, Rinaldi, O'Brien, Paizi, Arduino & Burani, Reference Primativo, Rinaldi, O'Brien, Paizi, Arduino and Burani2013; Vender & Guasti, Reference Vender, Guasti, Bidese, Casalicchio and Moroniforthcoming). In addition, difficulties are expected to diminish as competence in the L2 increases, as testified by the fact that reading problems tend to disappear after a couple of years of adequate schooling exposure, indicating that they were not related to an actual reading disorder (August & Shanahan, Reference August and Shanahan2006).
However, ignoring these issues and assessing the reading abilities of bilingual children without taking into consideration factors related to exposure and competence in the second language could have a negative impact on the diagnostic procedures for dyslexia, leading to an inflation of both mistaken identities, which arise when a child is inappropriately diagnosed as dyslexic (i.e., false positives), and missed identities, when a real disorder remains undiagnosed (i.e., false negatives; Paradis, Reference Paradis2005). Indeed, due to the absence of normative data relative to the trajectory of early L2 acquisition and of diagnostic tools specifically designed for bilinguals, it can be difficult to properly identify learning disabilities, as well as language impairments, in bilingualism (Bedore & Peña, Reference Bedore and Peña2008).
Although the best way to identify a reading (or language) impairment in bilinguals would consist in assessing them in both their languages, this strategy is hardly feasible. Indeed, in our cosmopolitan society a great heterogeneity is found regarding the languages spoken by children. In Italy, for instance, bilingual children acquiring Italian as L2 typically have a migrant background and thus have very heterogeneous L1s. Testing each child in both their L1 and Italian would necessitate a high number of health professionals with an appropriate competence in each of the languages considered, not to mention that in some languages standardized tests to assess reading skills or linguistic competence have even not been developed yet.
It would be thus extremely important to identify specific tools that could be employed to integrate the diagnostic procedure, in order to diminish the rate of false positives and false negatives. Considering the crucial role played by phonological abilities in reading acquisition, it has been proposed that nonword repetition skills can predict reading difficulties since they reflect the extent to which a person is able to process phonological information (De Bree, Wijnen & Gerrits, Reference De Bree, Wijnen and Gerrits2010).
In view of its sensitivity to reading development and dyslexia, and of its independence from vocabulary and L2 exposure factors, nonword repetition could be a good task for assisting in the identification of dyslexia, especially in bilingual children.
Although there are studies suggesting that lexical access, as measured by rapid naming tasks, could be even more effective than phonological abilities in predicting dyslexia in shallow orthographic systems (see Brizzolara, Chilosi, Cipriani, Di Filippo, Gasperini, Mazzotti, Pecini & Zoccolotti, Reference Brizzolara, Chilosi, Cipriani, Di Filippo, Gasperini, Mazzotti, Pecini and Zoccolotti2006 for a study on Italian), we believe that nonword repetition is more suitable for our purposes: bilinguals, indeed, are generally reported to show a slower lexical access in comparison to monolinguals, as mentioned in the introduction, and they would be thus penalized if tested with this measure. No penalization effects are indeed expected to arise in the case of nonword repetition. Since no studies have currently investigated the interaction between bilingualism and dyslexia in this domain, in order to follow this path of research it is a priority to verify how bilinguals actually perform in this kind of task and how bilingualism interacts with dyslexia. The aim of this paper is that of shedding light on this topic by comparing the performance of monolingual and bilingual children, with and without a diagnosis of dyslexia, in a nonword repetition task and, subsequently, by assessing whether this could be a valuable tool to support the identification of dyslexia in bilingual children.
2. Method
2.1. Participants
The protocol was administered to 111 children, divided in 4 groups: 24 bilingual dyslexic (BD) children (mean age: 10.33 y.o., SD = 1.35), 24 monolingual dyslexic (MD) children (10.07 y.o., SD = 1.24), 30 typically developing bilingual (BC) children (10.20 y.o., SD = 1.20) and 33 typically developing monolingual (MC) children (9.98 y.o., SD = 0.96). A one-way ANOVA with Group (BD, MD, BC, MC) as an independent variable confirmed that there were no significant age differences amongst the four groups (F (3,107) = .546, p = 652). Having a formal diagnosis of developmental dyslexia was the inclusion criterion for the two groups of dyslexic children. The diagnosis was provided prior to the participants’ recruitment by a team of health professionals (neuropsychiatrists, psychologists and speech therapists) working in the local Italian Health Care System based on standard criteria (ICD-10, F 81.0; World Health Organization, 2004). Both monolingual and bilingual dyslexic children manifested severe reading deficits, in absence of cognitive deficits, hearing or visual disorders. No comorbidities with other linguistic disorders including Specific Language Impairment or Developmental Language Disorder were reported for any of the children. Dyslexics were recruited from clinical speech centers or public schools in the area of Trento and Verona, in the North-East of Italy. The typically developing bilingual children were recruited in the same public schools as the dyslexic children, and they were carefully selected as not displaying reading or language disorders, or other cognitive, hearing or visual problems. In order to exclude the presence of reading difficulties in the control groups and to further confirm decoding deficits in dyslexic children, all participants were administered at a preliminary level the word and nonword reading tests that are commonly used in the diagnosis of this disorder in Italian, as will be explained in section 2.2.1. Four measures were considered: accuracy and speed in word and nonword reading. To provide a further confirmation of the presence of reading disorders in diagnosed children, only children scoring lower than 2 SD below the mean in at least two measures were included in the two groups of dyslexics.
As for the control groups, no child scoring lower than 1.5 SD below the mean of their reference group in any of the four measures of the task was included in the study, in order to exclude the presence of false negatives (i.e., children showing reading deficits without having received a diagnosis of dyslexia). To reduce also the risk of false positives (i.e., children with a diagnosis of dyslexia whose reading deficits are rather determined by their poor exposure to Italian), we included in our samples of bilinguals only children with a rather long exposure to Italian (at least 5 years) and at least 2 consecutive years of school attendance in Italy. As evidenced by August and Shanahan (Reference August and Shanahan2006), reading delays or difficulties might be found in typically developing children in their first stages of literacy exposure, and should disappear after 2 years of regular practice, especially in a language with a transparent orthographic system like Italian.
All bilingual children had Italian as their L2 and spoke another language at home; our choice to include children speaking diverse L1s was motivated by the difficulty of finding a sufficiently representative sample of bilingual dyslexic children with the same L1 background. The L1s spoken by the bilingual dyslexics were: Arabic (6 children), Albanian (6), Romanian (5), Spanish (2), Hindi (1), Turkish (1), Kosovan (1), Yoruba (1) and Senegalese Wolof (1). The L1s spoken by the bilingual controls were: Romanian (10 children), Arabic (8), Albanian (4), Hindi (2), Spanish (1), Ghanaian (1), Nigerian (1), Serbian (1), Polish (1) and Macedonian (1). However, we collected precise information about the children's exposure to the two languages by using the Bilingual Language Exposure Questionnaire (see Vender et al., Reference Vender, Garraffa, Sorace and Guasti2016 for a study deploying an Italian adaptation of Unsworth et al.'s 2012 original questionnaire) and by gathering measures about the children's Age of First Exposure (AFE) to L2 Italian, their current Quantity of Exposure (QE) to Italian, the Traditional Length of Exposure (TLE), calculated as the child's chronological age minus their age at first exposure to Italian, and the Cumulative Length of Exposure (CLE), which takes into account other variables able to determine in a more precise way the child's exposure to the L2. As displayed in Table 1, both groups of bilinguals had a quite long exposure to Italian (7.71 years for bilingual dyslexics and 8.08 for bilingual controls) and, at the moment of testing, they were actually exposed to Italian more than to their home language (67% for bilingual dyslexics and 64% for bilingual controls), which should not come as a surprise, considering that they were spending on average 8 hours a day at school, where only Italian was spoken; all of them also had a good proficiency in their L2 (both in comprehension and in production) as indicated by teachers’ reports. Nevertheless, as an additional inclusion criterion, the information collected by means of the questionnaire allowed us to ascertain that all the bilingual children had an active, native competence in their first language, as testified by their parents, and that they used the L1 on a daily basis. Children with only a passive competence in the home language were not included in the study.
Means (and SDs) of bilingual children's exposure to Italian.

Note: AFE = Age of First Exposure; QE = Current Quantity of Exposure; TLE = Traditional Length of Exposure; CLE = Cumulative Length of Exposure
Moreover, parents were asked to evaluate their children's competence in their native language, rating their ability in both listening and speaking from 1 (“very low”) to 5 (“very good”); only children whose proficiency in both productive and receptive skills were rated “good” or “very good” were included in the sample. In this way, we circumvented the practical impossibility of formally assessing the participants’ proficiency in their native languages, gathering an indicative information of their competence in the L1.
We also collected information about the presence of literacy in the L1, by asking parents if their children were able to read and write in their home language. None of the children was reported to have received a literacy instruction, even informal at home, in the L1. These data, besides excluding the possibility of transfer effects from the orthographic system of the L1 to that of the L2, reflect a situation of general scarce awareness, on the part of families, of the importance of maintaining the home language in all of its components, including literacy. This situation should be addressed by specific sociolinguistic policies, underlining the possible benefits that literacy instruction in the L1 and the related expected enhancement of metalinguistic abilities could have on the development of both the L1 and the L2 (Cummins, Reference Cummins2000; Kupisch & Rothman, Reference Kupisch and Rothman2018, Vender and Guasti, Reference Vender, Guasti, Bidese, Casalicchio and Moroniforthcoming).
One-way ANOVAs revealed no differences between bilingual dyslexic and typically developing children regarding AFE (F(1, 51) = .254, p = .616), QE, (F(1, 51) = .375 p = .543, TLE, F(1, 51) = .386, p = .537, and CLE, F(1, 51) = .285, p = .595.
The study was approved by the local ethics committee and conducted in accordance with the standards specified in the 2013 Declaration of Helsinki; moreover, we obtained written informed consent from the parents of all the children who took part in our research study.
2.2. Materials
2.2.1. Preliminary Measures
To assure cognitive balance amongst the groups, we ran a series of preliminary tasks, assessing the children's nonverbal cognitive abilities, reading skills, receptive vocabulary and phonological memory. All tests were run in Italian, which was the language of instruction of all the children.
As for the cognitive level, we administered the Raven's Colored Progressive Matrices test (Raven, Court & Raven, Reference Raven, Court and Raven1998), adopting the Italian standardization (Belacchi, Scalisi, Cannoni & Cornoldi, Reference Belacchi, Scalisi, Cannoni and Cornoldi2008); as an inclusion criterion, participants had to score higher than -1.5 DS under the mean of their age-reference group.
To have a measure of the subjects’ Working Memory we administered a forward digit span task (FDS), from the Working Memory Test Battery for Children (Pickering & Gathercole, Reference Pickering and Gathercole2001) adapted to Italian (Vender, Reference Vender2017). The FDS involved the spoken presentation of sequences of digits, uttered in an even monotone at the rate of 1 per second. The experimenter uttered a sequence of digits of increasing length (starting from only one digit) and the child was asked to repeat the digits exactly in the same order as they were presented. Testing stopped when the child committed three errors within the same block. One point was attributed to each correct repetition. The subject's FDS score corresponded to the total number of sequences correctly repeated.
To be sure that our typically developing children did not suffer from reading difficulties, we assessed their decoding abilities considering both accuracy and speed in word and nonword reading (DDE-2, Sartori, Job & Tressoldi, Reference Sartori, Job and Tressoldi2007). As an inclusion criterion, none of the control children should score lower than 1.5 SD below the mean of their age-reference group in any of the four measures collected; conversely, each dyslexic child had to score lower than 2 SD under the mean of their reference group in at least two out of four measures.
Finally, we tested the subjects’ receptive vocabulary, by administering the PPVT-R by Dunn and Dunn (Reference Dunn and Dunn2000), adopting the Italian standardization by Stella, Pizzioli and Tressoldi (Reference Stella, Pizzioli and Tressoldi2000).
2.2.2. Nonword Repetition Task
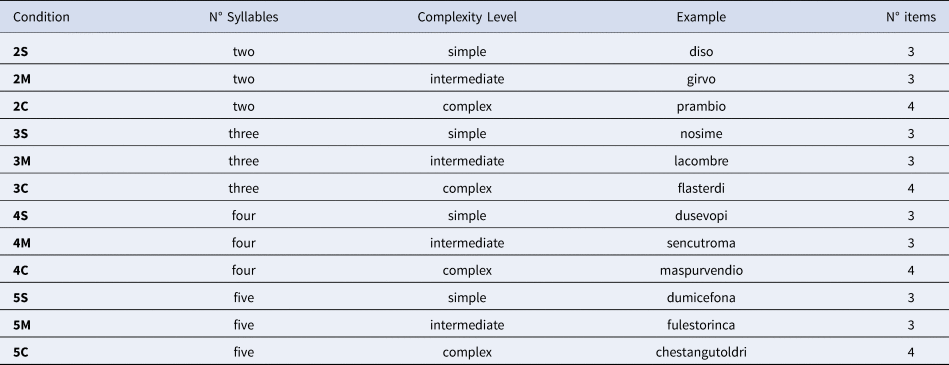
Both nonword length, intended as number of syllables, and complexity of the syllabic structure were manipulated, yielding 12 different conditions.
As for length, we included items ranging from two to five syllables: 10 disyllables, 10 trisyllables, 10 four-syllable nonwords and 10 five-syllable nonwords. These lengths have been chosen since they are representative of Italian language.
As for complexity, our nonwords were formed using CV, CVC, CCV, CVV, CCVC and CVVC syllables. To manipulate the complexity level of each nonword, we attributed to the items a complexity score, which was calculated as follows: 1 point was attributed to each CV syllable, 1.5 to each CVV syllable containing a diphthong, 2 points to each complex syllable composed by three phonemes (CVC, CCV), 2.5 points to syllables composed by four phonemes containing a diphthong (CVVC) and 3 points to each complex syllable composed by four phonemes (CCVC). Moreover, we added 1 point for sequences of three consonants across two separate syllables (e.g., CVC-CCV). The total score was then divided by the number of syllables of the nonword. The scores that we obtained with this procedure were comprised between 1 and 2.33; since all nonwords composed by CV syllables had a score of 1, we considered them as “Simple”. Nonwords whose score was comprised between 1.01 and 1.70 were considered “Intermediate”, whereas nonwords whose score was comprised between 1.71 and 2.33 were considered “Complex”. For instance, nosime is a three-syllable nonword composed by three CV syllables with a total score of 1 and thus it is considered as simple; lacombre is a three-syllable nonword with a CV + CVC + CCV structure and a total score of 1.67 and it is considered as intermediate; finally, flasterdi is a three-syllable nonword with a CCVC + CVC + CV structure and a score of 2, which is considered as complex. Following this procedure, we obtained 12 conditions, as schematized in Table 2.
Description and examples of each condition.

Each nonword was carefully designed in compliance with the phonotactic rules of Italian, assembling both high and low frequency type syllables taken from a database on Italian syllable frequency (Stella & Job, Reference Stella and Job2001). Following Dollaghan and Campbell (Reference Dollaghan and Campbell1998), no consonants or vowels occurred more than once within each nonword, in order to assure that each of the phonemes constituting the nonword was recalled independently. Moreover, none of the stimuli corresponded to an existing Italian lexical word. A wordlikeness effect could indeed determine a better recall of those items presenting some overlaps with the phonological structure of known words, since they could activate their lexical representation, thus providing an aid for successful repetition (Gathercole, Reference Gathercole1995).
Each nonword started with a consonant and ended with a vowel, a common feature of Italian words; moreover, primary stress was always assigned to the penultimate syllable, which is the most common stress pattern in Italian. As for four- and five-syllable nonwords, these items envisage further prosodic complexity as they are made of two trochaic feet, the lefthand one carrying secondary stress and the righthand one carrying primary stress: e.g., [dùse]f[vópi]f and [dùmice]f[fóna]f. These nonwords were invented in compliance with the standard prosodic structure of real Italian words (see Nespor & Bafile, Reference Nespor and Bafile2008 for an introduction).
The forty nonwords were presented randomized. A female native speaker of Italian recorded the list of nonwords which were administered to the children via loudspeakers. There were two training items, to allow the child to familiarize with the task, who was given the following instruction: “Now you will hear some made-up words. Try to repeat them exactly the way that you hear them”. Each nonword was presented only once. If necessary, the experimenter provided feedback for the training items, whereas no feedback was given for the experimental items.
As for the scoring method, we evaluated each repeated item as a whole, attributing 1 point to correct repetitions and no points for incorrect repetition, independently from the number of errors committed in each nonword. As indicated in the meta-analysis by Graf Estes, Evans and Else-Quest (Reference Graf Estes, Evans and Else-Quest2007), impaired children could be more penalized by the method reporting the percentage of phonemes correctly repeated. Deevy, Wisman Weil, Leonard and Goffman (Reference Deevy, Wisman Weil, Leonard and Goffman2010) and Dispaldro, Leonard and Deevy (Reference Dispaldro, Leonard and Deevy2013), who used both scoring methods, argue that the differences between impaired and unimpaired children in nonword repetition, as well as the diagnostic accuracy of the task, were comparable for the two scoring methods. The advantage of using a whole-word strategy is more evident in practical terms, since it does not require the professional to have sophisticated competence in phonology and phonetic transcription, especially when administering this task as a screening tool for the initial identification of nonword repetition deficits. In other words, there is no need to perform a sophisticated analysis of the sequence of sounds produced by the participants, in order to get a reliable measure of their repetition abilities.
2.3 Research questions and predictions
The present study was developed to provide an answer to some specific research questions; first, we aimed at verifying how bilingual children performed in a task assessing nonword repetition. Based on the literature reviewed above (section 1.2) and considering that Italian has a quite simple phonotactic system, we expected bilingual children to perform at the same level of their monolingual peers, independently from their L1, which was not expected to play a significant role. Second, we were interested in determining how dyslexic children performed in nonword repetition: based on the reported evidence (section 1.3), they were expected to display severe deficits with respect to unimpaired children. Third, we aimed at investigating the relationship between bilingualism and dyslexia in this domain.
Only a few studies have considered the relationship between these two dimensions and never in relation to nonword repetition. The limited evidence available suggests that bilingual and monolingual dyslexic children display similar morphosyntactic deficits, as in clitic production (Vender, Hu, Mantione, Delfitto & Melloni, Reference Vender, Hu, Mantione, Delfitto and Melloni2018), whereas bilingual dyslexics could even outperform their monolingual peers in tasks assessing morphological competence and requiring good metalinguistic skills, as in nonword pluralization (Vender, Hu, Mantione, Savazzi, Delfitto & Melloni, Reference Vender, Hu, Mantione, Savazzi, Delfitto and Melloni2018), and in tasks assessing their nonverbal implicit learning and executive functions (see Vender, Krivochen, Phillips, Saddy & Delfitto, Reference Vender, Krivochen, Phillips, Saddy and Delfitto2019, for a modified version of the Simon Task). Since no study has focused on the interaction between bilingualism and dyslexia in nonword repetition, providing an answer to this research question is certainly an important element of novelty of this paper. Based on these studies, and on the literature reviewed above about nonword repetition in bilingualism, no negative effects of bilingualism in dyslexia were expected.
Finally, we aimed at investigating whether nonword repetition can be added as a possible tool to integrate the diagnosis of dyslexia in both monolingual and bilingual children, thus reducing the rates of false positives and false negatives which, as discussed above (section 1.4), can be particularly high in the case of bilinguals.
3. Results
3.1 Preliminary Measures
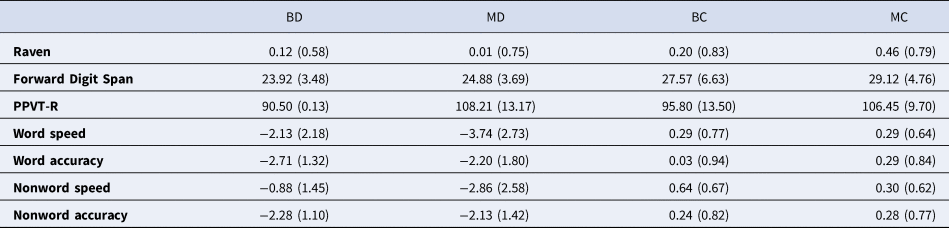
The results of the four groups in the preliminary measures are reported in Table 3.
Means (SDs) of z scores on the Raven and on the speed and accuracy of word and nonword reading, means (SDs) of raw scores of the PPVT-R, means (SDs) in the FDS task.

One-way ANOVAs with Group as fixed factor were carried out to compare the performance of the four groups of participants; if Group was significant, post-hoc comparisons with Bonferroni correction were run. No differences were reported in the CPM Raven task (F (3, 107) = 1.953, p = .125), ensuring cognitive homogeneity amongst the groups.
As for the FDS task, instead, Group was significant (F (3, 106) = 10.779, p < .001); BD performed similarly to MD (p = 1.000), but worse than both BC (p < .01) and MC (p < .001), and MD performed worse than MC (p < 01) and BC (p < .05). No differences were found between MC and BC (p = 1.000).
A significant difference was found also in the PPVT-R (F (3, 107) = 12.286, p < .001); BD underperformed MD and MC (all p < .001); similarly, BC performed worse than MC and MD (both p < .01). No differences were found between BD and BC (p = .717), or between MD and MC (p = 1.000). This is in line with what was reported by many studies (see section 1) evidencing the presence of vocabulary deficits in bilinguals. It is interesting to notice that these difficulties are not worse in dyslexics than in controls.
Finally, Group was significant in all reading measures: word speed (F (3, 107) = 36.193, p < .001), word accuracy (F (3, 107) = 41.862, p < .001), nonword speed (F (3, 107) = 30.975, p < .001) and nonword accuracy (F (3, 107) = 52.755, p < .001). Both MD and BD performed worse than BC and MC in word reading speed (all p < .001), but interestingly BD performed better than MD (p < .01), whereas no differences were found between MC and BC (p = 1.000). Similarly, in nonword reading speed MD performed worse than the other three groups (p < 001), while BD performed worse than BC (p < .01) and MC (p < 05), but better than MD (p < .001). As for both word and nonword reading accuracy, BD and MD performed similarly (respectively, p = .908 for word accuracy and p = 1.000 for nonword accuracy) and differently from MC and BC (all p < .001). Conversely, BC performed similarly to MC in all conditions (all p = 1.000). This suggests that BD, despite being more impaired than MC and BC in reading speed, showed less severe deficits in comparison to MD. Conversely, their performance was equally impaired in reading accuracy.
Summarizing, the results of the preliminary measures indicate that the two groups of dyslexics displayed significant deficits in all literacy measures and in the two tasks assessing working memory, whereas no differences were found in nonverbal intelligence. The resulting profile is consistent with the typical profile of children with dyslexia, as discussed above. A negative effect of bilingualism in vocabulary was instead found, in line with the literature reporting that bilinguals tend to display a less rich vocabulary than that of their monolingual peers. No differences were reported between monolinguals and bilinguals in working memory, which is not expected to be directly affected by bilingualism, nor in reading abilities, which, following August and Shanahan (Reference August and Shanahan2006), should reach the monolingual standards after two years of school attendance.
3.2. Nonword Repetition Task
The mean accuracy of the four groups in each of the 12 conditions is reported in Table 4.
Mean (in percentage) accuracy (SDs) of the four groups in the total task and in each condition of the Nonword Repetition Task.

To analyze the effects of dyslexia and bilingualism in nonword repetition, we ran a mixed design ANOVA with repeated measures, with Length (two, three, four, five syllables) and Complexity (simple, intermediate, complex) as within-subjects factors and Group as between-subjects factor. Post-hoc comparisons with Bonferroni correction were run to understand significant effects. We found a main effect of Group (F (1, 107) = 36.808, p <.001, partial η2 = .508); both groups of dyslexics performed worse than both groups of controls (all p < .001), while no differences were found between BD and MD (p = .351) or BC and MC (p = 1.000).
Considering the within-subjects factors variables, we found a main effect of Complexity (F (2, 214) = 127.938, p < .001, partial η2 = .545). Specifically, there were no differences between simple and intermediate nonwords (p = 1.000), which both differed significantly from complex nonwords (p < .001). Moreover, the absence of a Complexity × Group interaction (F (6, 214) = 1.613, p = .145, partial η2 = .043) indicates that all groups were similarly affected by complexity, experiencing more difficulties with complex nonwords than with simple and intermediate ones.
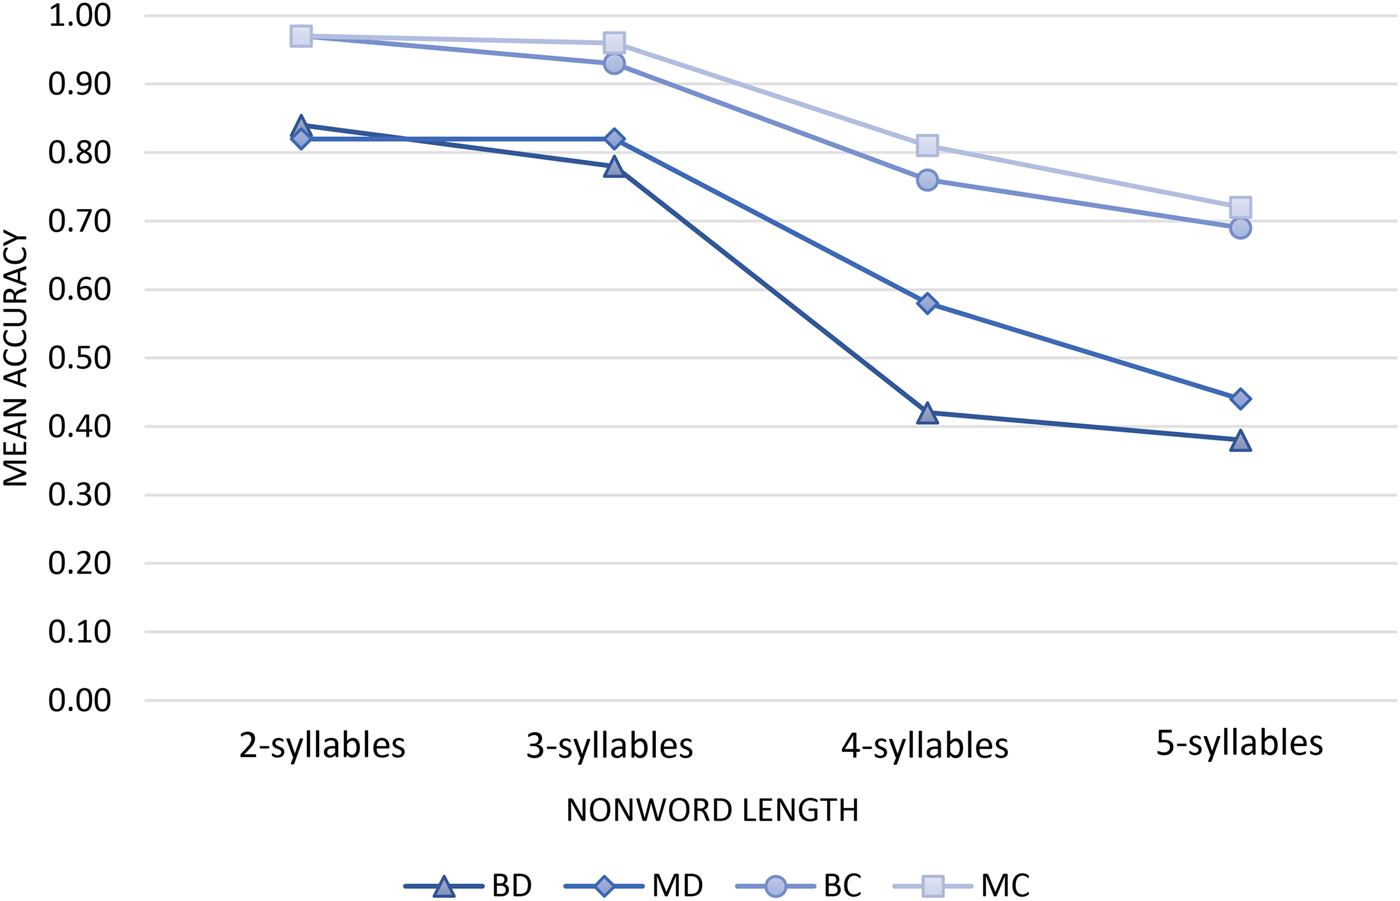
We also found a main effect of Length (F (2.247, 240.381) = 190.099, p < .001, partial η2 = .640): two-syllables did not differ from three-syllables (p = .107), whereas differences were found amongst all other lengths (all p < .001). The presence of a significant Length × Group interaction (F (6.740, 240.381) = 5.131 p < .001, partial η2 = .126) revealed that the number of syllables composing the stimuli had a different impact on performance in the four groups.
To better understand this interaction, we compared the performances of the four groups with each syllable length. Since there was no Complexity × Group interaction, we collapsed the mean accuracy of the three complexity levels and calculated the mean accuracy of each group across the nonword lengths, yielding 10 items for each length (see Table 5 for means and SDs and Figure 1 for a graph representing each group's performance).
Mean accuracy (percentage) at each length for all groups.

Mean (in percentage) accuracy (SDs) at each length for all groups.

Then, we ran a series of univariate ANOVAs with Group as fixed factor and each condition as a dependent variable; subsequently, we ran post-hoc comparison tests with Bonferroni correction to understand group differences.
With two-syllable nonwords, Group was significant (F (3, 107) = 18.923, p < .001 partial η2 = .347); BD performed similarly to MD (p = 1.000), and both groups performed worse than both BC and MC (all p < .001). BC and MC did not differ (p = 1.000). Similarly, Group was significant with three-syllables (F (3, 107) = 15.165, p < .001 partial η2 = .298); again, BD performed similarly to MD (p = 1.000), but worse than BC and MC (p < .001), and MD performed worse than BC and MC (respectively, p < .01 and p < .001). BC and MC did not differ (p = 1.000).
As for four-syllables, Group was significant (F (3, 107) = 21.487, p < .001 partial η2 = .347); in this case, BD underperformed MC and BC (p < .001) and also MD (p < .05), who in turn performed worse than both MC (p <.001) and BC (p < .01). Again, BC and MC showed a similar behavior (p = 1.000).
Finally, Group was significant in five-syllables (F (3, 107) = 23.544, p < .001 partial η2 = .398); MD and BD did not differ (p = 1.000) or MC and BC (p = 1.000), whereas both groups of dyslexics performed worse than both control groups (all p < .001).
3.3. Correlation and regression analyses
Performance in nonword repetition was positively correlated with the subjects’ FDS (r = .480, p < .001) and CPM Raven scores (r = .243, p < .01), whereas it was not related to PPVT-R (r = .166, p = .083) nor to age (r = .157, p = .099). Moreover, no correlations were found between accuracy and AoE (r = .138, p = .324), QoE (r = −.221, p = .112), TLE (r = .028, p = .112) and CLE (r = .014, p = .914), suggesting that the bilinguals’ performance was not related to their exposure to Italian, in line with our expectations.
Moreover, nonword repetition accuracy was highly correlated with all reading measures: word reading speed (r = .453, p < .001), word reading accuracy (r = .659, p < .001), nonword reading speed (r = .344, p < .001) and nonword reading accuracy (r = .689, p < .001).
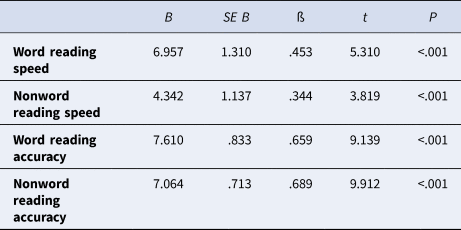
Four simple linear regressions were calculated to predict reading skills based on mean nonword repetition accuracy, as reported in Table 6.
Summary of linear regression analyses predicting reading outcomes based on nonword repetition.

Nonword repetition turns out to be a relevant predictor for all reading measures, especially for accuracy: the model containing mean accuracy only is able to explain 20.5% of the variance in word reading speed, 11.8% in nonword reading speed, 43.4% in word reading accuracy and 47.7% in nonword reading accuracy.
A significant regression equation was found for all reading variables: word reading speed (F (1, 109) = 28.191, p < .001) with an R2 of .205, nonword reading speed (F (1, 109) = 14.585, p < .001) with an R2 of .118, word reading accuracy (F (1, 109) = 83.525, p < .001) with an R2 of .434, and nonword reading accuracy (F (1, 109) = 98.241, p < .001) with an R2 of .474.
3.4. Specificity, Sensitivity and Likelihood Ratio
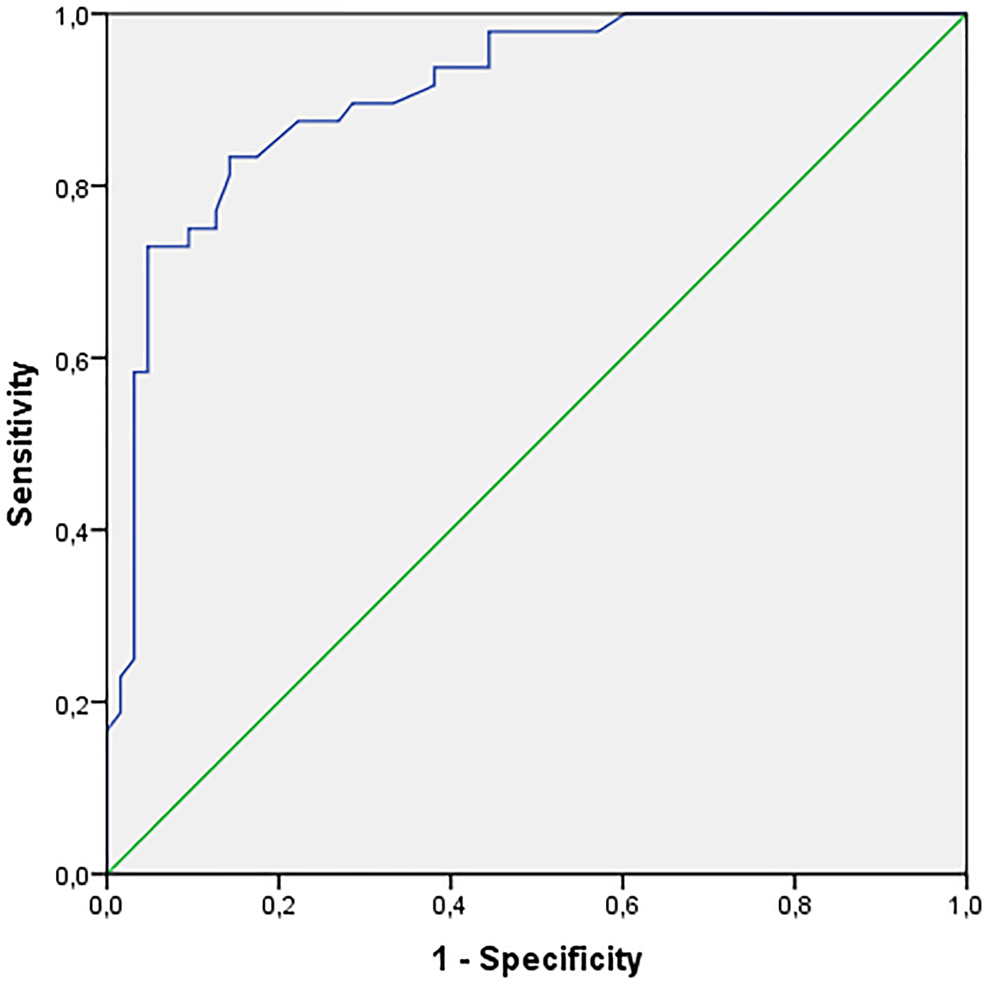
We further assessed sensitivity and specificity values of the nonword repetition task (mean accuracy rate) considering monolingual and bilingual children together. To identify the optimal cut-off value, we performed a receiver operating characteristic (ROC) curve analysis, which is reported in Figure 2 (Metz, Reference Metz1978; Zweig & Campbell, Reference Zweig and Campbell1993).
ROC curve associated to dyslexic/typically developing children's discrimination at nonword repetition.

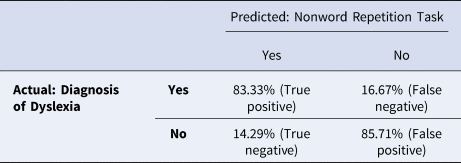
The Area under the ROC curve is .908 (SE = .028, p < .0001, 95% Confidence Interval = .853 − .962), indicating excellent diagnostic value for our nonword repetition task (Ray, Le Manach, Riou & Houle, Reference Ray, Le Manach, Riou and Houle2010). We calculated the Youden Index (J = max (sensitivity + specificity −1)), which identifies the optimal cut-off point in the ROC curve as ≤.76. Using this cut-off point, we assessed the specificity, sensitivity and likelihood ratio values (Table 7; see also Table 8 for a confusion matrix reporting rates of true positives, true negatives, false positives and false negatives).
Sensitivity and specificity values, positive and negative likelihood ratios associated to the 0.76 cut-off point.

Confusion Matrix displaying percentages of true positives, true negatives, false positives and false negatives predicted by performance in the Nonword Repetition Task on the basis of the official diagnosis of dyslexia.

Being the +LR value higher than 5 and the −LR lower than 0.20, our nonword repetition task has a good diagnostic value and the cut-off score can be considered as clinically informative for identifying dyslexia in both monolingual and bilingual children (Ray et al. Reference Ray, Le Manach, Riou and Houle2010).
4. Discussion
The aim of our research was that of comparing monolingual and bilingual children, with and without dyslexia, in nonword repetition, in order to assess the effects of dyslexia and bilingualism in this task. Moreover, we aimed at verifying whether nonword repetition could provide a useful measure to integrate reading tasks in ruling in or out reading impairments in both monolinguals and bilinguals. As evidenced by the preliminary measures we administered, both groups of bilingual children displayed a poorer receptive vocabulary than their monolingual peers: proposing a nonword repetition task, which crucially does not depend on lexical knowledge, presents the important advantage of allowing to compare bilingual and monolingual children without the former being penalized by their vocabulary deficits.
With this purpose, we developed a task manipulating both complexity and length of nonwords, including two- to five-syllable nonwords with three levels of complexity (simple, intermediate and complex) and administered it to monolingual and bilingual dyslexics and unimpaired children.
Our results confirmed the presence of a nonword repetition deficit in dyslexics, irrespective of bilingualism: both groups of impaired children, indeed, performed consistently worse than age-matched controls, even with the shortest and simplest nonwords. Conversely, no differences were found between monolingual and bilingual unimpaired children, suggesting that nonword repetition is not impaired in bilingualism, at least when the L2 has a relatively simple phonotactic structure, like Italian, in accordance with the studies reviewed in section 1.2, which report target performance in nonword repetition for bilinguals.
The complexity of our stimuli affected similarly the four groups (as testified by the absence of a significant Complexity × Group interaction), with complex items being significantly more difficult than both simple and intermediate ones. Conversely, groups were differently affected by the increase in length of the nonwords. Comparing the subjects’ performances with two-, three-, four- and five-syllable lengths, we found that dyslexics performed always worse than unimpaired children, and that, while bilingual and monolingual controls consistently showed a similar performance, bilingual dyslexics performed worse than monolingual dyslexics only with four-syllable nonwords. This could be explained by arguing that bilingual dyslexics are more negatively affected by the increase in length from three- to four-syllables than monolinguals. Indeed, the two groups of dyslexics showed a similar performance with five-syllable nonwords. However, a sharp contrast between three- and four-syllable nonwords was reported for all groups, indicating that length alone is not able to explain the reported decrease in performance with four-syllable items. In this respect, we should consider that, besides an increase in length, four-syllable nonwords are composed by two trochaic feet, giving rise to a greater prosodic complexity than two- and three-syllable nonwords. With four- (and five-) syllable items, the subject has to create an acoustic representation of a novel word containing two stressed syllables and has to keep it in memory for successive articulation. Therefore, prosodic reasons could explain the difficulties in this condition for all groups and could also account for the remarkably poor performance of bilingual dyslexics, who are more impaired than monolingual dyslexics with respect to increasing prosodic complexity, though less impaired in terms of increasing length (see their similar performance with items of four and five syllables, featuring a similar prosodic structure). Overall, it seems that bilingual dyslexics are more affected by the strictly linguistic/phonological facets of the task than it is the case for monolingual dyslexics (arguably pointing to weaker phonological skills); the latter are instead more markedly affected by variations in length (arguably related to phonological memory skills).
Correlation and regression analyses confirmed that nonword repetition is a significant predictor of reading abilities, especially for accuracy, but also for speed, in both word and nonword reading. Moreover, the absence of significant correlations between vocabulary and exposure factors and nonword repetition suggests that variables like language abilities, age of first exposure, as well as quantity and length of exposure, do not affect performance, rendering it an ideal task for the assessment of bilingual children with different exposure backgrounds and competence levels in the L2.
Once ascertained that dyslexics, irrespective of bilingualism, showed a poorer performance in nonword repetition in comparison to controls, we aimed at evaluating whether their performance in this task could provide a reliable index to assist in the diagnostic procedure, increasing the reliability of the procedure and diminishing the risk for missed and mistaken identities which is especially high with bilingual children. Indeed, the cut-off point of <.76 yielded likelihood ratios that were significantly consonant with the independent clinical judgments which led to the diagnosis of dyslexia, suggesting that the task could be used to assist in the diagnostic procedure for the identification of dyslexia in both monolingual and bilingual children.
As discussed in the introduction, this could be particularly useful for bilingual children, especially those with a lower competence and exposure to Italian, who might struggle in comparison to monolinguals in the acquisition of literacy skills and, due to the absence of diagnostic measures designed for bilinguals, could be penalized in the assessment procedure, resulting in overdiagnosis of dyslexia. Adding a nonword repetition task to the commonly used diagnostic tests assessing reading abilities could thus be useful in discriminating bilingual children whose poor literacy skills are due to the presence of a learning disability, from those whose difficulties are more likely related to other independent factors.
5. Conclusion
In this study we confirmed that nonword repetition is dramatically impaired in both monolingual and bilingual dyslexic children. A negative effect of bilingualism in dyslexia was observed only with four-syllable items, arguably related to their prosodic complexity. Conversely, no differences were found amongst the two groups of controls, confirming that bilingualism does not hamper nonword repetition, at least when the target language has a relatively simple phonotactic system, as in the case of Italian.
Moreover, we showed that nonword repetition can be a potentially good diagnostic tool to assist in the identification of dyslexia. This could be particularly useful for the assessment of reading disorders in bilingual children, who may struggle in the acquisition of literacy due to their immature competence in the L2 and could therefore be inappropriately diagnosed as dyslexic without suffering from a specific impairment.
One possible shortcoming of this study concerns the selection of the bilingual dyslexic children: as discussed in the introduction, there is a risk of overestimating dyslexia in bilinguals, due to the absence of thresholds specifically standardized for bilinguals; this risk holds also for the children who took part in our experiment. However, we should emphasize that our dyslexic children had been independently and carefully diagnosed as dyslexic by a team of health professionals (neuropsychiatrists, psychologists and speech therapists) who were aware of this complicating factor. Moreover, we re-assessed the reading abilities of all children, classifying as dyslexics only those children who scored lower than -2 SD below the mean for their age. Finally, as evidenced by August and Shanahan (Reference August and Shanahan2006), reading delays or difficulties might be found in typically developing children in their first stages of literacy exposure, and should disappear after 2 years of regular practice. For this reason, we decided to test only children with at least 3 years of consecutive school attendance in Italy, and at least 5 years of exposure to their L2. Crucially, age of first exposure to Italian, as well as quantity and length of exposure were taken into account, and, importantly, they were balanced between typically developing and dyslexic children.
Another potential shortcoming of this study lies in the heterogeneity of the mother languages spoken by the bilinguals: one could indeed argue that the performance of the L2 participants could have been affected by the distance in terms of phonotactic complexity between their L1 and Italian L2. However, as we emphasized in section 1.2, it is the phonotactic complexity of the language in which the task is administered that can affect performance, and not the other way around. Given that Italian has a simple phonotactic system, as argued in the introduction, target performance is easily achieved independently from the phonotactics of the L1 spoken by the children and from the distance between L1 and L2; this has been confirmed by the good, target-like performance of the unimpaired bilinguals in our task, and consistently with the results of independent studies conducted on Italian and reviewed above, which reveal similar performance for unimpaired bilinguals speaking different languages (Albanian, Arabic, and Romanian have been tested so far) in different nonword repetition tasks, also including, crucially, the task used in the present study (see Vender & Melloni, Reference Vender and Mellonisubmitted). Although comparing two groups of bilingual dyslexic children speaking two mother languages with different levels of phonotactic complexity would certainly not be devoid of interest, we believe that the results of the present study provide a first serious indication of the reliability of nonword repetition as a possible tool to assist in the identification of dyslexia in both monolingual and bilingual children. Finally, we would like to emphasize that this task emerges as a good predictor which could be reliably employed independently from the L1 spoken by the children, at least if the target language has a simple phonotactics like Italian. This provides an evident practical advantage, since in many multilingual countries where the majority language lives alongside with many minority languages, the task could be deployed as an effective tool for the identification of reading disorders which is relatively independent from the L1.
Acknowledgments
The research leading to these results has received funding from the European Union's Seventh Framework Programme for research, technological development and demonstration under grant agreement n° 613465. We sincerely thank Birgit Alber, Andrea Ceschi and Silvia Savazzi for fruitful discussions and helpful suggestions. Our gratitude goes also to all the children who took part to this research and to their families, to the Azienda Provinciale per i Servizi Sanitari-Neuropsichiatria Infantile (Trento), and to the schools and teachers who helped in recruiting the subjects [Istituti Comprensivi Bassa Anaunia, Cles, Revò, Taio, Tuenno (TN), Scuola Primaria A. Massalongo (VR)].
Author contributions
MV conceived the project with support of CM and DD. MV designed the experiment, collected the data, ran the statistical analysis and wrote the paper. MV and CM interpreted the results with support of DD. All authors revised the work critically for important intellectual content and gave the final approval of the version to be published.