1. Introduction
The Middle and Upper Triassic units in the Dolomites, Carnic Alps and Julian Alps (northeastern Italy) include a unique suite of magmatic products, from basalts, gabbroic rocks and lamprophyres to rhyolites, tuffs and minor granitoids. These products could potentially belong to a wider magmatic province, which crops out over a large area in the European Southern and Eastern Alps (Fig. 1) and possibly even in Calabria, Sardinia, northern Apennines and Dinarides (Beccaluva et al. Reference Beccaluva, Coltorti, Saccani, Siena, Zeda and Finetti2005). This magmatism has been associated either to compressional, extensional and/or transtensional geodynamics (e.g. Crisci et al. Reference Crisci, Ferrara, Mazzuoli and Rossi1984; Castellarin et al. Reference Castellarin, Lucchini, Rossi, Selli and Simboli1988; Sloman, Reference Sloman1989; Bonadiman et al. Reference Bonadiman, Coltorti and Siena1994; Stampfli et al. Reference Stampfli, Borel, Marchant, Mosar, Rosenbaum and Lister2002; Armienti et al. Reference Armienti, Corazzato, Groppelli, Natoli and Pasquare2003; Csontos & Vörös, Reference Csontos and Vörös2004; Beccaluva et al. Reference Beccaluva, Coltorti, Saccani, Siena, Zeda and Finetti2005; Doglioni & Carminati, Reference Doglioni and Carminati2008; Schmid et al. Reference Schmid, Bernoulli, Fügenschuh, Matenco, Schefer, Schuster, Tischler and Ustaszewski2008; Zanetti et al. Reference Zanetti, Mazzucchelli, Sinigoi, Giovanardi, Peressini and Fanning2013; Abbas et al. Reference Abbas, Michail, Cifelli, Mattei, Gianolla, Lustrino and Carminati2018; Bianchini et al. Reference Bianchini, Natali, Shibata and Yoshikawa2018; Casetta et al. Reference Casetta, Coltorti and Marocchino2018 b; Storck et al. Reference Storck, Brack, Worzlaw and Ulmer2019). Such contrasting interpretations are probably due to (1) the palaeogeographic position of the outcrops (at the edge between Gondwana and Laurasia), for which palinspastic reconstructions are still debated (e.g. Sengör, Reference Sengör1984; Kozur, Reference Kozur1991; von Raumer, Reference von Raumer1998; Ziegler & Stampfli, Reference Ziegler and Stampfli2001; Nikishin et al. Reference Nikishin, Ziegler, Abbott, Brunet and Cloetingh2002; Stampfli & Borel, Reference Stampfli and Borel2002; Csontos & Vörös, Reference Csontos and Vörös2004; Golonka, Reference Golonka2004; Bortolotti & Principi, Reference Bortolotti and Principi2005; Muttoni et al. Reference Muttoni, Gaetani, Kent, Sciunnach, Angiolini, Berra, Garzanti, Mattei and Zanchi2009; Schettino & Turco, Reference Schettino and Turco2011), and (2) the apparent contrast between the extensional to transcurrent tectonics (e.g. Doglioni, Reference Doglioni1987; Vai, Reference Vai1991; Gianolla et al. Reference Gianolla, De Zanche and Mietto1998; Bortolotti & Principi, Reference Bortolotti and Principi2005; Beltrando et al. Reference Beltrando, Stockli, Decarlis and Manatschal2015) and the apparent orogenic geochemical fingerprints of many of the magmatic products studied so far (e.g. De Vecchi & Sedea, Reference De Vecchi and Sedea1983; Castellarin et al. Reference Castellarin, Lucchini, Rossi, Selli and Simboli1988; Sloman, Reference Sloman1989; Gasparotto & Simboli, Reference Gasparotto and Simboli1991; Bonadiman et al. Reference Bonadiman, Coltorti and Siena1994; Armienti et al. Reference Armienti, Corazzato, Groppelli, Natoli and Pasquare2003; Casetta et al. Reference Casetta, Coltorti and Marocchino2018 b; Lustrino et al. Reference Lustrino, Abbas, Agostini, Caggiati, Carminati and Gianolla2019). What gained the interest of the geological community is the fact that this magmatism took place shortly before the break-up of Pangea, in a lithosphere that was previously affected by the Variscan collision and possibly by even older orogenic events. This makes the Triassic magmatism in the Southern Alps an attractive case study that can help to understand lithospheric processes in complex geodynamic settings.
Geological sketch map of the Southern Alps (modified after Schmid et al. Reference Schmid, Fügenschuh, Kissling and Schuster2004) and known locations of Triassic igneous rocks and volcaniclastics (after De Vecchi & Sedea, Reference De Vecchi and Sedea1983; Castellarin et al. Reference Castellarin, Lucchini, Rossi, Selli and Simboli1988; Armienti et al. Reference Armienti, Corazzato, Groppelli, Natoli and Pasquare2003; Furrer et al. Reference Furrer, Shaltegger, Ovtchanova and Meiste2008; Zanetti et al. Reference Zanetti, Mazzucchelli, Sinigoi, Giovanardi, Peressini and Fanning2013; Beltràn-Triviño et al. Reference Beltràn-Triviño, Winkler, Von Quadt and Gallofer2016). The location of the exposed lower crust of the Ivrea–Verbano (Handy et al. Reference Handy, Franz, Heller, Janott and Zurbriggen1999), Variscan Ulten peridotites (Tumiati et al. Reference Tumiati, Thöni, Nimis, Martin and Mair2003) and main Permian magmatic outcrops (Rottura et al. Reference Rottura, Bargossi, Caggianelli, Del Moro, Visonà and Tranne1998; Schaltegger & Brack, Reference Schaltegger and Brack2007) in the Southern Alps are also shown.

Geochemical and petrographic data about this magmatism have increased over the last decades (e.g. Sloman, Reference Sloman1989; Bonadiman et al. Reference Bonadiman, Coltorti and Siena1994; Cassinis et al. Reference Cassinis, Cortesogno, Gaggero, Perotti and Buzzi2008; Miller et al. Reference Miller, Thöni, Goessler and Tessadri2011; Beltràn-Triviño et al. Reference Beltràn-Triviño, Winkler, Von Quadt and Gallofer2016; Bianchini et al. Reference Bianchini, Natali, Shibata and Yoshikawa2018; Casetta et al. Reference Casetta, Coltorti, Ickert, Bonadiman, Giacomoni and Ntaflos2018 a, b, 2019; Lustrino et al. Reference Lustrino, Abbas, Agostini, Caggiati, Carminati and Gianolla2019). However, a clear picture of its geodynamic context is hindered by the widespread hydrothermal alteration of the outcrops, the complex palaeogeography and the lack of a comprehensive review of the geology of this area. The aim of this work is to address some of these problems. We present new major- and trace-element and Sr–Nd–Pb isotopic data on carefully sampled and selected Triassic magmatic rocks from the eastern Southern Alps, and combine these with existing data from the neighbouring areas. These data are placed in a broader context by summarizing the main geological events that occurred in the neighbouring areas of the Pangea super-continent since its formation during the Variscan Orogeny and until its early break-up phases during Late Triassic time.
2. Geological outline
2.a. Palaeogeography and geodynamics of Adria
The Southern Alps in central Europe are a structural domain delimited by the Periadriatic line to the north and west, by the Po and Venetian–Friulian plains to the south and by the Slovenian Karst plateau to the east. During late Palaeozoic – early Mesozoic time, the Southern Alps were part of the northern margin of the Adria Plate (in this work referred to as Adria, as defined by Schmid et al. Reference Schmid, Bernoulli, Fügenschuh, Matenco, Schefer, Schuster, Tischler and Ustaszewski2008). Other units belonging or located close to Adria were Alcapa (a tectonic mega-unit including the Eastern Alps, West Carpathians and the Transdanubian ranges north of Lake Balaton; Csontos & Vörös, Reference Csontos and Vörös2004), the external Dinarides, Apennines and the Apulian carbonate platform (Schmid et al. Reference Schmid, Bernoulli, Fügenschuh, Matenco, Schefer, Schuster, Tischler and Ustaszewski2008). The Palaeozoic and Mesozoic geodynamics and palaeogeography of Adria and its constituent units are still being debated. Here we summarize the main aspects that are relevant to the discussion on Triassic magmatism in the Southern Alps and the possible fingerprints of its geochemistry.
According to von Raumer (Reference von Raumer1998), during late Precambrian – early Palaeozoic time, the basement units of the Alps were part of a volcanic arc at the northern margin of Gondwana. After a stage dominated by rifting during Cambrian–Ordovician to Silurian time, the Gondwana–Laurasia collision produced a large orogenic belt that ranged from the Caucasus to the east, to the southern Appalachians and Ouachitas in North America to the west. The result of this collision in western Europe, which had its peak at the end of the Carboniferous period, is the Variscan Belt. The fingerprints of this event in the lithosphere of Adria, such as metamorphism and crustal melting, are still preserved today in the Austroalpine and South Alpine units (von Raumer, Reference von Raumer1998). In the Southern Alps, they are also evident in the lower crustal portion of the Ivrea–Verbano exposed crustal section (Handy et al. Reference Handy, Franz, Heller, Janott and Zurbriggen1999).
During the Permian period, the suture zone between Gondwana and Laurasia reactivated as a large right-lateral E–W-aligned shear zone (intra-Pangea dextral shear; IPDS; Muttoni et al. Reference Muttoni, Gaetani, Kent, Sciunnach, Angiolini, Berra, Garzanti, Mattei and Zanchi2009) involving the eastern coast of North America, the northern part of South America, northwestern Africa and the northern margin of Adria. In the same period, an extensional system developed from Siberia to western Europe, propagating southwards and superimposing the IPDS (Nikishin et al. Reference Nikishin, Ziegler, Abbott, Brunet and Cloetingh2002). Associated with this system, significant magmatic activity occurred at the margin between Gondwana and Laurasia (e.g. Lago et al. Reference Lago, Arranz, Pocovì, Galè and Gil-Imaz2004). At the northern margins of Adria, this activity is recorded by the Sesia magmatic system in the Ivrea–Verbano crustal section (Quick et al. Reference Quick, Sinigoi, Peressini, Demarchi, Wooden and Sbisà2009) and by volcanics and granitoid intrusions in the western and central Southern Alps (e.g. Rottura et al. Reference Rottura, Bargossi, Caggianelli, Del Moro, Visonà and Tranne1998; Schaltegger & Brack, Reference Schaltegger and Brack2007; Cassinis et al. Reference Cassinis, Cortesogno, Gaggero, Perotti and Buzzi2008; Bellieni et al. Reference Bellieni, Fioretti, Marzoli and Visonà2010), but no evidence of Permian magmatism is preserved in the Carnic and Julian Alps (Fig. 1). Contemporarily with the transtensional and extensional tectonics in western Europe, the Palaeotethys ocean subducted more to the east beneath the Euroasiatic margin (e.g. Stampfli et al. Reference Stampfli, Borel, Marchant, Mosar, Rosenbaum and Lister2002; Muttoni et al. Reference Muttoni, Gaetani, Kent, Sciunnach, Angiolini, Berra, Garzanti, Mattei and Zanchi2009).
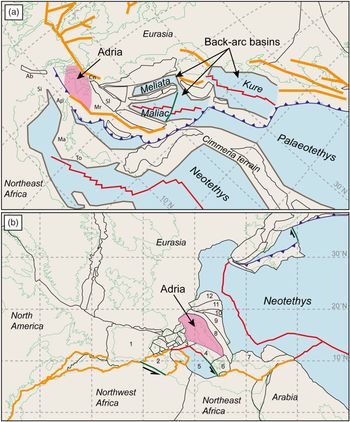
The transtensional and extensional events in western Europe and the subduction of Palaeotethys on the east continued during the Triassic period, but the precise palaeogeographic position of Adria in this geodynamic framework is still being debated (Fig. 2). On the regional scale, the northern part of Adria was affected by Triassic extensional and strike-slip tectonics, with the formation of multiple carbonate platforms and basins (e.g. Doglioni, Reference Doglioni1987; Vai, Reference Vai1991; Gianolla et al. Reference Gianolla, De Zanche and Mietto1998; Bortolotti & Principi, Reference Bortolotti and Principi2005; Beltrando et al. Reference Beltrando, Stockli, Decarlis and Manatschal2015). In this context, intense magmatic activity took place during the Triassic period in an area that today ranges from Alpine Corsica, the Southern Alps, Alcapa and Dinarides (e.g. Pamić, Reference Pamić1984; Castellarin et al. Reference Castellarin, Lucchini, Rossi, Selli and Simboli1988; Visonà & Zanferrari, Reference Visonà and Zanferrari2000; Beccaluva et al. Reference Beccaluva, Coltorti, Saccani, Siena, Zeda and Finetti2005). Geochemical studies show that many of the Triassic magmatic rocks show an orogenic affinity and, as mentioned in the introduction, the geodynamic framework in which they originated is still being debated. Since there is no evidence of a magmatic arc (i.e. crustal metamorphism, ophiolites, predominant compressional tectonics) affecting the Adria Plate during the Triassic period, two possible geodynamic settings in which this magmatism took place have been suggested in recent years: a back-arc setting and aborted rifting associated with the opening of the Alpine Tethys.
Palaeogeography of Adria and western Tethys at 230 Ma based on (a) Stampfli (Reference Stampfli and Finett2005) and (b) Schettino & Turco (Reference Schettino and Turco2011). Coloured lines are present-day coastlines (light green), unit boundaries (black), rifts (orange), spreading ridges (red), subduction zones (blue), passive margins (brown, shown only by Stampfli, Reference Stampfli and Finett2005) and transform faults (dark green). Unit names in (a): Ab – Alboran; Ap – Apulia; Cn – Carnic–Julian; Ma – Mani; Mr – Mrzlevodice fore-arc; Si – Sicanian; Sl – Slavonia; To – Talea Ori. Unit names in (b): 1 – Iberia; 2 – Tunisia; 3 – Panormide platform; 4 – Apulia; 5 – Ionian Basin; 6 – southern Greece; 7 – Menderes-Taurides platform; 8 – Eastern Dinaride platform; 9 – Eastern Dinaride accretionary wedge; 10 – southern Pannonian Basin; 11 – Tisza; 12 – Pelso. Projection and rotation of the maps have been kept as per the originals (Stampfli, Reference Stampfli and Finett2005; Schettino & Turco, Reference Schettino and Turco2011).

2.a.1. Back-arc setting
Ziegler & Stampfli (Reference Ziegler and Stampfli2001), Stampfli et al. (Reference Stampfli, Borel, Marchant, Mosar, Rosenbaum and Lister2002), Csontos & Vörös (Reference Csontos and Vörös2004) and Golonka et al. (Reference Golonka2004) suggested that, during the Triassic period, the western end of the subduction of the Palaeotethys was located just SW of Adria (Fig. 2a). Based on their model, Adria had been separated from Gondwana since the Permian period. The subduction rollback created several oceanic ridges, generally considered to be aligned in a NW–SE direction, that is, Meliata, Maliac and Pindos (Stampfli et al. Reference Stampfli, Borel, Marchant, Mosar, Rosenbaum and Lister2002) or Vardar and Pindos (Csontos & Vörös, Reference Csontos and Vörös2004). According to these authors, the Triassic extensional tectonics in the Southern Alps would be related to the opening of either the Meliata or Vardar back-arc basins. Armienti et al. (Reference Armienti, Corazzato, Groppelli, Natoli and Pasquare2003) and Zanetti et al. (Reference Zanetti, Mazzucchelli, Sinigoi, Giovanardi, Peressini and Fanning2013) suggest a similar scenario as a possible setting for the magmatic episode that affected the northern margin of Adria. Another model comes from Doglioni & Carminati (Reference Doglioni and Carminati2008), who suggested a possible W-wards subduction during late Permian or Early Triassic time. This subduction might have retreated towards the east (Slovenia, Hungary) to form a back-arc basin, which might have been the trigger for the Carnian magmatism in the Southern Alps. The relic of this system is suggested now to be below the Pannonian Basin (Doglioni & Carminati, Reference Doglioni and Carminati2008).
2.a.2. Aborted rifting associated with the opening of the Alpine Tethys
A second group of authors (Bortolotti & Principi, Reference Bortolotti and Principi2005; Schmid et al. Reference Schmid, Bernoulli, Fügenschuh, Matenco, Schefer, Schuster, Tischler and Ustaszewski2008; Muttoni et al. Reference Muttoni, Gaetani, Kent, Sciunnach, Angiolini, Berra, Garzanti, Mattei and Zanchi2009; Schettino & Turco, Reference Schettino and Turco2011) suggested that the Adria Plate was far from the western end of the subduction of the Palaeotethys (e.g. Fig. 2b) and that the only active geodynamics around the Adria Plate during the Triassic period was extensional or transtensional. In their reconstructed palaeogeography, Bortolotti & Principi (Reference Bortolotti and Principi2005) and Schmid et al. (Reference Schmid, Bernoulli, Fügenschuh, Matenco, Schefer, Schuster, Tischler and Ustaszewski2008) suggested that the northern passive margin of Adria faced the western sector of the Neotethys, while Schettino & Turco (Reference Schettino and Turco2011) show that the Dinaric and Pannonian units separated Adria from this oceanic realm (Fig. 2b). Bortolotti & Principi (Reference Bortolotti and Principi2005) and Schettino & Turco (Reference Schettino and Turco2011) suggested that the extensional and/or transtensional tectonics were associated with the early rifting stages of the Alpine Tethys, which opened later in the Jurassic period. Schettino & Turco (Reference Schettino and Turco2011) provided the most detailed scenario, in which rifting began during Late Triassic and Early Jurassic times at the western, northern and eastern margins of the Adria Plate, but culminated with an oceanic spreading centre only at the western margin. The geodynamic models for the origin of Triassic magmatism suggested by Sloman (Reference Sloman1989), Beccaluva et al. (Reference Beccaluva, Coltorti, Saccani, Siena, Zeda and Finetti2005) and Beltràn-Triviño et al. (Reference Beltràn-Triviño, Winkler, Von Quadt and Gallofer2016) are consistent with this scenario.
2.b. Triassic magmatism in the Southern Alps and western Alcapa
Triassic igneous and volcanoclastic rocks crop out at several localities over the entire area of the Southern Alps and in some areas of the northeastern Alps (Fig. 1). In the westernmost Southern Alps, magmatic products are mainly represented by some lithologies of the Finero complex, Ivrea–Verbano zone (e.g. Siena & Coltorti, Reference Siena and Coltorti1989; Zanetti et al. Reference Zanetti, Mazzucchelli, Sinigoi, Giovanardi, Peressini and Fanning2013). The Finero complex is an exposed section of lower continental crust composed of phlogopite-bearing peridotites at the core, surrounded by a layered pluton referred to as the ‘Finero mafic complex’ by Zanetti et al. (Reference Zanetti, Mazzucchelli, Sinigoi, Giovanardi, Peressini and Fanning2013). Zircon U–Pb ages and Sm–Nd isochron ages record an intricate thermal and magmatic history for this complex, spanning Permian–Jurassic time (e.g. Lu et al. Reference Lu, Hofmann, Mazzucchelli and Rivalenti1997 a; Stähle et al. Reference Stähle, Frenzel, Hess, Saupe, Schmidt and Schneider2001; Zanetti et al. Reference Zanetti, Mazzucchelli, Sinigoi, Giovanardi, Peressini and Fanning2013; Langone et al. Reference Langone, Padrón-Navarta José, Ji, Zanetti, Mazzucchelli, Tiepolo, Giovanardi and Bonazzi2017). However, at least part of this complex records a Late Triassic intrusion age (232 ± 3 Ma; Zanetti et al. Reference Zanetti, Mazzucchelli, Sinigoi, Giovanardi, Peressini and Fanning2013) and several alkaline pegmatitic dykes show U–Pb zircon ages in the range 239–208 Ma (see review in Zanetti et al. Reference Zanetti, Mazzucchelli, Sinigoi, Giovanardi, Peressini and Fanning2013).
In the area between Lake Maggiore and Lake Garda, Triassic magmatism mainly crops out as pyroclastic products, lava flows and subvolcanic rocks, which are interbedded with carbonate sequences and continental terrigenous or transitional deposits of Anisian – early Carnian age (e.g. Crisci et al. Reference Crisci, Ferrara, Mazzuoli and Rossi1984; Cassinis et al. Reference Cassinis, Cortesogno, Gaggero, Perotti and Buzzi2008; Beltràn-Triviño et al. Reference Beltràn-Triviño, Winkler, Von Quadt and Gallofer2016). Zircon U–Pb ages of the pyroclastic layers, which also crop out north of the Periadriatic Line (Furrer et al. Reference Furrer, Shaltegger, Ovtchanova and Meiste2008), show a peak activity at c. 245–235 Ma (Beltràn-Triviño et al. Reference Beltràn-Triviño, Winkler, Von Quadt and Gallofer2016; Storck et al. Reference Storck, Brack, Worzlaw and Ulmer2019). Age data for the lava flows and minor associated sills and dykes cropping out north of Brescia (Fig. 1) are limited to two Rb–Sr ages (231 ± 5 and 226 ± 4 Ma) for two dacitic rocks with calc-alkaline affinity (Cassinis & Zezza, Reference Cassinis, Zezza, Castellarin and Vai1982; Cassinis et al. Reference Cassinis, Cortesogno, Gaggero, Perotti and Buzzi2008) and to one Ar/Ar age for a basaltic dyke with tholeiitic affinity (217 ± 3 Ma; Cassinis et al. Reference Cassinis, Cortesogno, Gaggero, Perotti and Buzzi2008). Just east of Lake Garda in the area of Recoaro (north of Verona; Fig. 1) there are rhyolites to dacites and minor basaltic lava flows and small intrusives with shoshonitic affinity (De Vecchi & Sedea, Reference De Vecchi and Sedea1983; Bellieni et al. Reference Bellieni, Fioretti, Marzoli and Visonà2010; Lustrino et al. Reference Lustrino, Abbas, Agostini, Caggiati, Carminati and Gianolla2019). They lie on the pelagic units of the Nodosus Formation, which have been assigned a late Ladinian age by De Vecchi & Sedea (Reference De Vecchi and Sedea1983). No published isotopic age data are available for these outcrops.
Further east, the area of the Dolomites includes well-exposed intermediate to acid intrusions (Mount Monzoni and Predazzo intrusive complexes), pyroclastic layers, basaltic lava flows, numerous basaltic dykes and sills with shoshonitic affinity, and lamprophyric dykes, often including mantle xenoliths (e.g. Sloman, Reference Sloman1989; Gasparotto & Simboli, Reference Gasparotto and Simboli1991; Bonadiman et al. Reference Bonadiman, Coltorti and Siena1994; Visonà, Reference Visonà1997; Carraro & Visonà, Reference Carraro and Visonà2003; Casetta et al. Reference Casetta, Coltorti, Ickert, Bonadiman, Giacomoni and Ntaflos2018 a, b, 2019; Lustrino et al. Reference Lustrino, Abbas, Agostini, Caggiati, Carminati and Gianolla2019; Storck et al. Reference Storck, Brack, Worzlaw and Ulmer2019). In the Dolomites, Triassic sills and lava flows lie between the Livinnallongo and Conglomerato della Marmolada formations (of Ladinian age, according to Gasparotto & Simboli, Reference Gasparotto and Simboli1991). Rb–Sr and 40Ar/39Ar dating of the intrusives and subvolcanic rocks of the Mount Monzoni and Predazzo volcano-plutonic complexes yields ages of 238–230 Ma (Borsi & Ferrara, Reference Borsi and Ferrara1968; Laurenzi et al. Reference Laurenzi, Visonà and Zantedeschi1994; Laurenzi & Visonà, 1996), with the exception of the lamprophyres from Predazzo (219.22 ±0.73 Ma; Casetta et al. Reference Casetta, Ickert, Mark, Bonadiman, Giacomoni, Ntaflos and Coltorti2019). Zircon U–Pb geochronology on a few intermediate to acid intrusives from the same complexes and on volcanic ash beds from the Western Dolomites suggest an interval between 242.65 ± 0.04 and 237.58 ± 0.04 Ma (Storck et al. Reference Storck, Brack, Worzlaw and Ulmer2019).
In the Carnic and Julian Alps (eastern Southern Alps), the only basic products are the lava flows from Forni di Sopra (Carnic Alps), which stratigraphically appear slightly younger and lie inside the Livinallongo Formation (Carnian). In this area, intermediate to acid tuff layers, volcanoclastic deposits and ignimbrites are more abundant. The most representative are the Rio Freddo volcanic rocks, which lie between the limestones of the Calcari di Pontebba and the Dolomia dello Sciliar formations; these are attributed to the late Anisian and Ladinian ages by Gianolla (Reference Gianolla1992), respectively. Isotopic age data for these units are missing.
On the easternmost side, Triassic magmatism is represented by the northern part of the Karawanken plutonic belt (Austria; Visonà & Zanferrari, Reference Visonà and Zanferrari2000; Bole et al. Reference Bole, Dolenec, Zupančič and Činč-Juhant2001; Miller et al. Reference Miller, Thöni, Goessler and Tessadri2011), which crop out just north of the Periadriatic Line, in the Alcapa mega-unit. It is composed by alkaline gabbros, monzonites, syenites and syenogranites. Available ages range from 221 ± 6 Ma (whole rock Rb-Sr isochron; Visonà & Zanferrari, Reference Visonà and Zanferrari2000) to 238 ± 2 Ma (mineral-whole rock Sm/Nd isochron; Miller et al. Reference Miller, Thöni, Goessler and Tessadri2011).
3. Sampling
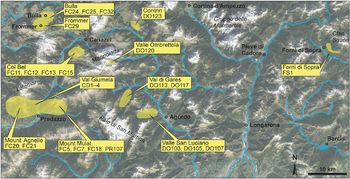
A total of 146 samples of lava flows, sills, dykes, plutonic rocks and ignimbrites were collected in the eastern sector of the Southern Alps, from the Dolomites to the Julian Alps (Fig. 1). Where possible, lava flows were preferentially sampled in order to minimize the effect of contamination from the carbonate country rocks, which is common in the intrusive and sub-intrusive Triassic rocks of the Dolomites. Sampling locations are shown in Figure 3. Samples from the Western Dolomites include lava flows, dykes and minor sills and intrusives. Among the dykes, we also sampled a lamprophyric dyke from Predazzo cutting Triassic volcanics of Mount Mulat. In the Eastern Dolomites, sills were mainly sampled with only a few lava flows and dykes, including another lamprophyre. In the Carnic Alps a few lava flows cropping out close to the village of Forni di Sotto were collected, and in the Julian Alps some samples of ignimbrites from the Rio Freddo volcanic rocks were collected close to the town of Tarvisio.
Sampling locations (yellow areas) in the Dolomites (west) and Carnic Alps (east). The list of selected samples (yellow squares) for each locality is also reported. Background map is from Google Earth Pro®, version 7.3.2.5776, imagery date 10/23/2019, eye altitude 73 km.

4. Analytical methods
Mineral compositions were determined by a Cameca SX50 electron microprobe at the Institute for the Geosciences and Georesources, Consiglio Nazionale delle Ricerche (CNR), Padova, Italy. Operating conditions of the instrument were: 15 kV acceleration voltage, 15 nA beam current, counting times of 10 s for peak and 10 s for background (i.e. 5 s for each side of the peak), and c. 2 μm spot size. Natural and synthetic minerals were used as standards. X-ray counts were converted into weight per cent oxides using Cameca PAP software.
Whole-rock major elements for the majority of the samples were performed using a X-ray fluorescence (XRF) spectrometer Philips 1404 at the Department of Mathematics and Geosciences, University of Trieste, after preparing pressed powder pellets. The resulting errors were less than 2%. Analysis of the remaining samples (CD1, CD2, CD3 and CD4) was carried out on glass beads with a XRF spectrometer WDS Philips PW2400 at the Department of Geosciences, University of Padova. The Cross, Irving, Pirrson and Washington (CIPW) data (Cross et al. Reference Cross, Iddings, Pirsson and Washington1902) and the Mg number (Mg no. = Mg/[Mg+Fe2+]) were calculated assuming a Fe2O3/FeO ratio of 0.20, here assumed to be an average value for alkaline magmas (e.g. Moussalam et al. Reference Moussalam, Oppenheimer, Scaillet, Gaillard, Kyle, Peters, Hartley, Berlo and Donovan2014; Grocke et al. Reference Grocke, Cottrell, de Silva and Kelley2016).
Trace elements were analysed using the inductively coupled plasma – mass spectrometry (ICP-MS) at ACME Labs (Vancouver, Canada) and at the Centre de Recherches Pétrographiques et Géochimiques (CRPG) Centre national de la recherche scientifique (CNRS) laboratory at Vandoeuvre les-Nancy (France). Since the loss of ignition (LOI) values are rather high in most of the collected samples, because of the presence of vacuoles filled by secondary carbonates, we performed a leaching for all the selected samples via a 0.1 mol solution of HCl at room temperature for 1 minute before analysing isotope ratio. Isotopic analyses were performed at the Department of Mathematics and Geosciences, University of Trieste and at the Department of Earth Sciences, University of Geneva, Switzerland. In Trieste we measured the isotope ratio of Sr (87Sr/86Sr) and Nd (143Nd/144Nd) using a VG Isomass 54E mass spectrometer, following Doroozi et al. (Reference Doroozi, Vaccaro, Masoudi and Petrini2016). The isotopic fractionation was corrected using the value 88Sr/86Sr = 0.1194. The standards NBS987 and JNd1 yielded a mean value of 0.71025 ± 2 (n = 20) and 0.51210 ± 2 (n = 5), respectively.
In Geneva, we measured the isotope ratios of Sr (87Sr/86Sr), Nd (143Nd/144Nd) and Pb (206Pb/204Pb, 207Pb/204Pb, 208Pb/204Pb) using a Thermo Neptune Plus Multi-Collector ICP-MS in static mode. The method is described in detail in Chiaradia et al. (Reference Chiaradia, Müntener and Beate2011) and Beguelin et al. (Reference Beguelin, Chiaradia, Beate and Spikings2015). Between 100 and 120 mg of whole-rock powder were dissolved over 7 days in Savillex® Teflon vials using 4 mL of concentrated HF and 1 mL of 14 M HNO3 at a temperature of 140°C, and with the help of ultrasonication for 30 minutes twice a day. Subsequently, samples were dried and redissolved for 3 days (also with 30 minutes ultrasonication twice a day) in 3 mL of 14 M HNO3 and dried again. Sr, Nd and Pb were then separated using cascade columns with Sr-Spec, Tru-Spec and Ln-Spec resins according to a protocol modified from Pin et al. (Reference Pin, Briot, Bassin and Poitrasson1994). Finally, the material was redissolved in 2% HNO3 solutions and ratios were measured using a Thermo Neptune Plus Multi-Collector ICP-MS in static mode. Ratios used to monitor internal fractionation were: 88Sr/86Sr = 8.375209 for the 87Sr/86Sr ratio, 146Nd/144Nd = 0.7219 for the 143Nd/144Nd ratio and 203Tl/205Tl = 0.418922 for the three Pb ratios (a Tl standard was added to the solution). Used external standards were SRM987 (87Sr/86Sr = 0.710248, long-term external reproducibility: 10 ppm), JNdi-1 (143Nd/144Nd = 0.512115; Tanaka et al. Reference Tanaka, Togashi, Kamioka, Amakawa, Kagami, Hamamoto, Yuhara, Orihashi, Yoneda, Shimizu, Kunimaru, Takahashi, Yanagi, Nakano, Fujimaki, Shinjo, Asahara, Tanimizu and Dragusanu2000; long-term external reproducibility: 10 ppm), and SRM981 (Baker et al. Reference Baker, Peate, Waight and Meyzen2004) for Pb (long-term external reproducibility of 0.0048% for 206Pb/204Pb, 0.0049% for 207Pb/204Pb and 0.0062% for 208Pb/204Pb). 87Sr/86Sr, 143Nd/144Nd and Pb isotope ratios were further corrected for machine bias (as a result of a systematic difference between measured and accepted standard ratios) by values of −0.039‰, +0.047‰ and +0.5‰ amu respectively. Interferences at masses 84 (84Kr), 86 (86Kr) and 87 (87Rb) were corrected by monitoring 83Kr and 85Rb; 144Sm interference on 144Nd was monitored on the mass 147Sm and corrected using a 144Sm/147Sm value of 0.206700; and 204Hg interference on 204Pb was corrected by monitoring 202Hg. Total procedural blanks were <500 pg for Pb and <100 pg for Sr and Nd, which are insignificant compared with the amounts of these elements purified from the whole-rock samples investigated.
5. Sample selection and classification
Of the 146 samples, a first careful screening based on the observation of hand specimens and thin-sections resulted in the exclusion of 70 samples as they showed high degrees of hydrothermal alteration. The remaining 76 samples were selected for whole-rock major- and trace-element chemical analysis (XRF). Further selection of the less-altered samples was also performed by considering rock type and sampling location, leaving 26 representative samples (Table 1) investigated in detail for petrography, mineral chemistry and trace elements. Among these, 10 samples were further analysed to obtain Sr and Nd isotopic ratios, of which 6 were also investigated for Pb isotopes (Table 1). The sampling sites for these selected rocks are shown in Figure 3.
Description of the selected samples and analytical methods of investigation

CA – Carnic Alps; BAA – basaltic andesite; BAS – basalt; BTA – basaltic trachyandesite; ED – Eastern Dolomites; G – gabbro; LF – lava flow; MZ – monzogabbro; TAN – trachyandesite; TEP – tephrite; TRB – trachybasalt; WD – Western Dolomites. Analyses performed at the University of Trieste (TS), University of Padua (PD), ACME Labs, Vancouver (VA), CRPG-CNRS Laboratory at Vandoeuvre les-Nancy (NA) and University of Geneva (GE).
a Major- and trace-element and isotopic analyses performed separately on the matrix and the amphibole megacrysts
Figure 4 shows the composition of all 76 analysed samples plotted in the total alkali silica (TAS) classification diagram of Le Bas et al. (Reference Le Bas, Le Maitre and Woolley1992). The large scatter of the entire sample suite may be at least partially related to hydrothermal alteration, which causes a shift to higher Na and K contents of the rocks as a result of the presence of zeolites, or an increase of the silica content as a result of the replacement of the glass matrix by hydrothermal silica. If only the 26 selected samples are considered, the general spread of compositions is reduced and the selected rocks fall within the central part (Basalt to basaltic trachyandesite fields) of the TAS diagram, with the exception of the two lamprophyres. Since the TAS diagram does not discriminate possible transitional rock types, we additionally used the alkaline–subalkaline subdivision of Miyashiro (Reference Miyashiro1978; Fig. 4) and the R1–R2 diagram of de la Roche et al. (Reference de la Roche, Leterrier, Grandclaude and Marchal1980; online Supplementary Fig. S1). According to these classification schemes, the studied rocks display a transitional character between alkaline and tholeiitic. This is also supported by the calculated CIPW normative compositions, which yield mostly normative hypersthene and olivine and lack nepheline and quartz. Exceptions are samples FC13 and FS1, which show quartz normative of 5% and 2%, respectively (Table 2).
Na2O + K2O v. SiO2 wt% (TAS) classification diagram after Le Bas et al. (Reference Le Bas, Le Maitre and Woolley1992). Chemical data have been normalized to 100 wt% anhydrous. The grey line represents the alkaline–subalkaline boundary of Miyashiro (Reference Miyashiro1978). AND – andesite; BAA – basaltic andesite; BAS – basalt; BTA – basaltic trachyandesite; DAC – dacite; FOI – foidite; PIB – picritic basalt; PHO – phonolite; PTE – phonotephrite; TPH – tephrifonolite; RHY – rhyolite; TAN – trachyandesite; TDA – trachydacite; TEP – tephrite; TRA – trachyte; TRB – trachybasalt. The intrusive samples FC18, FC20 (monzogabbros) and DO103 (gabbro) are plotted only for comparison.

Major and minor elements (wt%; normalized to 100 wt% anhydrous) and some relevant CIPW normative minerals of some representative samples of the basaltic suite and lamprophyres. LOI – loss on ignition

aComposition of the groundmass of lamprophyre PR107; bCalculated CIPW normative mineral abundance (wt%).
Based on the above classification schemes, textural and mineralogical features and locations, we subdivided the samples into three main groups.
Basaltic suite. This group identifies the selected samples that are either basalts or compositions consistent with a liquid line of descent starting from a basaltic primary magma. In the TAS diagram (Fig. 4), they classify as basalts, basaltic andesites, trachybasalts, basaltic trachyandesites and trachyandesites. Due to their chemical affinities, we also included in this group a gabbro (DO103) from Cima Pape (Agordo, Dolomites) and two monzogabbros (FC18, FC20) from Mount Mulat and Mount Agnello, Dolomites. Even although these monzogabbros appeared to be unaltered and had been collected as far as possible from a contact-metamorphic aureole cropping out in the area, they received only minimal consideration because of the likely contamination by widespread exo- and endo-skarn. This suite also includes basaltic lava flows from the Carnic Alps, which are in general more sodic and evolved. As a result of the extensive alteration, it was possible to select only one relatively unaltered sample (FS1) as representative of this locality.
Lamprophyres. These two samples (PR107 and DO123) are from the Dolomites. They were identified as lamprophyres because of their paragenesis (see Section 6.b below) and their relatively low K2O/Na2O (<3.0; Woolley et al. Reference Woolley, Bergman, Edgar, Le Bas, Mitchell, Rock and Scott-Smith1996). Following Le Maitre et al. (Reference Le Maitre, Streckeisen, Zanettin, Le Bas, Bonin and Bateman2002), and as suggested by Carraro and Visonà (Reference Carraro and Visonà2003), they belong to the camptonite family as they show the sporadic presence of clinopyroxene, the presence of altered olivine and a high modal plagioclase/K-feldspar ratio. Sample PR107 includes amphibole megacrysts that show idiomorphic shape and concentric zoning patterns, suggesting that they are phenocrysts rather than xenocrysts, in agreement with the observations of Carraro and Visonà (Reference Carraro and Visonà2003). Due to the large size of these amphibole crystals (1–15 cm), separate chemical analyses were performed on amphibole megacrysts and on the groundmass. The whole-rock composition was calculated by mass balance, adding 20% of amphibole (its estimated modal amount) to the groundmass composition. Such a calculated composition classifies the rock as trachybasalt, that is, slightly more evolved than DO123, which classifies as tephrite.
Ignimbrites from the Julian Alps. In the TAS classification diagram, these fall within the rhyolite field. These samples are moderately and are therefore only briefly discussed. These rocks are generally the products of explosive volcanism and pyroclastic flows.
6. Petrography
6.a. Basaltic suite
Dykes and lava flows from the Dolomites generally show a medium- to fine-grained porphyritic texture, often seriated. The phenocrysts are represented by augite, strongly zoned plagioclase and olivine, which can be altered (e.g. serpentinized or reabsorbed in opaque minerals). Generally, the groundmass is glassy and altered, or microgranular. Microlites comprise the same minerals as described above, with the exception of a few more evolved samples in which sanidine can be present. The most common accessory mineral is apatite, while biotite is found in only a few samples.
The two selected monzogabbros from Mount Mulat (FC18) and Mount Agnello (FC20) show an ipidiomorphic texture. The major phases are slightly altered idiomorphic plagioclase, allotriomorphic K-feldspars and augite locally recrystallized as brown amphibole. Accessory phases are opaque minerals (macroscopically identified as magnetite and sulfides), apatite, biotite, rare sphene and zircon.
The San Luciano Valley gabbro (DO103), representing the inner part of a 100-m-thick sill, shows an ipidiomorphic texture with grain size medium to coarse. The main phase is represented by euhedral to subeuhedral clinopyroxene crystals, while plagioclase, olivine (often iddingsitized) and alkali feldspar are subordinated. The accessory phases are opaque minerals and apatite.
Secondary minerals are often present in the basaltic suite from the Dolomites. Carbonates are the main phases but zeolites, chlorites, amphiboles and products related to plagioclase alteration (e.g. albite and epidote) are also common. In some samples, small vacuoles randomly filled by carbonates, zeolites and chalcedony are present.
Lava flows from the Carnic Alps show a micro-porphyric texture, in which the main phenocryst is plagioclase often altered to sericite, while clinopyroxene microcrystals are rare. The groundmass is hyalopilitic, with feldspathic microlites, undistinguishable pyroxenes and opaque minerals. The selected sample FS1 does not show secondary minerals, but the light-green appearance of the glassy matrix suggests slight alteration.
6.b. Lamprophyres
The lamprophyre from Mount Mulat (Predazzo; PR107) shows a coarse-grained porphyric texture, with many idiomorphic megacrysts of zoned amphibole (1–15 cm length), rare megacrysts of plagioclase and rare phenocrysts of altered clinopyroxene. Amphibole and plagioclase also commonly appear as phenocrysts or microphenocrysts. Abundant plagioclase and rare opaque minerals are present as microlites. Accessory olivine, sometimes entirely replaced by iddingsite, is present as microlites.
The lamprophyre from Marmolada (DO123) shows a fine-grained porphyric texture. Hornblende, more abundant than in the previous lamprophyre, is zoned. Olivine and clinopyroxenes, completely altered into saponitic products or replaced by carbonates, are abundant. Abundant plagioclase is confined to the groundmass. Secondary minerals are occasionally represented by carbonates.
6.c. Ignimbrites
The ignimbrites from the Julian Alps show an eutaxitic texture ranging from aphyric to slightly porphyroclastic. The felsic minerals (probably former plagioclase and alkali-feldspar) are often completely altered. The rare mafic minerals are completely replaced by saponitic products. Finally, the glass of the groundmass is often completely recrystallized, probably in clay minerals.
7. Mineral chemistry
Major-element compositions of olivine, pyroxenes, feldspars, amphibole and oxides are reported in online Supplementary Table S1 (available at http://journals.cambridge.org/geo).
7.a. Olivine
In the majority of the samples, olivine is altered, serpentinized or transformed into iddingsitic products. Fresh or partially fresh olivine crystals were only found in a few samples from the basaltic suite. From core to rim, the phenocrysts show a composition of Fo68–Fo64 to Fo63–Fo58 (Fo = mol% forsterite component). Calculated olivine/whole-rock
 $K_{D}^{Fe-Mg}$
values are 0.29 for the lava flow CD2 and 0.52 for the dyke FC11. The latter is higher than the typical equilibrium values (0.30 ± 0.03; Roeder & Emslie, Reference Roeder and Emslie1970), suggesting that olivines crystallized from melts that were more evolved than the melt composition represented by the whole-rock. The CaO content is rather high (0.29–0.41 wt%), suggesting alkaline affinity or carbonate contamination.
7.b. Pyroxenes
All the pyroxenes are classified as augites (based on Morimoto et al. Reference Morimoto1988) and are characterized by TiO2 contents generally lower that 1 wt%. Estimated Al content in the tetrahedral sites range between 0.063 and 0.240 apfu. Pyroxenes analysed in the sample FS1 (Carnic Alps) show the largest variations in TiO2 (0.41–1.77 wt%) and Al2O3 (2.01–8.00 wt%). Cores and rims generally show comparable compositions with the exception of the samples from Val Giumela, for which detailed core–rim analyses were carried out (online Supplementary Fig. S2).
7.c. Plagioclase and alkali-feldspar
Plagioclase in the olivine-basalts is strongly zoned and often altered. In the fresh portions, the anorthite content (An) varies between 67–83% (core) and 62% (rim and microlites) in DO117, while in FC11 An varies between 82 and 77% without a substantial difference between core and rim/microlites.
Among the basaltic trachyandesites, plagioclase phenocrysts of sample FC5 show a clear reverse zoning with higher An at the rim (67–78%) than in the core (56–67%). This feature is in association with the presence of rare microlites of biotite in the rock. Plagioclase grains in DO120 have An contents in the range 76–87%, which suggests disequilibrium with the moderately evolved whole-rock composition (SiO2 = 51.2 wt%; CaO/Na2O = 2.51). In the basaltic andesite FS1, unaltered microphenocrysts of plagioclase have a labradorite composition (An62–63).
Plagioclase in the lamprophyre DO123 shows higher An in the cores (61–83%) than at the rims (38–39%). On the other hand, lamprophyre PR107 (characterized by zoned megacrysts) shows plagioclase crystals with variable An core composition spanning 38–83%, while the An at the rims ranges over 66–87%, being generally higher than within the cores. Moreover, plagioclase crystals from sample PR107 are characterized by oscillatory zoning patterns.
The few analysed sanidine crystals belong to samples DO123 (lamprophyre) and FC11 (olivine-basalt), while anorthoclase is only present in FS1 (andesitic basalt). The rare albitic compositions (online Supplementary Table S1) suggest a slight spilitization related to interaction with seawater.
7.d. Amphiboles
Among the selected samples only the lamprophyres (DO123 and PR107) contain amphiboles; these are rich in Ca and show TiO2 contents of 3.75–5.97 wt%. According to the classification scheme of Leake et al. (Reference Leake, Woolley, Arps, Birch, Gilbert, Grice, Hawthorne and Youzhi1997), the megacrysts of PR107 are mainly Fe-pargasites, few hastingsites and rare pargasites and kaersutites, while smaller crystals of DO123 are mainly kaersutites and minor pargasite. The classification diagram of Rock (Reference Rock, Fitton and Upton1987; online Supplementary Fig. S3) shows that the analysed amphiboles fall within the alkaline-ultramafic lamprophyre field, consistent with the lamprophyric nature of these dykes. The megacrysts of PR107 plot in the region where this field overlaps with the calc-alkaline lamprophyres.
8. Whole-rock geochemistry
Whole-rock major and trace elements and Sr, Nd and Pb isotopic compositions for the selected samples are reported in Tables 2 and 3 and online Supplementary Table S2.
Trace-element contents (ppm), isotope ratios and calculated model ages (Ma) of some representative samples from the basaltic suite and lamprophyres

a Initial ratio calculated for 235 Ma.
8.a. Major- and trace-element variations
Figure 5 shows some representative major- and trace-element data for the basaltic suite, lamprophyres and ignimbrites. Considering all the samples, a marked compositional gap separates the basaltic suite and lamprophyres (Mg no. = 0.40–0.70; SiO2 = 45–53 wt%) from the ignimbrites (Mg no. = 0.07–0.30; SiO2 = 60–72 wt%; Fig. 5). The basaltic suite from the Dolomites shows an increase in Al2O3 and an apparent decrease in FeOtot with decreasing Mg no., while all the other major elements show no clear correlations with Mg no. With respect to samples with similar Mg no. values, the basaltic trachyandesite FS1 from the Carnic Alps shows slightly higher SiO2 and Al2O3, and lower FeOtot content compared with the Dolomitic samples. Both lamprophyres differ from the basaltic suite by showing higher contents of TiO2 and P2O5. Light rare earth element (LREE) contents show rough negative correlations with Mg no. (e.g. Fig. 5). Variations in alkaline major elements (Na2O and K2O) and of large-ion lithophile elements (LILE; Rb, Ba, Sr; Table 3; online Supplementary Table S2) are likely affected by hydrothermal alteration, even for the selected samples. Regardless, Rb and K2O, and to a lower extent Sr, display a general trend of increasing contents with decreasing Mg no., even if the correlation is quite scattered. Nb progressively increases from the basaltic suite to the ignimbrites (6–21 ppm), but it is significantly higher in the lamprophyres (38–50 ppm). The lamprophyres also show higher Zr and slightly higher LREE compared with the basalts.
Variations of some major (wt%) and trace elements (ppm) for the basaltic suite, lamprophyres and ignimbrites. Symbols as in Figure 4. The vector of hydrothermal alteration is an example of how Na2O in the bulk rock would increase with increasing modal abundance of natrolite (from 0 to 35 wt%), which is a common product of hydrothermal alteration of the area.

Figure 6 shows the chondrite- (CN-) normalized REE patterns and primitive-mantle- (PM-) normalized trace-element spider diagrams for the basaltic suite and lamprophyres. Most basaltic samples from the Dolomites show similar LREE versus (v.) middle REE (MREE) and heavy REE (HREE) ratios (Fig. 6a; La/SmCN =2.8; Sm/DyCN = 2.3; Dy/YbCN = 1.3; La/YbCN = 8.2; average values excluding DO103). The exception is the gabbro (DO103; Mg no. = 0.61), which shows slightly lower LREE contents and LREE/MREE ratios (La/SmCN = 2.2). FS1 (Carnic Alps) yielded slightly higher HREE concentrations (La/YbCN = 5.6). All the samples present a small negative Eu anomaly (average Eu/Eu* = 0.82; Eu* = (SmCN+GdCN)/2), which may result from plagioclase fractionation. The lamprophyres (Fig. 6c) show REE patterns similar to the basaltic samples, but do not show the negative Eu anomaly (Eu/Eu* = 1.0–1.06). All the REE patterns plot between those of average ocean-island basalts (OIB) (McDonough & Sun, 2005) and the upper crust as proposed by Rudnick & Gao (Reference Rudnick, Gao and Rudnick2003) (Fig. 6a, c). In particular, the LREE better approach the OIB composition (La/SmCN = 2.3), while HREE variations resemble those of the upper crustal (Dy/YbCN = 1.7).
(a, c) REE patterns (normalized to chondrites; Boynton, Reference Boynton and Henderson1984) and (b, d) trace-element spider diagrams (normalized to primitive mantle; McDonough & Sun, Reference Mc Donough and Sun1995) for (a, b) the basaltic suite and (c, d) lamprophyres investigated in this study. (c, d) A diorite from the external gabbro unit of the Finero complex (sample FI90/16; Lu et al. Reference Lu, Hofmann, Mazzucchelli and Rivalenti1997 b), a representative gabbro from the northern Karawanken complex (Miller et al. Reference Miller, Thöni, Goessler and Tessadri2011) and average values of upper crust (Rudnick & Gao, Reference Rudnick, Gao and Rudnick2003), OIB and N-MORB (McDonough & Sun, Reference Mc Donough and Sun1995) are shown for comparison.

In PM-normalized multi-elemental diagrams (Fig. 6b, d), the basaltic suite from the Dolomites shows marked negative Nb anomalies (v. K and La) and negative Ti anomalies (v. Hf and Y). Pb often shows positive spikes (particularly marked in samples from near the Predazzo intrusion and mineralizations) and, rarely, slightly negative anomalies. Notably, the highest Pb content is shown by sample FC5 (Pb = 14.2 ppm) collected on Mount Mulat where sulphide and tungstate mineralization occurs (Bedovina mine). The mineralization is sub-contemporaneous with the Triassic magmatism, being related to the aplitic and pegmatitic products of the Predazzo granitic intrusion (Bianchi & Di Colbertaldo, 1956). Sr does not show any negative anomalies. This appears in contrast with the negative Eu anomalies observed above (both Eu and Sr easily substitute for Ca in plagioclase), and could therefore be related to the presence of very small amounts of Sr-bearing carbonate in the groundmass. Notably, in the Monzoni area the analysed Sr in carbonates reaches 1.2 wt% (R Petrini, personal communication, 2010). Compared with the basaltic suite from the Dolomites, the sample from the Carnic Alps (FS1) shows a less-accentuated Nb negative anomaly. Lamprophyres lack significant Nb and Ti anomalies and show a strong trough for Pb, which is particularly evident for the lamprophyre from Marmolada (DO123). The trace-element patterns of the basaltic suite approach the Upper Crust end-member of Rudnick & Gao (Reference Rudnick, Gao and Rudnick2003), in particular for Nb, LILE and Ti (Fig. 6d).
8.b. Sr, Nd and Pb isotopes
The Sr–Nd–Pb isotopic ratios of the selected representative samples are shown in Table 3 and Figures 7 and 8. The basaltic suite from the Dolomites has initial (230 Ma) Sr and Nd isotopic compositions in the range 0.70349 ± 2 – 0.70500 ± 1 and 0.512240 ±1 – 0.512310 ± 2, respectively. These values are similar to those obtained for the Predazzo intrusive complex (0.70399 ± 7 –0.70620 ± 4 and 0.51219 ± 7 – 0.51230 ± 2; Casetta et al. Reference Casetta, Coltorti, Ickert, Bonadiman, Giacomoni and Ntaflos2018 a), but differ partially from the intrusive samples from Mount Monzoni (0.70449–0.70786 and 0.51185–0.51213; Bonadiman et al. Reference Bonadiman, Coltorti and Siena1994). The latter are systematically more depleted in 143Nd/144Ndi and plot along the mantle array extension, with the exception of one sample. Among our samples, the basalt from the Carnic Alps (FS1) shows the highest 87Sr/86Sri and the lowest 143Nd/144Ndi (0.70679 and 0.51214, respectively) values, similar to the samples from the Monzoni intrusion (Bonadiman et al. Reference Bonadiman, Coltorti and Siena1994). All the basalts show a decoupling between the elemental and the isotopic data (compare Fig. 7a with Fig. 7b).
(a) Initial (230 Ma) 143Nd/144Nd v. 87Sr/86Sr compositions of the studied samples and results of the AFC modelling using the Cima d’Asta granite (black curves) and high-Sr (blue curves) and low-Sr (pink curves) carbonates. See text for details on the modelling. The plot also includes Triassic gabbroic intrusives from Mount Monzoni (Bonadiman et al. Reference Bonadiman, Coltorti and Siena1994) and Karawanken (sample 08EK18 from Eisenkappel; Miller et al. Reference Miller, Thöni, Goessler and Tessadri2011), lamprophyres from Predazzo (Casetta et al. Reference Casetta, Ickert, Mark, Bonadiman, Giacomoni, Ntaflos and Coltorti2019), a diorite from Finero (sample Fi90; Lu et al. Reference Lu, Hofmann, Mazzucchelli and Rivalenti1997 a) and Permian magmatic rocks (Rottura et al. Reference Rottura, Bargossi, Caggianelli, Del Moro, Visonà and Tranne1998). N-MORB (light grey shaded fields), EMI and EMII were calculated for an age of 230 Ma using the isotopic values from Hart & Zindler (Reference Hart, Zindler and Peltier1989) and the elemental concentration proposed for the OIB by McDonough & Sun (Reference Mc Donough and Sun1995). The bulk earth (BE) isotopic composition was recalculated at 230 Ma using elemental compositions of Sm and Nd from the recommended chondrite (Boynton, Reference Boynton and Henderson1984) and Rb and Sr from the primitive mantle (PM) of McDonough & Sun (Reference Mc Donough and Sun1995). (b) Sm/Nd v. Rb/Sr diagram.

206Pb/204Pb v. 207Pb/204Pb and v. 208Pb/204Pb isotopic compositions of the studied rocks. The values for GLOSS (global sea sediments) are from Plank & Langmuir (Reference Plank and Langmuir1998), Valsugana dykes from Bianchini et al. (Reference Bianchini, Natali, Shibata and Yoshikawa2018) and Bedovina Mine samples from Artioli et al. (Reference Artioli, Angelini, Nimis and Villa2016). The geochron, the NHRL (Northern Hemisphere reference line; Hart, Reference Hart1984), and the depleted MORB mantle (DMM) and enriched mantle II (EMII; Hart & Zindler, Reference Hart, Zindler and Peltier1989) fields are plotted for comparison. In the figure, the available compositional ranges of the Variscan crystalline basement as reported by Artioli et al. (Reference Artioli, Angelini, Nimis and Villa2016) is plotted as representative of the Eastern Alps crustal composition. The composition of the Variscan meta-sediments as reported by Koppel & Schroll (Reference Koppel and Schroll1988) is shown for comparison. Other symbols are as in Figure 7.

The lamprophyres show the lowest 87Sr/86Sri and the highest 143Nd/144Ndi values (0.70326–0.70413 and 0.51268–0.51222, respectively). PR107 appears quite depleted, similar to mid-ocean-ridge basalt (MORB) compositions, while DO123 is more enriched, plotting below the bulk earth (BE) value towards the enriched mantle I (EMI) end-member (Hart & Zindler, Reference Hart, Zindler and Peltier1989). Notably, the isotopically depleted lamprophyre PR107 indicates an elemental enrichment in Nd v. Sm (compare Fig. 7a with Fig. 7b).
206Pb/204Pb v. 207Pb/204Pb and v. 208Pb/204Pb isotopic ratios of all analysed samples plot above the Northern Hemisphere reference line (NHRL; Hart, Reference Hart1984) and to the right of the 4.55-Ga geochron (Fig. 8). Globally, the data plot between the compositions of Variscan meta-sediments (Koppel & Schroll, Reference Koppel and Schroll1988) and those of the enriched mantle II (EMII) component (Hart & Zindler, Reference Hart, Zindler and Peltier1989) and the global sea sediments (GLOSS) field (Plank & Langmuir, Reference Plank and Langmuir1998). The lowest Pb isotopic values are shown by the lamprophyre (PR107), while the sample FC29 plots close the GLOSS field and the EMII pole. The Cu-mineralized Bedovina rocks, interpreted as being related to the Triassic Dolomitic volcanism, plot at the low-206Pb/204Pbi end of our samples and overlap with the Pb isotopic compositions of the Variscan basement (Artioli et al. Reference Artioli, Angelini, Nimis and Villa2016).
8.c. Comparisons with coeval rocks from the Southern Alps and Alcapa
Trace-element contents and Sr, Nd and Pb isotopic ratios were compared with the existing data for other magmatic products attributed to Ladinian–Carnian ages in the Southern Alps and western Alcapa. In particular, we considered the basic rocks of the Karawanken complex (Visonà & Zanferrari, Reference Visonà and Zanferrari2000; Miller et al. Reference Miller, Thöni, Goessler and Tessadri2011), a Triassic diorite in the external gabbro unit of the Finero mafic complex, Italy (Fig. 1; Lu et al. Reference Lu, Hofmann, Mazzucchelli and Rivalenti1997 a, b), the shoshonitic magmas of the Triassic Predazzo intrusive complex (Casetta et al. Reference Casetta, Coltorti, Ickert, Bonadiman, Giacomoni and Ntaflos2018 a, b) and the gabbro-monzogabbros from Mount Monzoni studied by Bonadiman et al. (Reference Bonadiman, Coltorti and Siena1994).
Most of the basic Karawanken samples show REE patterns close to the basaltic samples studied in this work, while in terms of other trace elements (i.e. LILE or high-field-strength elements (HFSE) e.g. Nb) they show patterns similar to the lamprophyres. Conversely, the Finero diorite is much more depleted in trace elements and shows an REE pattern more similar to normalized- (N-) MORB magmas (Fig. 6).
The few available Sr isotopic data from the Karawanken complex (87Sr/86Sri = 0.70313 ± 2 – 0.70525 ± 3; Visonà & Zanferrari, Reference Visonà and Zanferrari2000) appear quite similar to those from Dolomites, with the exception of one sample that appear less enriched (Miller et al. Reference Miller, Thöni, Goessler and Tessadri2011; 87Sr/86Sri = 0.70496, 143Nd/144Ndi = 0.51242). On the other hand, the Finero diorite (Lu et al. Reference Lu, Hofmann, Mazzucchelli and Rivalenti1997 a) differs from all the other samples, approaching an N-MORB signature and plotting close to the lamprophyre PR107 (Fig. 7). Finally, the Mount Monzoni samples studied by Bonadiman et al. (Reference Bonadiman, Coltorti and Siena1994) are moderately enriched in 87Sr/86Sri, pointing towards EMII and overlapping the composition of the nearby Permian Cima d’Asta granite (Southern Alps; Rottura et al. Reference Rottura, Bargossi, Caggianelli, Del Moro, Visonà and Tranne1998). A comparison with the recent data on Valsugana dykes from Bianchini et al. (Reference Bianchini, Natali, Shibata and Yoshikawa2018) is reported in online Supplementary Figure S4.
In the 206Pb/204Pb v. 207Pb/204Pb and v. 208Pb/204Pb diagram (Fig. 8a, b), the Valsugana dykes (Bianchini et al. Reference Bianchini, Natali, Shibata and Yoshikawa2018) plot above the NHRL. With the exception of two samples, which show similar values to the Dolomitic samples of this work, the Valsugana dykes are radiogenically more enriched. Since all the Valsugana dykes show a positive Pb anomaly in the PM-normalized trace-element pattern, we suggest that the observed 206Pb/204Pb, 207Pb/204Pb and 208Pb/204Pb ratios are not inherited from the source, but are probably the result of contamination by the host rocks (Variscan Metamorphic Unit).
9. Geothermobarometry and geohygrometry
A number of mineral–mineral and mineral–melt equilibria have been used to estimate the pressure (P), temperature (T) and melt H2O contents of the magmas before eruption, using the whole-rock analyses as representative of melt compositions. A summary of the results for each individual sample is shown in Table 4 and Figure 9. For the basaltic suite, T and P were calculated iteratively using clinopyroxene–melt thermometry (Putirka, Reference Putirka2008, equation 33) and barometry (Neave & Putirka, Reference Neave and Putirka2017), assuming a melt H2O content of 2.0 wt% (average value from hygrometric calculations, see next paragraph; we note that an error of ±2.0 wt% in the assumed melt H2O propagates to an error of ±27°C and 200 MPa, on average). We then used the plagioclase–melt thermometer and hygrometer of Putirka (Reference Putirka2005, Reference Putirka2008) as a test for comparison.
Temperature, pressure and melt H2O estimates for some of the selected samples from the basaltic suite and lamprophyres

a Each value represents the average and standard deviation of multiple analyses of the same sample, unless only one analysis is available.
b Errors of each model as reported in the source papers. Note that standard deviations resulting from multiple analyses are well within the model errors of each method, except for the hygrometer of Lange et al. (Reference Lange, Frey and Hector2009).
Temperature and pressure estimates (average of multiple analyses) of the selected samples. Results for the basaltic suite refer to the clinopyroxene–melt thermometer of Putirka (Reference Putirka2008) and clinopyroxene–melt barometer of Neave & Putirka (Reference Neave and Putirka2017), while results for the lamprophyres refer to the amphibole–melt thermometer and amphibole–plagioclase barometer of Molina et al. (Reference Molina, Moreno, Castro, Rodriguez and Fershtater2015). Error bars are model errors (which are significantly higher than standard deviations of multiple analyses; see Table 4). Symbols as in Figure 4.

For the basaltic suite, observed KD(Fe–Mg)cpx-melt for all the samples is generally within the range considered by Putirka (Reference Putirka2008) to demonstrate equilibrium (0.27 ± 0.03), with the exception of samples DO117 (0.57) and CD1 (0.35–0.43). Average clinopyroxene–melt temperatures vary in the range 1076–1170°C, with the sample CD1 showing the higher values (1170 ± 14ºC). Average clinopyroxene–melt pressures vary in the range 420–600 MPa, with the exception of sample FC5 with lower values (180 ± 140 MPa). Furthermore, plagioclase–melt pairs also passed the test for equilibrium [KD(Ab–An)plag-melt = 0.28 ± 0.11; Putirka, Reference Putirka2008], with the exception of sample FS1 (0.53–0.54). Plagioclase–melt and clinopyroxene–melt temperatures agree within the calculated standard deviation (Table 4). The thermodynamic model of Lange et al. (Reference Lange, Frey and Hector2009) yields average melt H2O contents in the range 1.7–3.5 wt% for the basaltic suite from the Dolomites and a lower content for the sample from the Carnic Alps (FS1; melt H2O = 0.9 wt%). The plagioclase–melt hygrometer of Putirka (Reference Putirka2005, Reference Putirka2008) generally yields systematically slightly lower values (by c. 0.5 wt%).
Pressure and temperature was estimated for the lamprophyres using the amphibole–melt thermobarometers of Putirka (Reference Putirka2016) and amphibole–melt thermometer and amphibole–plagioclase barometer of Molina et al. (Reference Molina, Moreno, Castro, Rodriguez and Fershtater2015), assuming a melt H2O content of 6.0 wt% (in agreement with LOI values and hygrometric calculations for the Predazzo lamprophyres studied by Casetta et al. Reference Casetta, Ickert, Mark, Bonadiman, Giacomoni, Ntaflos and Coltorti2019). Note that model errors for these methods are higher than clinopyroxene– and plagioclase–liquid methods (Table 4). Observed KD(Fe–Mg)amph-melt values are generally higher than that recommended by Putirka (Reference Putirka2016) for amphibole–melt equilibrium (0.28 ± 0.11); the results of amphibole–liquid models therefore need to be considered with caution. Temperatures estimated using the amphibole–melt model of Putirka (Reference Putirka2016) are 1046 ± 18°C for sample DO123 and 1003 ± 25°C for sample PR107, while the model of Molina et al. (Reference Molina, Moreno, Castro, Rodriguez and Fershtater2015) yields temperatures lower by c. 50°C. Application of different barometer equations (Table 4) yields values in the range 850–1250 MPa for sample DO123 and 940–1500 MPa for sample PR107.
10. Discussion
10.a. Fractional crystallization processes
The range of Mg no. (0.62–0.42), the porphyric texture and zoned crystals suggest that fractional crystallization played an important role in the genesis of the basaltic suite. However, after the careful screening to discard the most altered samples, the remaining pristine samples are few and most likely belong to different volcanic systems. A fractional crystallization modelling is therefore not applicable. Previous attempts to model the differentiation of the Triassic magmas were made by Sloman (Reference Sloman1989), who suggested a prevalent role of clinopyroxene crystallization in the evolution of the basaltic magmas from the Western Dolomites. Accordingly, some coeval lavas from the same area host clinopyroxenite xenoliths, which are interpreted to be cumulates genetically related to the host magmas (Lucchini & Morten, Reference Lucchini and Morten1977). Narduzzi et al. (Reference Narduzzi, De Min, Lenaz and Princivalle2009) estimated the crystallization pressure for these cumulates to be c. 600 MPa, which is consistent with our estimates for the magmas based on clinopyroxene–melt barometry (400–600 MPa, with the exception of one sample). Most of the basaltic lavas, dykes and sills from the Dolomites therefore likely derived from magmas that crystallized mostly clinopyroxene at depths of c. 14–20 km. Plagioclase crystallization contributed to the evolution of the basaltic magmas, as also suggested by the CN-normalized REE patterns showing weakly negative Eu anomalies (Fig. 6a). On the other hand, the Predazzo intrusive complex is suggested to have emplaced at much shallower depths (0–7 km; Casetta et al. Reference Casetta, Coltorti, Ickert, Bonadiman, Giacomoni and Ntaflos2018 a) and originated from magmas that underwent crystal fractionation dominated by plagioclase and clinopyroxene (Casetta et al. Reference Casetta, Coltorti, Ickert, Bonadiman, Giacomoni and Ntaflos2018 a, b).
The low SiO2 and high MgO contents of the lamprophyres (Table 2) suggest that they underwent only relatively minor fractional crystallization. The amphibole megacrysts in the sample PR107 suggest that amphibole was the main fractionating phase. According to the geobarometric estimates (850–1500 MPa), fractionation probably occurred close to the crust–mantle transition, which is consistent with the occasional presence of mantle xenoliths in the same family of lamprophyres from Predazzo (Carraro & Visonà, Reference Carraro and Visonà2003).
10.b. Processes of magma–crust interaction
Sr, Nd and Pb isotopic compositions were used to put constraints on the possible interaction processes between the magmas and the Triassic and pre-Triassic crust in which they were emplaced. The possible lithologies that could have acted as contaminants were selected based on the geology of the area and the estimated storage depths of the magmas (14–20 km). Contamination could have occurred by: (1) assimilation during magma storage and differentiation in a crust possibly made by either Variscan rocks (e.g. metasediments) or refractory residues of the anatectic melting that produced the Permian acid volcanics (Rottura et al. Reference Rottura, Bargossi, Caggianelli, Del Moro, Visonà and Tranne1998); or (2) post-emplacement contamination either by the Permian acid volcanics or the Permo-Triassic carbonate sediments (i.e. limestones and carbonate-bearing siltstones and marls of the Bellerophon and Werfen formations).
The 206Pb/204Pb v 207Pb/204Pb isotopic compositions of the analysed samples overlap those of the Variscan metasediments (206Pb/204Pb = 18.35–19.00; Koppel & Schroll, Reference Koppel and Schroll1988; Fig. 8a), while the Bedovina Mine rocks fall in the Variscan basement field as defined by Artioli et al. (Reference Artioli, Angelini, Nimis and Villa2016), here assumed as representative of the crystalline basement of the Southern Alps. However, the Variscan metasediments have generally lower 208Pb/204Pb values than the Triassic basalts and lamprophyres, and are therefore excluded as possible contaminants.
To evaluate the possible role of the Permian acid rocks and Permo-Triassic carbonate sediments in the contamination processes of the basaltic suite, we used the assimilation-fractional crystallization (AFC) model of DePaolo (Reference DePaolo1981). The rate of assimilated/fractionated mass (r) was set to 0.3, which represents the minimum reasonable value. The distribution coefficients (D) for Sr and Nd were set to 0.8 and 0.1, respectively. Sample DO117 was used as parental composition for the Dolomitic basalts and sample CB17 (clinopyroxenite; Bonadiman et al. Reference Bonadiman, Coltorti and Siena1994) was used for the intrusive complex of Mount Monzoni. For the sample FS1 from the Carnic Alps, we assumed the same parental composition as for the Dolomitic basalts.
The isotopic composition (recalculated to 230 Ma) of the Permian granite of Cima d’Asta (87Sr/86Sr = 0.71485; 143Nd/144Nd =0.51198; Rb = 156 ppm, Sr = 147 ppm, Sm = 3.99 ppm, Nd =17.63 ppm; Rottura et al. Reference Rottura, Bargossi, Caggianelli, Del Moro, Visonà and Tranne1998) was taken as representative of the Permian acid magmatic rocks and their crustal source rocks. In this case, the AFC model suggests fractionation (F) values of 0.3 for the Dolomitic basalts, which corresponds to 9% of contamination. For the sample F2C (Basaltic dyke from Monzoni; Bonadiman et al. Reference Bonadiman, Coltorti and Siena1994) and for the FS1 basalt from the Carnic Alps F would be 0.7, which corresponds to 21% contamination. However, a fractionation of 70% is excessively high and not completely justified by the major-element composition of the magmas, which should be much more evolved. For the sample F2C this might imply important carbonate rather than silicic contamination, while for the sample FS1, this could suggest either a higher rate of assimilated/fractionated mass or an excessively low 87Sr/86Sr assumed for the contaminant. Notably, sample FS1, which crops out far from the Dolomitic area, is the only sample that shows a chemical composition consistent with important silicic contamination, being the most silica-rich sample despite a relatively high Mg no., comparable with those of the other basalts. Moreover, basaltic rocks are rare in this area (this is the only selected sample), while the acid rocks are abundant.
As representative end-member of the Permian–Triassic carbonate sediments, we used the Permian–Triassic seawater (Korte et al. Reference Korte, Kozur, Bruckschen and Veizer2003) for the Sr isotopic composition and coeval conodonts for the Nd isotopic ratio (Shaw & Wasserburg, Reference Shaw and Wasserburg1985). We considered an Nd content of 2 ppm, calculated from the value proposed by Shaw & Wasserburg (Reference Shaw and Wasserburg1985). Two possible Sr contents have been used: 12 250 ppm and 2941 ppm. The first is taken from an analysed carbonate of the endo-skarn in Toal de Mason, Monzoni area, Dolomites, and the second is taken from a Triassic carbonate of the Angolo formation, Val Camonica, Lombardy (Faure et al. Reference Faure, Assereto and Tremba1978). The results shown in Figure 7 highlight the effects of carbonate assimilation on the Sr isotopic composition, while Nd isotopic ratios are essentially unchanged by carbonate assimilation. The results suggest an assimilation of about 5% carbonates for the basaltic suite from the Dolomites and 10% for sample F2C of Bonadiman et al. (Reference Bonadiman, Coltorti and Siena1994; Monzoni area). Such degrees of contamination should not significantly affect the major-element composition of the basaltic suite. The high 87Sr/86Sri of sample FS1 (Carnic Alps) would instead require as much as 20% of carbonate assimilation, which is an unlikely high value considering the major-element composition of this sample and its palaeogeographic position, which was far from the Triassic carbonate platforms.
The 206Pb/204Pb v. 87Sr/86Sr(i) diagram of Figure 10 shows two end-member compositions represented by the lamprophyre PR107 and by the basalt FC29. The basalt FC13 plots halfway between these two composition plots, from which other Dolomitic basalts evolve to higher 87Sr/86Sr values at near-constant 206Pb/204Pb. The high Sr content, high 87Sr/86Sr and low Pb content expected for the Permo-Triassic carbonates suggest that these 87Sr/86Sr variations at virtually constant 206Pb/204Pb could be related to contamination by carbonates during magma emplacement. This is also supported by the composition of sample FC18, which shows the highest 87Sr/86Sri and crops out close to the Monzoni area, where there is evidence of widespread carbonate–magma interaction.
206Pb/204Pb with 87Sr/86Sri diagram. The arrow shows the trend towards the 87Sr/86Sri values of Permian–Triassic carbonates (Korte et al. Reference Korte, Kozur, Bruckschen and Veizer2003), assuming its 206Pb/204Pb contribution is irrelevant. Symbols as in Figure 4.

The fact that the lamprophyre dyke PR107, which cuts the mineralized volcanics of the Bedovina mine, shows Pb isotopic ratios similar to the host rocks (Fig. 8), could suggest contamination of the lamprophyres by Pb-rich hydrothermal fluids. However, its PM-normalized trace-element pattern shows a negative Pb anomaly, in contrast with possible contamination by Pb-rich fluids. It is therefore more likely that the Pb isotopic feature of the lamprophyres was inherited from the mantle source.
Based on Sr, Nd and Pb isotope data, we therefore suggest that magma–crust interaction in the Dolomites was limited to <5% of carbonate contamination for the basaltic lava flows, dykes and sills, and could reach up to 10% for the plutonic complex of Mount Monzoni. Similar values have been suggested by Casetta et al. (Reference Casetta, Coltorti, Ickert, Bonadiman, Giacomoni and Ntaflos2018 a) for the Predazzo intrusive complex. No significant interaction with silicic crustal material is required. On the other hand, in the Carnic Alps the rare basaltic magmas instead record contamination by silicic crust, which could have reached 20%. We note that this high value does not necessarily imply 20% of assimilation of crustal material and can also be related to an inappropriate initial assumption regarding the composition of the host rocks in which the magmas were emplaced.
A possible schematic model that would explain the differences between the magmas of the Dolomites and those of the Carnic–Julian areas is shown in Figure 11. Since the crust of the Dolomitic area suffered large amounts of acid magma extraction during the Permian period (i.e. Brixen granite, Cima d’Asta granite and the Atesina intermediate–acidic explosive and effusive volcanic products; Bellieni et al. Reference Bellieni, Fioretti, Marzoli and Visonà2010; Fig. 1), it is reasonable to assume that the local crust was geochemically depleted and refractory during the Triassic period. This would explain not only the irrelevant or minor silicic contamination of the basaltic magmas in the Dolomitic area, but also the scarce acid magmatic manifestations in the Dolomitic area, represented only by the Predazzo granite, a small sub-intrusive complex cropping out at the boundary of the Monzoni area (Casetta et al. Reference Casetta, Coltorti, Ickert, Bonadiman, Giacomoni and Ntaflos2018 a, b). Notably, this contrasts with the evolution of the Carnic–Julian Alps, where there is no evidence of melting events in Permian times; the presence of a fertile crust during the Triassic period is therefore more likely. This would in turn explain the higher degree of silicic contamination recorded in the rare basaltic lava flows and the predominance of acidic–pyroclastic manifestations in this area.
Schematic cross-section that tentatively explains the bimodal magmatism (basaltic suite and ignimbrites) that occurred in the Dolomites and Carnic Alps (Southern Alps) during Ladinian–Carnian time. It is suggested that the crust beneath the Dolomites area was more refractory with respect to that beneath the area of Carnic and Julian Alps, which would explain the prevalent basic magmatism for the former. Depths of magmatic processes in the mantle are not well constrained; the vertical scale therefore shows only the inferred values.

10.c. Characteristics of the mantle source(s)
Despite the absence of primary basalts, some geochemical features of the basaltic suite from the Dolomites can still give relevant information about the nature of the mantle source(s). The high-pressure and -temperature melting experiments of Conceição & Green (Reference Conceição and Green2004) demonstrate that shoshonitic melts can be produced by decompression melting of phlogopite- and pargasite-bearing lherzolites at P c. 1–2 GPa and T in the range 1050–1150°C. No robust experimental constraints are known for the genesis of amphibole-bearing lamprophyres, but previous work suggests that similar magmas might originate by low-degree melting of similar mantle domains, but at higher pressures (≥3 GPa), possibly at the asthenosphere–lithosphere boundary (Foley, Reference Foley1990; Tappe et al. Reference Tappe, Folet, Jenner, Heaman, Kjarsgaard, Romer, Stracke, Joyce and Hoefs2006). This boundary marks the transition between a porous and a channelized flow regime where fluid-rich melts may be forced to crystallize because of their low heat capacity (Tappe et al. Reference Tappe, Folet, Jenner, Heaman, Kjarsgaard, Romer, Stracke, Joyce and Hoefs2006).
The PM-normalized trace-element compositions of the basaltic suite indicate that their mantle source was enriched in LILE, LREE and volatiles. The Sr and Nd isotopic data of the less-contaminated samples of the basaltic suite and lamprophyres plot from MORB towards EMI-like composition. In addition, the Pb isotopic data suggest an enrichment in EMII or GLOSS components (Fig. 8). These isotopic compositions could have been acquired by interaction of the source with fluids derived by possible underlying subducting slab, as also suggested by the negative Nb anomalies and positive Pb anomalies. On the other hand, the lamprophyres show no Nb anomalies in multi-element PM-normalized diagrams (Fig. 6). Experimental work shows that the partition coefficient of Nb between slab-derived fluids and clinopyroxene is very low at pressures of 1–2 GPa, but increases at higher pressures (Baier et al. Reference Baier, Audétat and Keppler2008). This means that the relative Nb content in the metasomatized mantle section would increase with pressure. This might explain the difference in negative anomalies between the basaltic suite and the lamprophyres, which likely generated at pressures of 1–2 GPa and >3 GPa, respectively.
Given these considerations, we speculate that possible mantle-type sources of these magmas are the phlogopite- and phlogopite+amphibole-bearing peridotites similar to those from the Finero and Ulten complexes (Fig. 1; Zanetti et al. Reference Zanetti, Mazzucchelli, Rivalenti and Vannucci1999; Tumiati et al. Reference Tumiati, Thöni, Nimis, Martin and Mair2003, Scambelluri et al. Reference Scambelluri, Rampone, Braga and Malaspina2010). It is worth noting that the metasomatism in the Finero peridotites is believed to have occurred during the Variscan orogenesis, and the Ulten complex is considered the mantle wedge associated with a subduction that occurred during the same orogenesis, that is, about 100 Ma before the Carnian magmatism in the Southern Alps.
Casetta et al. (Reference Casetta, Ickert, Mark, Bonadiman, Giacomoni, Ntaflos and Coltorti2019) suggest that the magmatic (lamprophyric and basaltic) pulses at c. 220 Ma represent a transition to a mantle source less contaminated by subducted components with respect to magmatism at c. 235 Ma. This interpretation is based on: (1) the depleted isotopic signature of the Predazzo lamprophyre (c. 220 Ma) with respect to Predazzo intrusive complex magmas (c. 235 Ma); (2) the presence of a negative Nb anomaly in the Predazzo intrusive complex magmas and the absence of the same anomaly in the lamprophyres; and (3) the fact that the c. 220 Ma basaltic rocks from Brescian Alps indicate a tholeiitic affinity according to Cassinis et al. (Reference Cassinis, Cortesogno, Gaggero, Perotti and Buzzi2008). However, these three arguments do not consider that: (1) the lamprophyre from Marmolada (our sample DO123), which shows generally similar geochemical composition and might be coeval with the Predazzo lamprophyres, shows a more enriched isotopic signature, plotting close to the less-contaminated samples of the Basaltic suite (in addition, the c. 238 Ma basic rocks form Karawanke also plot in the depleted isotopic field); (2) Nb negative anomalies are present in the samples of both magmatic pulses (c. 220 Ma and c. 235 Ma; Visonà & Zanferrari, Reference Visonà and Zanferrari2000; De Min et al. Reference De Min, Jourdan, Marzoli, Renne and Juračič2009; Miller et al. Reference Miller, Thöni, Goessler and Tessadri2011; see also Fig. 6); and (3) the tholeiitic affinity of the samples at c. 220 Ma does not require a source that is more depleted, but can also be explained by melting at shallow pressure by lithospheric thinning, which could be consistent with an incipient extensive system.
10.d. On the geodynamic setting of Triassic magmatism in the Southern Alps
In the light of the recent literature and the new data presented in this work, we discuss the two main geodynamic scenarios suggested for the origin of Triassic magmatism in Southern Alps and propose a possible solution.
10.d.1. A Triassic back-arc is not required in northern Adria
The hypothesis of a back-arc at the margins of the Adria Plate during the Permian and Triassic periods has mainly been driven by the suggested presence of a N-wards subduction south of Adria (Fig. 2a), high subsidence rates recorded in the Triassic sedimentary units of the Dolomites and the geochemical affinity of some of the magmatic rocks with present-day subduction-related products (Stampfli et al. Reference Stampfli, Borel, Marchant, Mosar, Rosenbaum and Lister2002, Reference Stampfli, Vavassis, De Bono, Rosselet, Matti and Bellini2003; Armienti et al. Reference Armienti, Corazzato, Groppelli, Natoli and Pasquare2003; Csontos & Vörös, Reference Csontos and Vörös2004; Stampfli, Reference Stampfli and Finett2005; Doglioni & Carminati, Reference Doglioni and Carminati2008; Zanetti et al. Reference Zanetti, Mazzucchelli, Sinigoi, Giovanardi, Peressini and Fanning2013).
The lines of evidence for a subduction of the Palaeotethys south of Adria during the Triassic period are scarse and poorly constrained. The main evidence used by Stampfli et al. (Reference Stampfli, Vavassis, De Bono, Rosselet, Matti and Bellini2003) and Csontos & Vörös (Reference Csontos and Vörös2004) is the occurrence of pelagic sediments from the Sicanian basin in Sicily (e.g. Catalano et al. Reference Catalano, Di Stefano and Kozur1991). These sediments, despite possibly testifying the presence of the Palaeotethys south of Adria during the Triassic period, do not imply its subduction. Based on the more recent work of Schettino & Turco (Reference Schettino and Turco2011), this oceanic sector (Ionian Basin in Fig. 2a) was a closed oceanic remnant that did not undergo any subduction in the Triassic period. For Csontos & Vörös (Reference Csontos and Vörös2004), other lines of evidence for a subduction are the suspect occurrence of a turbidite in the High Karst platform (Aubouin et al. Reference Aubouin, Blanchet, Cadet, Celet, Charvet, Choro-witz, Cousin and Rampnoux1970) and the occurrence of Triassic calc-alkaline volcanism in the Dinaric and Hellenic chain. The latter cannot be used as proof of a subduction; some other authors (Pamić, Reference Pamić1984; Pe-Piper, Reference Pe-Piper1998) actually related this volcanism to the Triassic intra-Pangea rifting. More importantly, in the area around Adria there is no solid evidence, such as ophiolite masses, accretionary prims, metamorphism or diffuse intermediate (andesitic) magmatism, for a subduction in the Triassic period. The closest findings are some fore-arc-type sequences found in Crete and Turkey (Stampfli et al. Reference Stampfli, Vavassis, De Bono, Rosselet, Matti and Bellini2003).
The high subsidence rate (600 m Ma–1) recorded in the Triassic units of the Dolomites (Goldhammer et al. Reference Goldhammer, Dunn and Hardie1990) has been suggested to be indicative of back-arc basins (Doglioni & Carminati, Reference Doglioni and Carminati2008). However, along the eastern coast of the USA and in western Morocco, subsidence rates reached up to c. 800 m Ma–1 during the Upper Triassic period in a clearly extensional setting related to the break-up of Pangea (cf. Olsen, Reference Olsen1997; Olsen et al. Reference Olsen, Kent, Et-Touhami, Puffer, Hames, McHone, Renne and Ruppel2003). This implies that high subsidence rates may also be associated with the development of passive margins and therefore cannot be used as evidence of a back-arc basin.
The main geochemical features of the magmas that led some authors (e.g. Castellarin et al. Reference Castellarin, Lucchini, Rossi, Selli and Simboli1988; Stampfli et al. Reference Stampfli, Borel, Marchant, Mosar, Rosenbaum and Lister2002; Armienti et al. Reference Armienti, Corazzato, Groppelli, Natoli and Pasquare2003; Doglioni & Carminati, Reference Doglioni and Carminati2008) to suggest a coeval subduction are the shoshonitic affinity and the negative Nb and Ti anomalies shown in PM-normalized trace-element patterns. To draw their interpretations, these authors considered such features as ubiquitous, but this is not the case for the Southern Alps and Alcapa. They are indeed not shown by the coeval Karawanken basic igneous rocks (e.g. Miller et al. Reference Miller, Thöni, Goessler and Tessadri2011). Moreover, the c. 15 Ma younger magmatic rocks show either negative (basaltic rocks from the Adriatic domain; De Min et al. Reference De Min, Jourdan, Marzoli, Renne and Juračič2009) or positive Nb v. La anomalies (Dolomitic lamprophyres in this work and in Casetta et al. Reference Casetta, Ickert, Mark, Bonadiman, Giacomoni, Ntaflos and Coltorti2019). In addition, the shoshonitic affinity and Nb and Ti anomalies do not necessarily imply a coeval subduction (Müller et al. Reference Müller, Rock and Groves1992; Li et al. Reference Li, Arndt, Tang and Ripley2015). For example, magmatic products similar to the Triassic units from the Dolomites are also found associated with extensional tectonic regimes emplaced on mobile belts that underwent subduction events in the past (e.g. Comin-Chiaramonti et al. Reference Comin-Chiaramonit, Cundari, Piccirillo, Gomes, Castorina, Censi, De Min, Marzoli, Speziale and Velázquez1997; De Min et al. Reference De Min, Callegaro, Marzoli, Nardy, Chiaradia, Marques and Gabbarrini2018).
The recent database used by Li et al. (Reference Li, Arndt, Tang and Ripley2015) to test the reliability of tectono-magmatic diagrams has been used here to determine whether the Triassic igneous rocks from the Southern Alps and Alcapa show any affinity with back-arc magmatism. For consistency with this database, we plotted only the basaltic and gabbroic samples with MgO > 4 wt%. Figure 12 shows the results for the Zr–Y–Ti and the Th/Yb v. Nb/Yb diagrams, in which the fields for some tectonic settings defined by Li et al. (Reference Li, Arndt, Tang and Ripley2015) are reported. Despite the large overlap between these fields, the results indicate that none of the samples considered here plot in the fields defined by back-arc basalts. In both diagrams, the closest similarities to our samples are with either island-arc basalts or continental-arc basalts. Given that the extensional tectonics and the high subsidence and sedimentation rates in the Dolomites during the Triassic period are not compatible with an active subduction underneath the study area, these trace-element signatures must have been inherited from some previous subduction event affecting the mantle source of the magmas. These results not only confirm that a back-arc setting is not required to explain the geochemistry of the magmas, but even suggest that this is the less-probable geodynamic setting that would produce magmas with the observed trace-element features.
Trace-element discrimination diagrams for the basaltic suite from the Dolomites and Carnic Alps (this work) and gabbros from the Karawanken complex (Miller et al. Reference Miller, Thöni, Goessler and Tessadri2011). BABB – back-arc basalts; CAB – continental arc basalts; CFB – continental flood basalts; IAB – island-arc basalts; OIB – ocean-island basalts. Contour fields are after Li et al. (Reference Li, Arndt, Tang and Ripley2015). Symbols as in Figure 7.

10.d.2. Triassic magmatism as an early stage of Pangea break-up
The available geological and petrological evidence leads us to suggest that the Triassic magmatism from the Southern Alps did not emplace in an arc or a back-arc setting. Rather, it was likely triggered by the extensional and transtensional tectonics related to the same rifting system that superimposed the intra-Pangea dextral shear (Muttoni et al. Reference Muttoni, Gaetani, Kent, Sciunnach, Angiolini, Berra, Garzanti, Mattei and Zanchi2009), and later caused the opening of the Alpine Tethys (e.g. Bortolotti & Principi, Reference Bortolotti and Principi2005; Schettino & Turco, Reference Schettino and Turco2011) and the break-up of Pangea during Early Jurassic time (Olsen, Reference Olsen1997; Schlische et al. Reference Schlische, Withjack, Olsen, Hames, McHone, Renne and Ruppel2003; Fig. 13). The subduction signatures of the magmas (Figs 6, 12) were probably inherited from the subduction events that occurred during the Variscan or even older orogenic cycles (Greenvillian?), as already suggested by some other authors (Crisci et al. Reference Crisci, Ferrara, Mazzuoli and Rossi1984; Sloman, Reference Sloman1989; Bonadiman et al. Reference Bonadiman, Coltorti and Siena1994; Beccaluva et al. Reference Beccaluva, Coltorti, Saccani, Siena, Zeda and Finetti2005; Lustrino et al. Reference Lustrino, Abbas, Agostini, Caggiati, Carminati and Gianolla2019). This interpretation is supported by the model ages (TDM(Nd)) calculated in this work (345–1200 Ma) and the geochemistry and ages of zircons collected in the middle-Triassic volcaniclastics in the Southern and Eastern Alps (Beltràn-Triviño et al. Reference Beltràn-Triviño, Winkler, Von Quadt and Gallofer2016). In addition, the Finero and Ulten peridotites (Fig. 1), which might represent a source type for the basaltic suite in the Southern Alps, show evidence of Variscan subduction events at the northern margin of Adria (Zanetti et al. Reference Zanetti, Mazzucchelli, Rivalenti and Vannucci1999; Tumiati et al. Reference Tumiati, Thöni, Nimis, Martin and Mair2003; Scambelluri et al. Reference Scambelluri, Rampone, Braga and Malaspina2010).
Tentative palaeogeographical position of the Ladinian–Carnian magmatism (black circles) that today crops out in Calabria (Liberi et al. Reference Liberi, Piluso and Langone2011), Sardinia (Traversa & Vaccaro, Reference Traversa and Vaccaro1992), Southern and Eastern Alps (Crisci et al. Reference Crisci, Ferrara, Mazzuoli and Rossi1984; Castellarin et al. Reference Castellarin, Lucchini, Rossi, Selli and Simboli1988; Gianolla, Reference Gianolla1992; Visonà and Zanferrari, Reference Visonà and Zanferrari2000; Zanetti et al. Reference Zanetti, Mazzucchelli, Sinigoi, Giovanardi, Peressini and Fanning2013) and Dinarides (Pamić, Reference Pamić1984). Blue circles show some outcrops of the more recent (201 Ma) Central Atlantic Magmatic Province, that is, La Balma–Monte Capio, Ivrea–Verbano zone (Denyszyn et al. Reference Denyszyn, Fiorentini, Maas and Dering2018) and Algarve, Spain (Callegaro et al. Reference Callegaro, Rapaille, Marzoli, Bertrand, Chiaradia, Reisberg, Bellieni, Martins, Madeira, Mata, Youbi, De Min, Azevedo and Bensalah2014). Red shaded areas show the main rifting and thinning events that occuraded during 200–185 Ma (after Schettino & Turco, Reference Schettino and Turco2011) Note that the first rifting stages around Adria started as early as during Anisian time (e.g. Bortolotti & Principi, Reference Bortolotti and Principi2005). Plate reconstructions are after Schettino &Turco (Reference Schettino and Turco2011). Other unit names and lines as in Figure 2.

Following the review of Beccaluva et al. (Reference Beccaluva, Coltorti, Saccani, Siena, Zeda and Finetti2005) and the plate reconstructions of Schettino & Turco (Reference Schettino and Turco2011), we suggest that the Upper Triassic rifting events in southern Europe could explain not only the Triassic magmatism in the Southern Alps, but also the coeval magmatism in Sardinia, western Alcapa and Dinarides, and possibly the Calabrian–Peloritani unit. These were all located at the margins of Adria during Triassic time and they all possibly represent magmatic episodes associated with first incipient rifting along these margins. The suggested palaeogeographic positions of these magmatic suites and their relations with the main geodynamic events are tentatively drawn in Figure 13. Such a scenario does not imply similar geochemical affinities and mantle sources for all the erupted magmas, since the different sectors of the Adria lithosphere might have been affected by different processes during the previous tectono-magmatic events (e.g. Visonà & Zanferrari, Reference Visonà and Zanferrari2000).
Age data of the magmatic products at the margins of Adria constrain the peak of the magmatic activity to 242–235 Ma (e.g. Cassinis & Zezza, Reference Cassinis, Zezza, Castellarin and Vai1982; Pamić, Reference Pamić1984; Vaccaro et al. Reference Vaccaro, Atzori, Del Moro, Oddone, Traversa and Villa1991; Laurenzi et al. Reference Laurenzi, Visonà and Zantedeschi1994; Visonà & Zanferrari, Reference Visonà and Zanferrari2000; Stähle et al. Reference Stähle, Frenzel, Hess, Saupe, Schmidt and Schneider2001; Liberi et al. Reference Liberi, Piluso and Langone2011; Zanetti et al. Reference Zanetti, Mazzucchelli, Sinigoi, Giovanardi, Peressini and Fanning2013; Beltràn-Triviño et al. Reference Beltràn-Triviño, Winkler, Von Quadt and Gallofer2016; Storck et al. Reference Storck, Brack, Worzlaw and Ulmer2019), with minor pulses at about 215–220 Ma (e.g. Stähle et al. Reference Stähle, Frenzel, Hess, Saupe, Schmidt and Schneider2001; Cassinis et al. Reference Cassinis, Cortesogno, Gaggero, Perotti and Buzzi2008; Casetta et al. Reference Casetta, Ickert, Mark, Bonadiman, Giacomoni, Ntaflos and Coltorti2019) and 192–187 Ma (Galli et al. Reference Galli, Grassi, Sartori, Gianola, Burg and Schmidt2019). However, U–Pb zircon ages of the deep crustal intrusions from Finero (e.g. Zanetti et al. Reference Zanetti, Mazzucchelli, Sinigoi, Giovanardi, Peressini and Fanning2013; Schaltegger et al. Reference Schaltegger, Ulianov, Müntener, Ovtcharova, Peytcheva, Vonlanthen, Vennemann, Antognini and Girlanda2015; Langone et al. Reference Langone, Padrón-Navarta José, Ji, Zanetti, Mazzucchelli, Tiepolo, Giovanardi and Bonazzi2017, Reference Langone, Zanetti, Daczko, Piazolo, Tiepolo and Mazzucchelli2018) show that, at least in some regions, the lower crust at the margins of Adria was affected by a long-lasting cycle of heating pulses from early Permian to Early Jurassic time. These pulses were coeval with the widespread extensional tectonics recorded all over Adria (e.g. Bortolotti & Principi, Reference Bortolotti and Principi2005). The peak age of the magmatic events, the long-lasting heating and thinning cycle, and the position of Adria in the Pangea supercontinent all suggest that Triassic magmatism at the margins of Adria is an expression of a major loss of heat accumulated beneath Pangea since its amalgamation. Based on Veevers (Reference Veevers1989), such a loss of heat occurred at 230 ± 5 Ma.
As shown by Schettino & Turco (Reference Schettino and Turco2011), the rifting on the northeastern margin of Adria (i.e. Dinarides, Southern Alps and Alcapa) was aborted in the Jurassic period, but on the western margin it developed in a spreading centre, forming the Alpine Tethys, which was connected to the central rifting in the Atlantic (Schettino & Turco, Reference Schettino and Turco2011, fig. 1D) that caused the break-up of Pangea. Notably, the related Central Atlantic Magmatic Province (CAMP; peak activity at 201 Ma, average 200 Ma; Marzoli et al. Reference Marzoli, Renne, Piccirillo, Ernesto, Bellieni and De Min1999), which took place c. 30 Ma after the peak magmatic episodes around Adria, possibly extends to the northwestern margins of Adria (Fig. 13; Denyszyn et al. Reference Denyszyn, Fiorentini, Maas and Dering2018). In addition, basalts of the CAMP show negative anomalies of Nb and Ti and are enriched in LILE and in isotopic composition (Callegaro et al. Reference Callegaro, Rapaille, Marzoli, Bertrand, Chiaradia, Reisberg, Bellieni, Martins, Madeira, Mata, Youbi, De Min, Azevedo and Bensalah2014, Reference Callegaro, Marzoli, Bertrand, Bichert-Toft, Reisberg, Cavazzini, Jourdan, Davies, Parisio, Bouchet, Paul, Schaltegger and Chiaradia2017; Merle et al. Reference Merle, Marzoli, Reisberg, Bertrand, Nemchin, Chiaradia, Callegaro, Jourdan, Bellieni, Kontak, Puffer and McHone2014; Marzoli et al. Reference Marzoli, Bertrand, Youbi, Callegaro, Merle, Reisberg, Chiaradia, Sarah, Jourdan, Zanetti, Davies, Cuppone, Mahmoudi, Medina, Renne, Bellieni, Crivellari, Hachimi, Bensalah, Meyzen and Tegner2019), showing some overlap with the rocks studied here. The subduction-like geochemical features are interpreted as being related to a mantle source enriched by Palaeozoic or Proterozoic subduction events (Callegaro et al. Reference Callegaro, Rapaille, Marzoli, Bertrand, Chiaradia, Reisberg, Bellieni, Martins, Madeira, Mata, Youbi, De Min, Azevedo and Bensalah2014, Reference Callegaro, Marzoli, Bertrand, Bichert-Toft, Reisberg, Cavazzini, Jourdan, Davies, Parisio, Bouchet, Paul, Schaltegger and Chiaradia2017; Merle et al. Reference Merle, Marzoli, Reisberg, Bertrand, Nemchin, Chiaradia, Callegaro, Jourdan, Bellieni, Kontak, Puffer and McHone2014; Marzoli et al. Reference Marzoli, Bertrand, Youbi, Callegaro, Merle, Reisberg, Chiaradia, Sarah, Jourdan, Zanetti, Davies, Cuppone, Mahmoudi, Medina, Renne, Bellieni, Crivellari, Hachimi, Bensalah, Meyzen and Tegner2019). Overall, these considerations lead us to suggest that the Triassic magmatism and the associated heating pulses recorded in the lithosphere of Adria were a forerunner of the future break-up of Pangea.
11. Conclusions
The basaltic suite, lamprophyres and ignimbrites included in the Ladinian–Carnian units of the Dolomites and Carnic–Julian Alps represent part of the magmatic events that affected the northern margin of Adria in the period between the amalgamation and break-up of Pangea. Before emplacement in the upper crust and eruption to the surface, the basaltic magmas from the Dolomites underwent differentiation at depths of mostly 14–20 km, dominated by crystallization of clinopyroxene and only marginally affected by crustal contamination. Similar depths are estimated for the rare basaltic occurrences in the Carnic Alps; however, these show Sr–Nd isotopic compositions suggesting higher degrees of contamination. We infer that this difference is related to a restitic nature of the crust in the areas of the Dolomites and a more fertile crust in the Carni–-Julian Alps, which might also explain the production of Triassic rhyolites (ignimbrites) by crustal melting in the Carnic–Julian Alps only.
The shoshonitic affinity and trace-element signatures of the basaltic suite and the occurrence of lamprophyres can be explained by different melting episodes of a mantle source that was variably metasomatized during the Variscan orogenic cycle. This supports some previous interpretations, not only for the magmatic rocks from the same localities (e.g. Sloman, Reference Sloman1989; Bonadiman et al. Reference Bonadiman, Coltorti and Siena1994) but also for the other outcrops in the Southern Alps (e.g. Crisci et al. Reference Crisci, Ferrara, Mazzuoli and Rossi1984; Beccaluva et al. Reference Beccaluva, Coltorti, Saccani, Siena, Zeda and Finetti2005; Beltràn-Triviño et al. Reference Beltràn-Triviño, Winkler, Von Quadt and Gallofer2016; Lustrino et al. Reference Lustrino, Abbas, Agostini, Caggiati, Carminati and Gianolla2019). The emplacement of coeval magmas that do not show the typical orogenic signatures for the trace elements (e.g. gabbroic intrusive complex in the Karawanken; Visonà & Zanferrari, Reference Visonà and Zanferrari2000) can be explained by the presence of a heterogeneous mantle source beneath Adria. We support the view of Visonà & Zanferrari (Reference Visonà and Zanferrari2000), who suggested that this might reflect the complex structure of the Adriatic lithosphere, which likely formed by amalgamation of different tectonic units that underwent different geodynamic processes during the Palaeozoic era (e.g. von Raumer, Reference von Raumer1998).
Given the above scenario and the absence of any solid geological evidence for a subduction zone in the surroundings of Adria, a back-arc setting is not required to explain the subduction-related signatures of the magmas. Rather, the widespread occurrence of extensional and transtensional tectonics, most likely connected to the Triassic–Jurassic rifting system in the central Atlantic, strongly suggests that the magmatism took place as a consequence of lithosphere thinning and mantle upwelling, which can be related to the loss of heat accumulated beneath Pangea after its amalgamation. This scenario would explain not only the origin of Triassic magmatism in the Southern Alps, but also the occurrences in Calabria, Sardinia, Karawanken and Dinarides.
Acknowledgments
We thank Lorenzo Furlan and Leonardo Tauro for sample preparation and Raul Carampin for microprobe analyses. Riccardo Petrini and Francesca Slejko are thanked for help with the thermal ionization mass spectrometry (TIMS) analyses at the University of Trieste. We thank Kathryn Goodenough for the editorial handling and two anonymous reviewers for their constructive comments. The project has been partially funded by the Italian research program PRIN 20178LPCP. Luca Ziberna acknowledges the Alexander von Humboldt Foundation.
Supplementary material
To view supplementary material for this article, please visit https://doi.org/10.1017/S0016756820000084