





Global food consumption patterns have changed substantially over the past 30 years, with dietary patterns shifting towards energy-dense, highly processed foods rich in animal products(Reference Rockström, Thilsted and Willett1,Reference Willett, Rockström and Loken2) . These changes contribute to rising non-communicable diseases and environmental degradation(Reference Rockström, Thilsted and Willett1). Therefore, achieving sustainable and healthy diets is essential to meet global climate and health goals(Reference Rockström, Thilsted and Willett1). Healthy diets are characterised by a high consumption of plant-based foods, moderate consumption of animal-source products, low levels of saturated fat and limited amounts of highly processed foods and added sugars(Reference Rockström, Thilsted and Willett1,Reference Willett, Rockström and Loken2) . Shifting towards healthier diets could prevent millions of deaths worldwide and reduce environmental pressures(Reference Rockström, Thilsted and Willett1,Reference Willett, Rockström and Loken2) .
In the Netherlands, dietary changes have improved some aspects of diet quality but have not consistently reduced environmental impacts. A Dutch longitudinal study found that Dutch Healthy Diet (DHD15)-index scores increased by 11 % in men and 13 % in women, mainly due to greater consumption of fish and nuts, seeds and nut pastes(Reference Biesbroek, Verschuren and Boer3). However, energy-adjusted dietary greenhouse gas emission (GHGE) increased by 5 % in men and remained unchanged in women, partly reflecting greater consumption of fish, nuts, seeds, poultry and beef(Reference Biesbroek, Verschuren and Boer3). More broadly, most adults still do not adhere to the national dietary guidelines, with fruit and vegetable consumption remaining below recommended levels and red and processed meat consumption exceeding recommendations(4,5) . These dietary patterns are associated with an increased risk of cardiovascular disease, several cancers and type 2 diabetes, as well as higher all-cause mortality(Reference Abete, Romaguera and Vieira6–Reference Aune, Giovannucci and Boffetta11). At the same time, food consumption accounts for nearly 40 % of the Dutch land footprint and around 13 % of national GHGE(12). Diets high in meat and dairy products are particularly impactful, contributing to ∼50 % of food-related GHGE, requiring ∼80 % of agricultural land and placing substantial pressure on freshwater resources(Reference Vellinga, van de Kamp and Toxopeus13).
To address these challenges, the Health Council of the Netherlands(14) recommends shifting protein intake from an estimated 60:40 ratio of animal-source to plant-source protein to at least 50:50 by 2030, and ultimately to 40:60. This shift requires reducing meat consumption, keeping dairy products and fish consumption within recommended amounts and increasing the consumption of legumes and nuts(14). Implementing this shift is expected to substantially lower food-related environmental impacts, as diets containing at least 60 % plant-based protein are associated with ∼25 % lower GHGE and land use(5,14) .
Importantly, dietary changes can affect different environmental outcomes in different ways. A Dutch study found that healthier dietary patterns were associated with lower GHGE but higher blue water consumption, largely due to increased consumption of nuts, vegetables and fruit(Reference Vellinga, van de Kamp and Toxopeus13). Similarly, a systematic review found that dietary patterns designed to improve sustainability reduced GHGE by an average of 25·8 % but often increased water use(Reference Jarmul, Dangour and Green15). Assessing dietary sustainability therefore requires consideration of both GHGE and blue water consumption.
In addition, shared historical and sociocultural experiences may contribute to differences in dietary behaviours between generations(Reference Öner, Durmuş and Yaşar Fırat16). For example, research from Poland suggests that older generations tend to follow healthier and more environmentally friendly diets, while younger groups are more influenced by price and convenience, which can lead to less healthy and less sustainable choices(Reference Makowska, Boguszewski and Hrehorowicz17). Identifying how dietary patterns differ between generations may help inform targeted interventions, food policies and dietary guidelines aimed at promoting healthier and more sustainable food consumption. However, evidence on generational differences in diet quality and environmental impacts of diets in the Netherlands remains limited. Existing Dutch studies have examined wide age groups rather than generations, assessed limited dietary or environmental indicators, used broad food categories and often relied on older dietary data(Reference Biesbroek, Verschuren and Boer3,Reference Vellinga, van de Kamp and Toxopeus13,18) .
This study therefore aimed to examine generational differences in healthy and sustainable dietary patterns among Dutch adults using data from the 2018–2023 wave of the Doetinchem Cohort Study (DCS). Specifically, differences between generations were examined in (1) diet quality, assessed using the DHD15-index and the animal-to-plant protein ratio; (2) dietary environmental impact, assessed using life cycle assessment (LCA)-based indicators of GHGE and blue water consumption and (3) food group consumption patterns to identify dietary differences contributing to these overall measures.
Methods
Study population
The DCS is a population-based prospective cohort initiated between 1987 and 1991 in Doetinchem, the Netherlands(Reference Verschuren, Blokstra and Picavet19). A random sample of 12 405 adults aged 20-59 years was drawn from the municipal register to obtain a study population representative of the local population(Reference Verschuren, Blokstra and Picavet19). Of these, 7769 were selected for repeated follow-up examinations conducted approximately every 5 years(Reference Verschuren, Blokstra and Picavet19). Response rates during follow-up were 75–80 %(Reference Verschuren, Blokstra and Picavet19,Reference Picavet, Blokstra and Spijkerman20) . FFQ were collected in waves 2–4 and 7. We used wave 7 data for recent food consumption data. This study was conducted according to the guidelines laid down in the Declaration of Helsinki and all procedures involving human participants were approved by the Medical Ethics Committees of the Netherlands Organization of Applied Scientific Research and the University of Utrecht (wave 7 CCMO number NL63779·041·17). Written informed consent was obtained from all participants at each round. For this cross-sectional analysis, we excluded participants missing all dietary data (n 1428) or all socio-demographic/lifestyle data (n 7). Missing data for potential confounders (< 5 % for smoking, educational level and physical activity) were imputed using the most frequent category to reduce potential bias due to missing data. After exclusions, 2348 participants remained for analysis.
Dietary assessment
Dietary intake was assessed using the semi-quantitative FFQ-NL, developed by Wageningen University & Research and adapted for wave 7 (2018–2023)(Reference Sluik, Geelen and de Vries21). The FFQ comprised eighty-three food and beverage items covering major food groups, including grain-based products, bread toppings, meat and meat substitutes, fish, dairy products, vegetables, fruit, snacks and alcoholic and non-alcoholic beverages. Habitual intake over the previous year was assessed by combining consumption frequency with usual portion size, with additional questions on food type and preparation. The FFQ has been validated against 24-hour recalls and biomarkers(Reference Sluik, Geelen and de Vries21). Energy and nutrient intakes were calculated using the Dutch Food Composition Table(22).
Dutch Healthy Diet-15 index
Diet quality was assessed using the DHD15 index, which measures adherence to the 2015 Dutch food-based dietary guidelines(Reference Looman, Feskens and de Rijk23). The index comprises fifteen components representing adequacy, moderation, optimum intake ranges and qualitative dietary choices(Reference Looman, Feskens and de Rijk23). Higher DHD15 index scores are associated with higher intakes of fibre, vitamins and minerals, and lower intakes of energy, saturated fat, added sugar and animal protein(Reference Looman, Feskens and de Rijk23). Higher adherence has also been associated with lower risks of type 2 diabetes and all-cause mortality(Reference Biesbroek, Verschuren and Boer24,Reference den Braver, Rutters and van der Spek25) . The DHD15 index is therefore a robust measure of diet quality tailored to the Dutch context.
Coffee was excluded from the index because the FFQ-NL did not distinguish filtered from unfiltered coffee. Additionally, salt was excluded because the FFQ-NL did not include the salt content of individual food items or added salt. For poultry, foods were classified as processed when coded as cold cuts or (cooked) liver and otherwise as unprocessed. The whole grains component was also adapted because the FFQ did not fully distinguish wholegrain from refined grain products. Therefore, this component included only high-fibre and low-fibre bread. We derived component intakes (g/d) from the FFQ and scored them according to the component-specific DHD15 criteria (Appendix 1), with scores ranging from 0 to 10 points depending on the degree of adherence to each guideline. The total score comprised 13 components and ranged from 0 to 130, with higher scores indicating better adherence.
Animal-to-plant protein ratio
The animal-to-plant protein ratio was calculated to assess the balance between animal and plant protein sources in the diet. Following RIVM methodology(18), mixed product groups (e.g., cakes, snacks, sauces and sweets) and beverages other than dairy products were excluded. Minor cross-over ingredients (e.g., milk in a currant bun or breadcrumbs in a meat ball) were not treated separately and remained within their main food group. This categorisation is consistent with the food group categories described in Appendix 2. The ratio was calculated as the percentage of total protein derived from animal v. plant sources.
Environmental impact
To assess food group contributions to environmental impact, foods were categorised into detailed groups based on previous Dutch studies (Appendix 2)(Reference Biesbroek, Verschuren and Boer3,18,28) . These categories were more detailed than those used for the DHD15 index to capture aspects relevant to the Dutch health and protein transition. For example, beef and pork were analysed separately, as was cheese from other dairy products.
Environmental impacts were assessed by linking FFQ items to LCA data from the RIVM database ‘Milieubelasting Voedingsmiddelen’, which covers ∼400 commonly consumed foods(18). For foods without an LCA value, estimates were derived from comparable products based on production characteristics in collaboration with co-author RV. The LCA methodology follows international ISO 14040/14044 standards using standardized life cycle inventories from Blonk Consultants and impact assessment with ReCiPe-2016 in SimaPro (version 9·5)(29,30) . A ‘cradle to consumption’ approach was applied, including agricultural production, processing, packaging, retail, storage, preparation by the consumer and both avoidable and unavoidable food waste(30). Transport between life cycle stages was included, except transport from supermarket to the consumer(30). Economic allocation was used for most products, whereas biophysical allocation was used for dairy products(30).
Two LCA indicators were used to quantify dietary environmental impact: GHGE (kg CO₂-equivalents/d) and blue water consumption (L/d). GHGE represents greenhouse gas emissions (GHGE) and their contribution to climate change. Blue water consumption represents water sourced from surface or groundwater and that is evaporated, incorporated into products, transferred to other watersheds, or discharged to the sea(Reference Vellinga, van de Kamp and Toxopeus13,18) . Individual environmental impact scores were calculated by multiplying food consumption (g/d) by the corresponding LCA value and summing across all foods.
Socio-demographic factors and lifestyle variables
Socio-demographic and lifestyle variables included age, sex (male/female), smoking, physical activity and educational level. Participants were categorised into three generational groups based on commonly used sociological classifications, adapted to the birth years represented in the study population: the Silent Generation (born 1930–1945), the Baby Boomers (born 1946–1964), or Generation X (born 1965–1975). Smoking was classified as never, former or current smoker. Physical activity level was assessed using the Cambridge Physical Activity Index and calculated by combining occupational and leisure-time physical activity(Reference Verschuren, Blokstra and Picavet19). Participants were categorised as inactive, moderately inactive, moderately active or active. Educational level was categorised as low (primary education, lower vocational education or advanced elementary education), medium (intermediate vocational education or higher secondary education) or high (higher vocational education or university education).
Statistical analysis
Definition of analytical variables
The main outcomes were diet quality, assessed using the DHD15 index score and the animal-to-plant protein ratio, and dietary environmental impact, assessed using GHGE and blue water consumption. Generation was the primary categorical exposure variable. A sex-by-generation interaction was tested and was significant for GHGE. To ensure consistent comparisons across outcomes, all analyses were stratified by generation and sex. Education level, smoking status, physical activity and total energy intake were selected a priori as potential confounders based on previous literature and subject-matter knowledge regarding their associations with age, sex, diet quality and dietary environmental impact(Reference Alves, Perelman and Chang31–Reference Yau, Adams and White33).
Descriptive statistics
Participant characteristics and dietary patterns were summarised as means ± sd for normally distributed continuous variables, medians (IQR) for non-normally distributed continuous variables and counts (%) for categorical variables. DHD15 index scores were reported as both absolute and energy-adjusted values. GHGE and blue water consumption were reported as both absolute values and per 4184 kJ (1000 kcal). The animal-to-plant protein ratio was analysed as a relative measure. Group differences were assessed using one-way ANOVA or Kruskal-Wallis tests for continuous variables and Pearson’s chi-square or Fisher’s exact tests for categorical variables, as appropriate.
Analytical statistics
Adjusted means and 95 % CI were estimated using ANCOVA models. For DHD15 index scores, Model 1 adjusted for educational level, smoking status and physical activity, whereas Model 2 additionally adjusted for total energy intake. For energy-standardised LCA indicators and the animal-to-plant protein ratio, Model 1 was applied. Food-group analyses were performed using fully adjusted ANCOVA models.
Multicollinearity among covariates was assessed using variance inflation factors, with all variance inflation factors below 1·2. Tukey-Kramer post hoc tests were used for pairwise comparisons between generational groups. For linear trend tests, generations were ordered chronologically from Generation X to Baby Boomers to the Silent Generation.
Model residuals were assessed for normality and homoscedasticity. To improve the distribution of the residuals, GHGE was square-root transformed, blue water consumption was log-transformed and protein contributions were arcsine square-root transformed. Estimated marginal means were back-transformed for presentation. Detailed results for all food groups are provided in the Supplementary Material. A two-sided P-value of ≤ 0·05 was considered statistically significant.
Software and tools
All statistical analyses were performed in R version 4.5.1, primarily using the dplyr, tidyr, car and emmeans packages.
Results
Socio-demographic, lifestyle, dietary and environmental characteristics
The study included 2348 participants (46 % male, 54 % female), with a mean age ranging from 56 years in Generation X to 84 years in the Silent Generation (Table 1). Educational levels differed significantly across generations, particularly among females, with low educational attainment most prevalent in the Silent Generation. Current smoking was more common in Generation X, while former smoking predominated in older generations and among males. Physical activity levels also varied: Baby Boomers most frequently reported being physically active, while the highest levels of inactivity were observed in the Silent Generation compared with other generations, especially among females.
Baseline socio-demographic, lifestyle, dietary and environmental characteristics by generation and sex

Table 1. Long description
The table presents data on socio-demographic and lifestyle factors, dietary characteristics, and environmental impact indicators for men and women across three generations: Generation X (1965-1975), Baby Boomers (1945-1965), and Silent Generation (1930-1945). The table has 10 rows and 18 columns. Column headers include characteristics, socio-demographic and lifestyle factors, dietary characteristics, and environmental impact indicators. Row labels include categories such as educational level, smoking status, physical activity level (PAL), total energy intake, animal-to-plant protein ratio, DHD15 index score, and environmental impact indicators. Each generation and sex category is represented with counts, percentages, and various statistical measures. Notable trends include variations in educational levels, smoking status, physical activity levels, and dietary characteristics across different generations and between sexes. Environmental impact indicators such as GHGE (greenhouse gas emissions) and blue water consumption are also compared across these groups.
Differences between groups were assessed using one-way ANOVA for normally distributed continuous variables, the Kruskal–Wallis test for non-normally distributed continuous variables and either Pearson’s chi-square test or Fisher’s exact test for categorical variables, depending on expected cell counts.
PAL, physical activity level; DHD15, Dutch Healthy Diet index; GHGE, greenhouse gas emission.
Median total energy intake varied across generations, ranging from 2450 kcal/d in Generation X males to 1750 kcal/d in Silent Generation females (Table 1). Among males, the proportion of protein derived from plant sources was highest in Generation X (38 %, sd 11), followed by Baby Boomers (37 %, sd 11) and the Silent Generation (35 %, sd 10), with borderline statistically significant differences across generations (P = 0·06). Among females, the proportion was similar across generations, at 36 % (sd 12) in both Generation X and Baby Boomers and 35 % (sd 11) in the Silent Generation (P = 0·68). DHD15 index scores did not differ significantly across generations, with scores of 75·6 (sd 14·4), 77·5 (sd 15·7), and 78·5 (sd 14·0) among Generation X, Baby Boomers and the Silent Generation males, respectively (P = 0·28), and 83·9 (sd 15·9), 86·2 (sd 16·6) and 85·2 (sd 15·4) among females, respectively (P = 0·10). These patterns were similar after adjustment for energy intake.
Mean absolute GHGE differed significantly across generations, with values of 5·7 (sd 2·2), 5·1 (sd 1·7) and 4·7 (sd 1·7) kg CO₂-eq/d among Generation X, Baby Boomers and the Silent Generation males, respectively (P < 0·001), and 4·5 (sd 1·6), 4·4 (sd 1·5) and 4·0 (sd 1·4) kg CO₂-eq/d among females, respectively (P = 0·005) (Table 1). Mean absolute blue water consumption differed significantly across generations in males, with values of 98·5 (sd 37·7), 94·0 (sd 33·6) and 88·1 (sd 35·5) L/d in Generation X, Baby Boomers and the Silent Generation, respectively (P = 0·05). Among females, mean values were 92·0 (sd 32·0), 94·2 (sd 34·6) and 89·0 (sd 46·9) L/d, respectively, with no statistically significant differences across generations (P = 0·30). After energy standardisation, generational differences in environmental impacts were attenuated (Table 1).
Diet quality and environmental impact
Diet quality
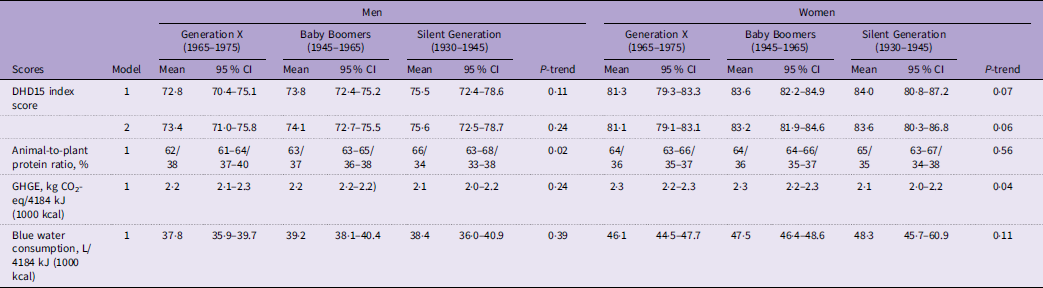
After adjustment for socio-demographic and lifestyle factors in model 1 and additional adjustment for total energy intake in model 2 (Table 2), there was borderline evidence for a generational trend in DHD15 index scores among females (P-trend = 0·06). Mean scores were highest in the Silent Generation (83·6, 95 % CI 80·3–86·8), followed by Baby Boomers (83·2, 95 % CI 81·9–84·6) and Generation X (81·1, 95 % CI 79·1–83·1). Among males, there was no evidence of a generational trend in DHD15 index scores (P-trend = 0·24).
Adjusted mean diet quality and environmental impact by generation and sex

Table 2. Long description
A table comparing diet quality and environmental impact across different generations and sexes. The table has 4 rows and 12 columns. Column headers are Scores, Model, Men, Generation X (1965-1975), Baby Boomers (1945-1965), Silent Generation (1930-1945), P-trend, Women, Generation X (1965-1975), Baby Boomers (1945-1965), Silent Generation (1930-1945), P-trend. Row labels are DHD15 index score, Animal-to-plant protein ratio, GHGE, kg CO2-eq/1000 kcal, Blue water consumption, L/1000 kcal. Row 1: DHD15 index score, Model 1, Mean 72.8, 95% CI 70.4-75.1, Mean 73.8, 95% CI 72.4-75.2, Mean 75.5, 95% CI 72.4-78.6, P-trend 0.11, Mean 81.3, 95% CI 79.3-83.3, Mean 83.6, 95% CI 82.2-84.9, Mean 84.0, 95% CI 80.8-87.2, P-trend 0.07. Row 2: DHD15 index score, Model 2, Mean 73.4, 95% CI 71.0-75.8, Mean 74.1, 95% CI 72.7-75.5, Mean 75.6, 95% CI 72.5-78.7, P-trend 0.24, Mean 81.1, 95% CI 79.1-83.1, Mean 83.2, 95% CI 81.9-84.6, Mean 83.6, 95% CI 80.3-86.8, P-trend 0.06. Row 3: Animal-to-plant protein ratio, Model 1, Mean 62/38, 95% CI 61/39-63/37, Mean 63/37, 95% CI 63/37-66/34, Mean 66/34, 95% CI 63/37-68/32, P-trend 0.02, Mean 64/36, 95% CI 63/37-66/34, Mean 64/36, 95% CI 64/36-66/34, Mean 65/35, 95% CI 63/37-67/33, P-trend 0.56. Row 4: GHGE, kg CO2-eq/1000 kcal, Model 1, Mean 2.2, 95% CI 2.1-2.3, Mean 2.2, 95% CI 2.2-2.2, Mean 2.1, 95% CI 2.0-2.2, P-trend 0.24, Mean 2.3, 95% CI 2.2-2.3, Mean 2.3, 95% CI 2.2-2.3, Mean 2.1, 95% CI 2.0-2.2, P-trend 0.04. Row 5: Blue water consumption, L/1000 kcal, Model 1, Mean 37.8, 95% CI 35.9-39.7, Mean 39.2, 95% CI 38.1-40.4, Mean 38.4, 95% CI 36.0-40.9, P-trend 0.39, Mean 46.1, 95% CI 44.5-47.7, Mean 47.5, 95% CI 46.4-48.6, Mean 48.3, 95% CI 45.7-60.9, P-trend 0.11.
Model 1: ANCOVA adjusted for educational level, smoking status and physical activity.
Model 2: ANCOVA additionally adjusted for total energy intake.GHGE, greenhouse gas emission.
In addition, among males, Generation X had the highest mean proportion of protein derived from plant sources (38 %, 95 % CI 37–40), compared with 37 % (95 % CI 36–38) in Baby Boomers and 34 % (95 % CI 33–38) in the Silent Generation (P-trend = 0·02). Among females, the proportion was similar across generations (P-trend = 0·56). No statistically significant post hoc differences were observed for either the DHD15 index score or the animal-to-plant protein ratio.
Life cycle assessment indicators
After adjustment, there was a significant generational trend in GHGE among females (P-trend = 0·04), with mean values of 2·3 kg CO2-eq/1000 kcal (95 % CI 2·2-2·3) in both Generation X and Baby Boomers and 2·1 kg CO2-eq/1000 kcal (95 % CI 2·0–2·2) in the Silent Generation. Among males, GHGE did not differ significantly across generations (P-trend = 0·24).
For blue water consumption, there was no evidence of a generational trend among males (P-trend = 0·39) or females (P-trend = 0·11). No statistically significant post hoc differences were observed for the LCA indicators.
Differences in Dutch Healthy Diet-15 index food group consumption
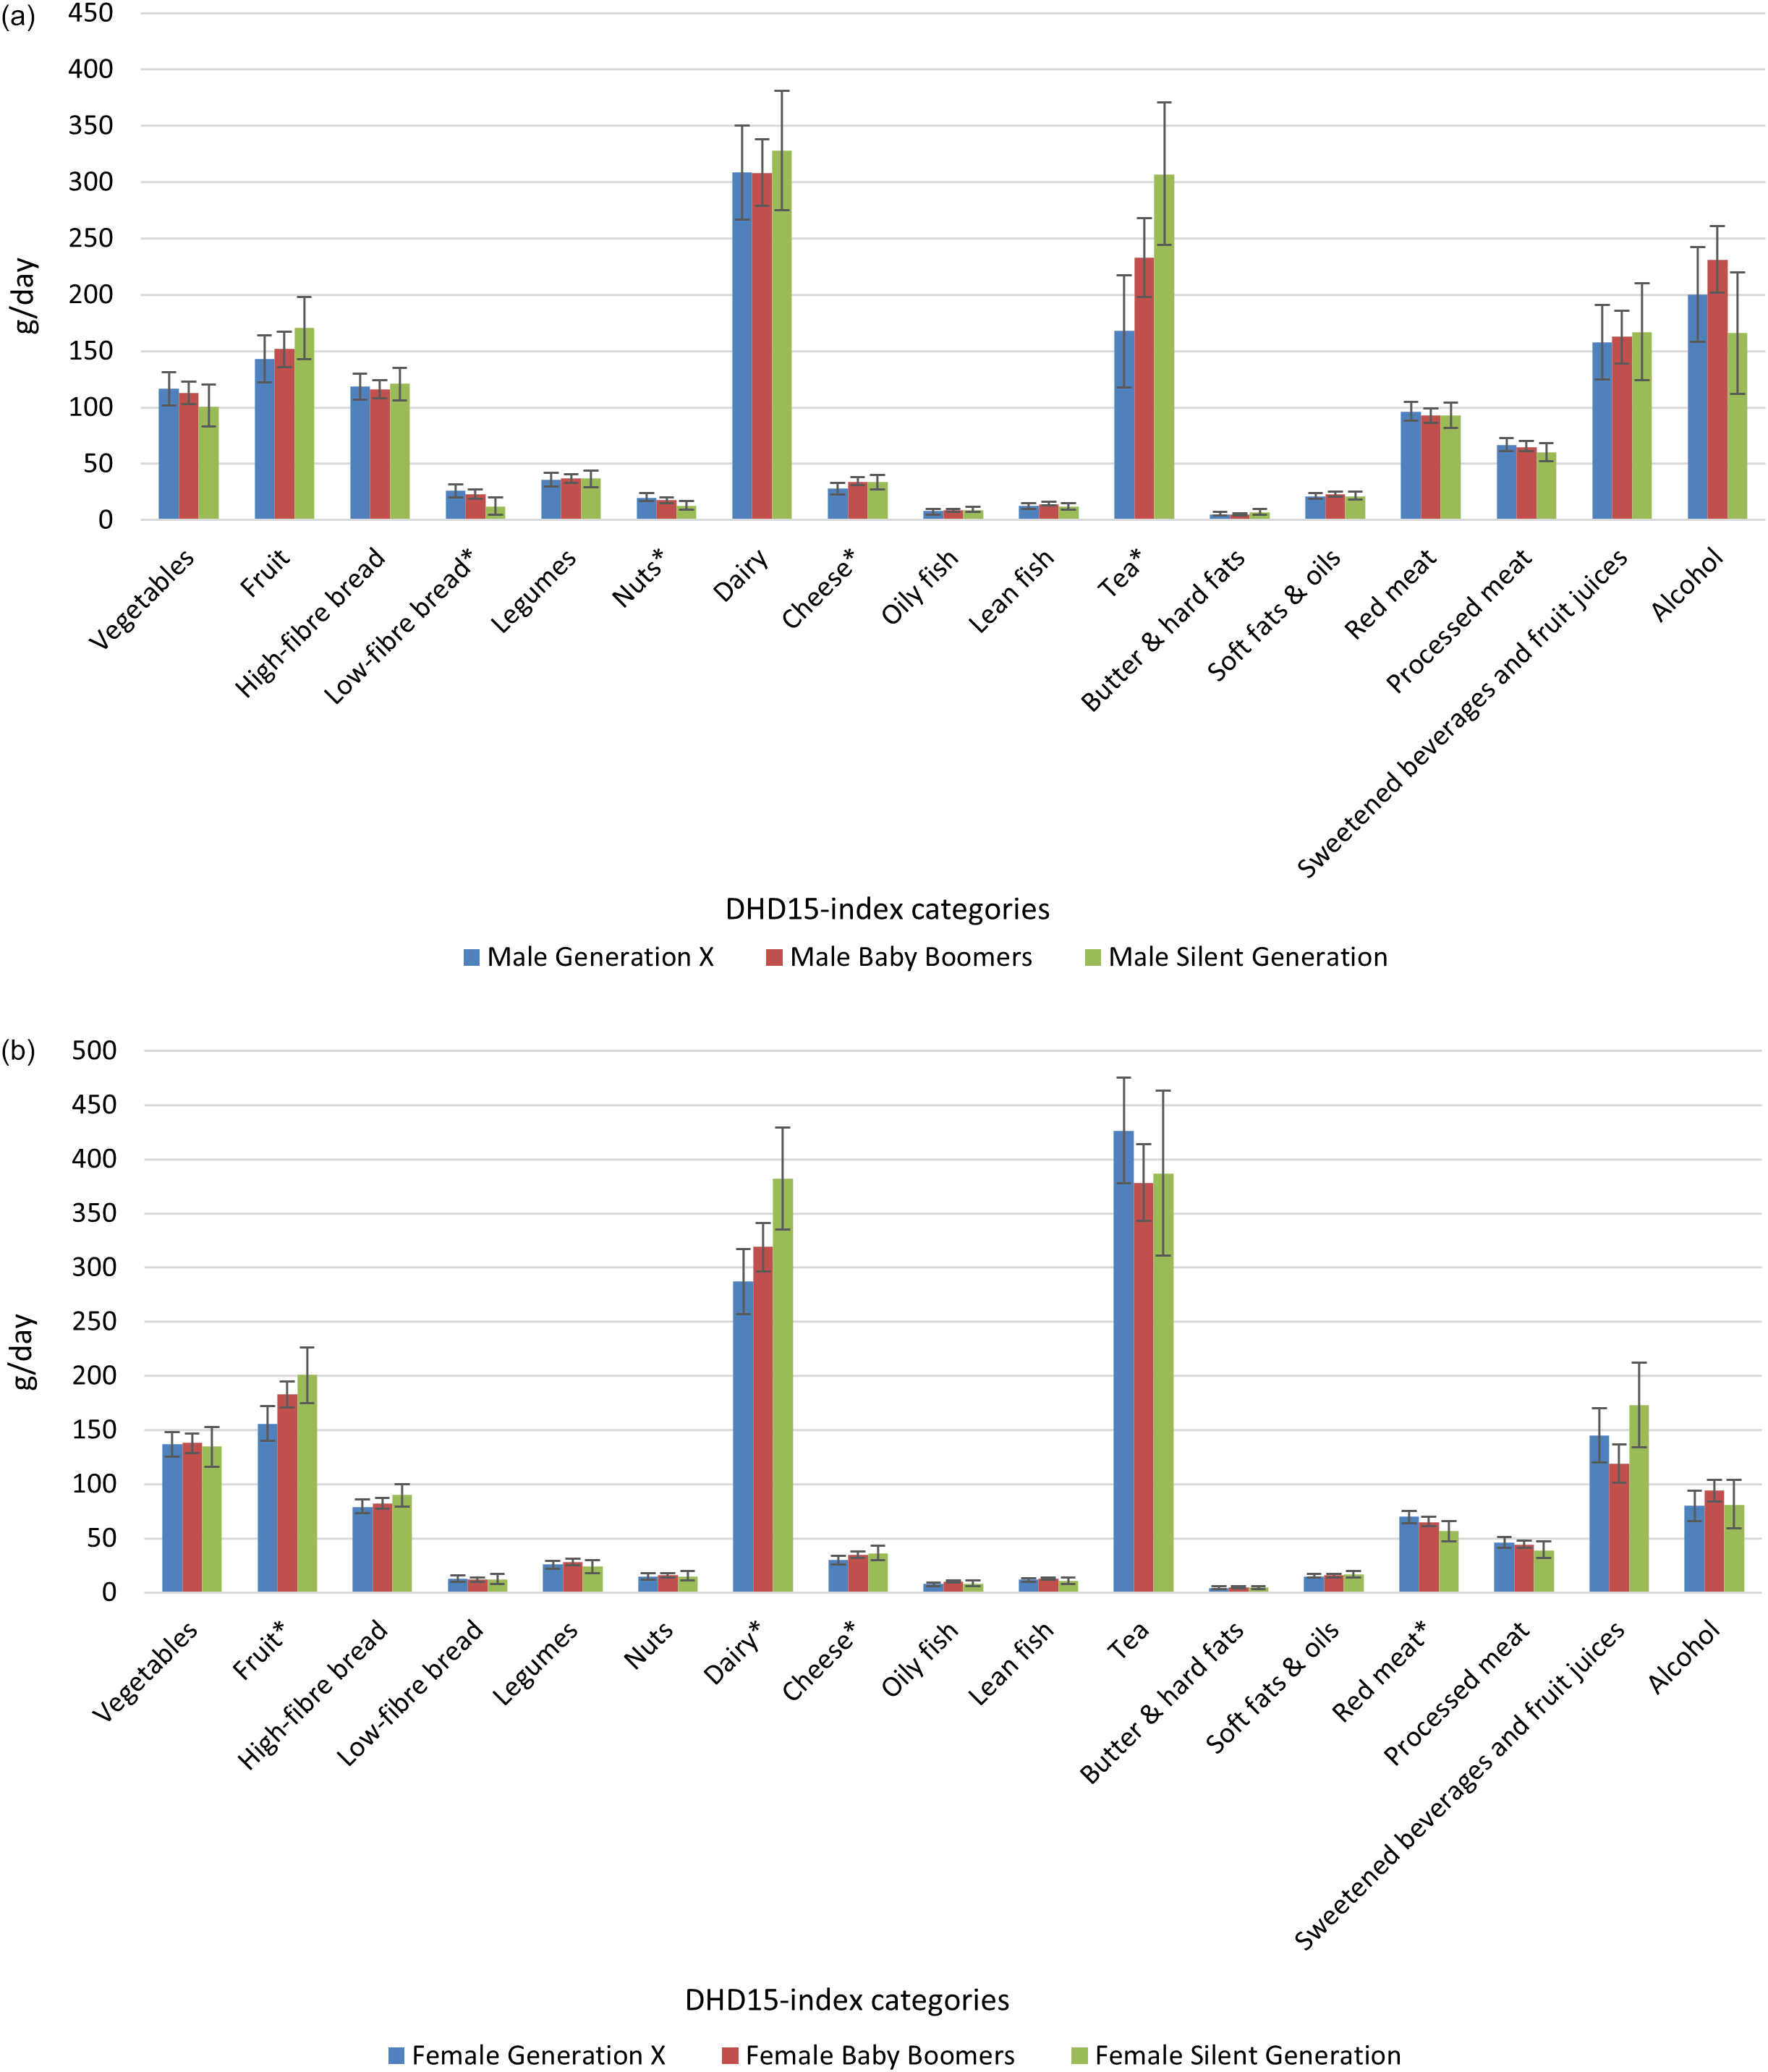
Among females, adjusted mean consumption of dairy products, cheese and fruit was higher in older generations than in Generation X, while red meat consumption was highest in Generation X (all P-trends < 0·05; Figure 1). For example, fruit consumption was 156 g/d (95 % CI 140–172) in Generation X, 183 g/d (95 % CI 171–195) in Baby Boomers and 201 g/d (95 % CI 175–226) in the Silent Generation (P-trend < 0·001). Red meat consumption was 70 g/d (95 % CI 64–75) in Generation X, 65 g/d (95 % CI 61–70) in Baby Boomers and 57 g/d (95 % CI 47–66) in the Silent Generation (P-trend = 0·02). Among males, adjusted mean consumption of cheese and tea was highest in the older generations, while consumption of low-fibre bread and nuts was highest in Generation X (all P-trends < 0·05; Figure 1). Exact adjusted mean values, 95 % CI, P-trend values and post hoc pairwise P values are provided in Appendices 3 and 4.
Adjusted mean DHD15 index food groups consumption (g/d) across generations, by sex (a: men, b: women).
Estimates were obtained using ANCOVA adjusted for total energy intake, educational level, smoking status and physical activity level. An asterisk (*) indicates a significant linear trend across generations. Black bars represent confidence intervals. DHD15, Dutch Healthy Diet index.

Figure 1. Long description
Panel A: A bar graph comparing food consumption in grams per day across different generations of men. The horizontal axis lists food categories such as vegetables, fruit, high-fibre bread, low-fibre bread, legumes, nuts, dairy, cheese, oily fish, lean fish, tea, butter & hard fats, soft fats & oils, red meat, processed meat, sweetened beverages and fruit juices, and alcohol. The vertical axis measures consumption in grams per day, ranging from 0 to 450. The graph includes three data series: Male Generation X (blue), Male Baby Boomers (red), and Male Silent Generation (green). Notable trends include higher dairy and tea consumption in the Silent Generation and higher alcohol consumption in Baby Boomers. Panel B: A bar graph comparing food consumption in grams per day across different generations of women. The horizontal axis lists the same food categories as in Panel A. The vertical axis measures consumption in grams per day, ranging from 0 to 450. The graph includes three data series: Female Generation X (blue), Female Baby Boomers (red), and Female Silent Generation (green). Notable trends include higher dairy and tea consumption in the Silent Generation and higher alcohol consumption in Baby Boomers.
Differences in food-group contributions to the animal-to-plant protein ratio
Compared with Generation X, older generations had higher adjusted proportions of protein derived from dairy products and lower proportions derived from poultry, other meat, rice, pasta and fries (all P-trends < 0·05; Figure 2). For example, among females, the proportion of protein derived from dairy products was 13·6 % (95 % CI 12·4–14·8) in Generation X, 14·8 % (95 % CI 14·0–15·7) in Baby Boomers and 18·7 % (95 % CI 16·5–21·1) in the Silent Generation (P-trend < 0·001). The proportion derived from poultry for females was 7·2 % (95 % CI 6·5–8·0) in Generation X, 5·6 % (95 % CI 5·2–6·1) in Baby Boomers and 3·3 % (95 % CI 2·5–4·2) in the Silent Generation (P-trend < 0·001). Additionally, among females, higher proportions of protein were derived from cheese in older generations and from beef in Generation X (both P-trends < 0·05). Among males, higher proportions of protein were derived from nuts, seeds and pastes and low-fibre bread in Generation X (both P-trends < 0·05). Exact adjusted mean proportions, 95 % CI, P-trend values and post hoc pairwise P-values are provided in Appendices 5 and 6.
Generational differences in protein contributions from animal- and plant-based food groups to total protein intake (%), by sex (a: men, b: women).
Values represent back–transformed adjusted proportions analysed using ANCOVA on arcsine–transformed data, controlling for educational level, smoking status and physical activity level. Other meat is defined as sheep meat, lamb, veal and organ meats excluding liver.

Figure 2. Long description
Panel A: A stacked bar chart showing the percentage of total protein intake from different food groups for male Generation X, Baby Boomers, and Silent Generation. The horizontal axis lists the generations, and the vertical axis shows the percentage of total protein. Each bar is divided into segments representing different food groups, with colors indicating specific food groups such as potatoes, vegetables, legumes, high-fibre bread, cereal and cereal bars, pasta, plant-based meat alternatives, dairy, cheese, pork, beef, poultry, cold cuts, and eggs. Panel B: A stacked bar chart showing the percentage of total protein intake from different food groups for female Generation X, Baby Boomers, and Silent Generation. The horizontal axis lists the generations, and the vertical axis shows the percentage of total protein. Each bar is divided into segments representing different food groups, with colors indicating specific food groups such as potatoes, vegetables, legumes, high-fibre bread, cereal and cereal bars, pasta, plant-based meat alternatives, dairy, cheese, pork, beef, poultry, cold cuts, and eggs.
Differences in greenhouse gas emission by food group
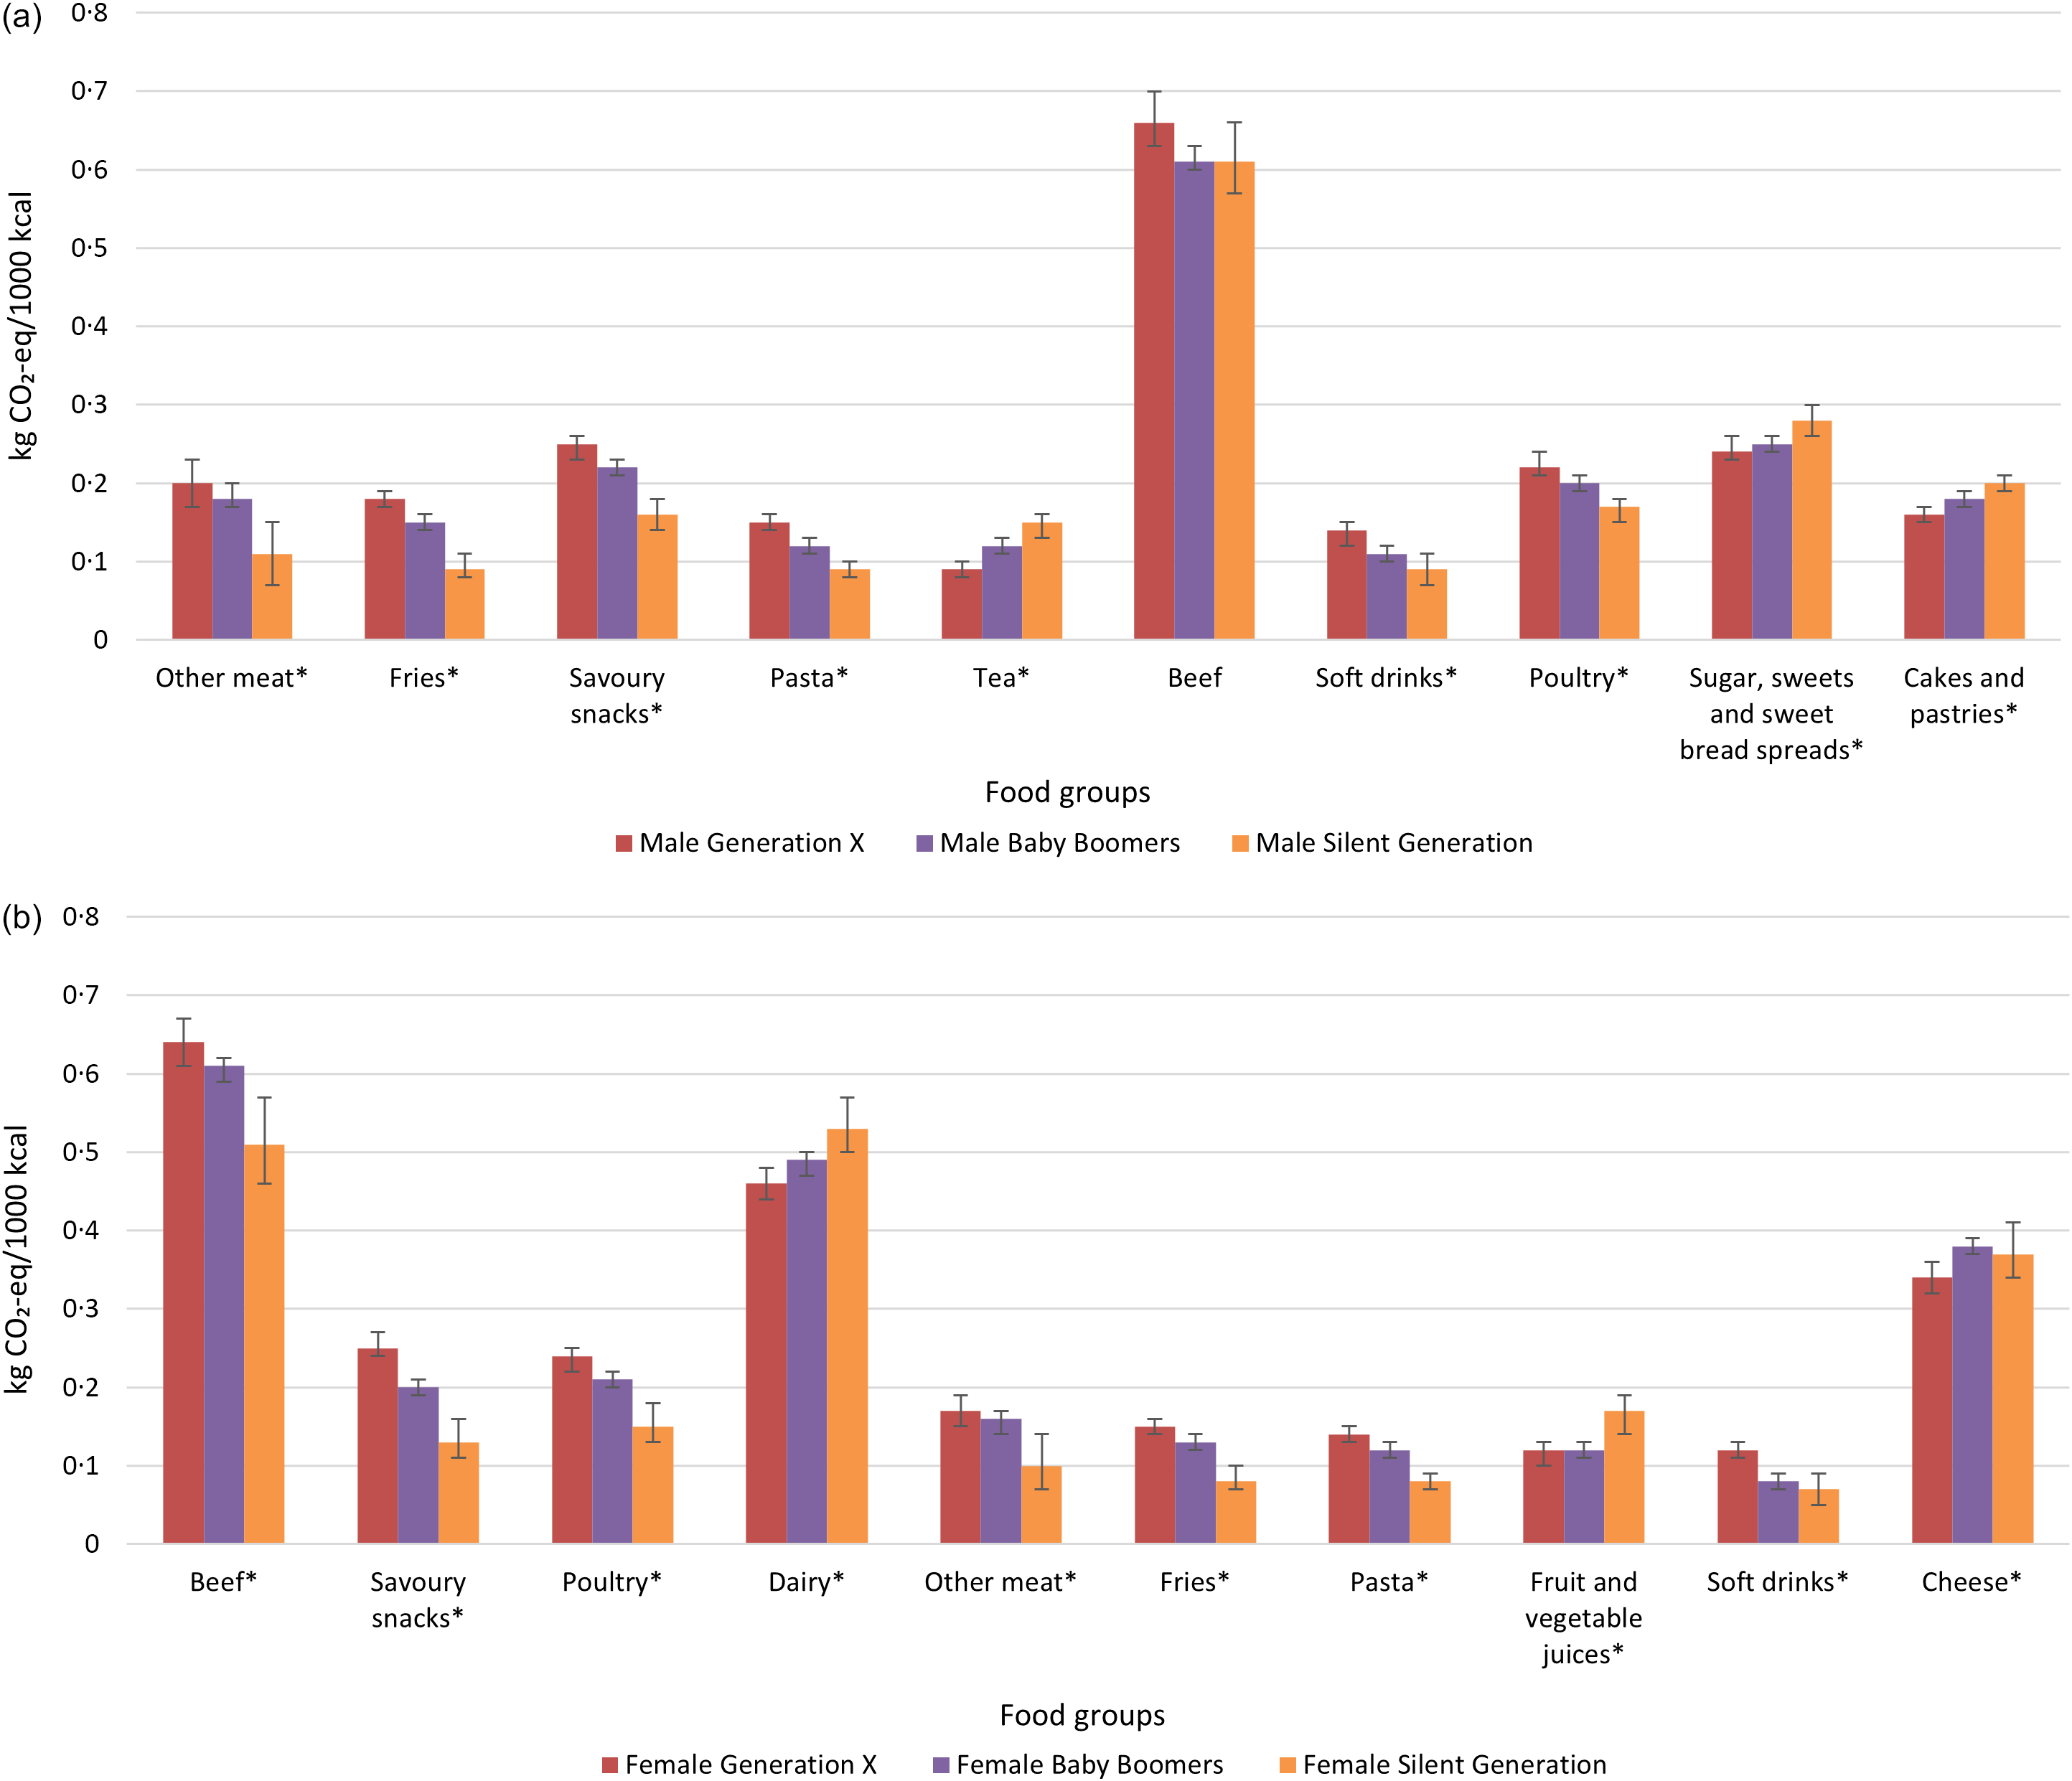
Generation X had higher adjusted mean GHGE contributions from certain meats (beef, poultry and other meat) and processed foods and drinks (fries, savoury snacks and soft drinks) than older generations (all P-trends ≤ 0·05; Figure 3). In males, other meat showed the largest difference, with 0·20 kg CO₂-eq/1000 kcal (95 % CI 0·17–0·23) in Generation X, 0·18 kg CO₂-eq/1000 kcal (95 % CI 0·17–0·20) in Baby Boomers and 0·11 kg CO₂-eq/1000 kcal (95 % CI 0·07–0·15) in the Silent Generation (P-trend = 0·001). Among females, beef showed the largest difference, with 0·64 kg CO₂-eq/1000 kcal (95 % CI 0·61–0·67) in Generation X, 0·61 kg CO₂-eq/1000 kcal (95 % CI 0·59–0·62) in Baby Boomers and 0·51 kg CO₂-eq/1000 kcal (95 % CI 0·46–0·57) in the Silent Generation (P-trend < 0·001). In contrast, among males, older generations had higher GHGE contributions from tea, sugar, sweets and sweet bread spreads and cake and pastries, while among females, older generations had higher GHGE contributions from dairy products and cheese (all P-trends < 0·05). Comprehensive tables for all food groups, ranked by absolute differences and including adjusted mean GHGE, 95 % CI, P-trend values and post hoc pairwise P-values are provided in Appendices 7–9.
Top ten food groups contributing to absolute generational differences in diet-related GHGE, by sex (a: men, b: women).
Values are presented as back–transformed adjusted means (kg CO₂-eq per 1000 kcal) derived from square-root–transformed ANCOVA models adjusted for educational level, smoking status and physical activity level. An asterisk (*) indicates a significant linear trend across generations. Black bars represent confidence intervals. Other meat is classified as sheep meat, lamb, veal and organ meats other than liver. GHGE, greenhouse gas emission.

Differences in blue water consumption by food group
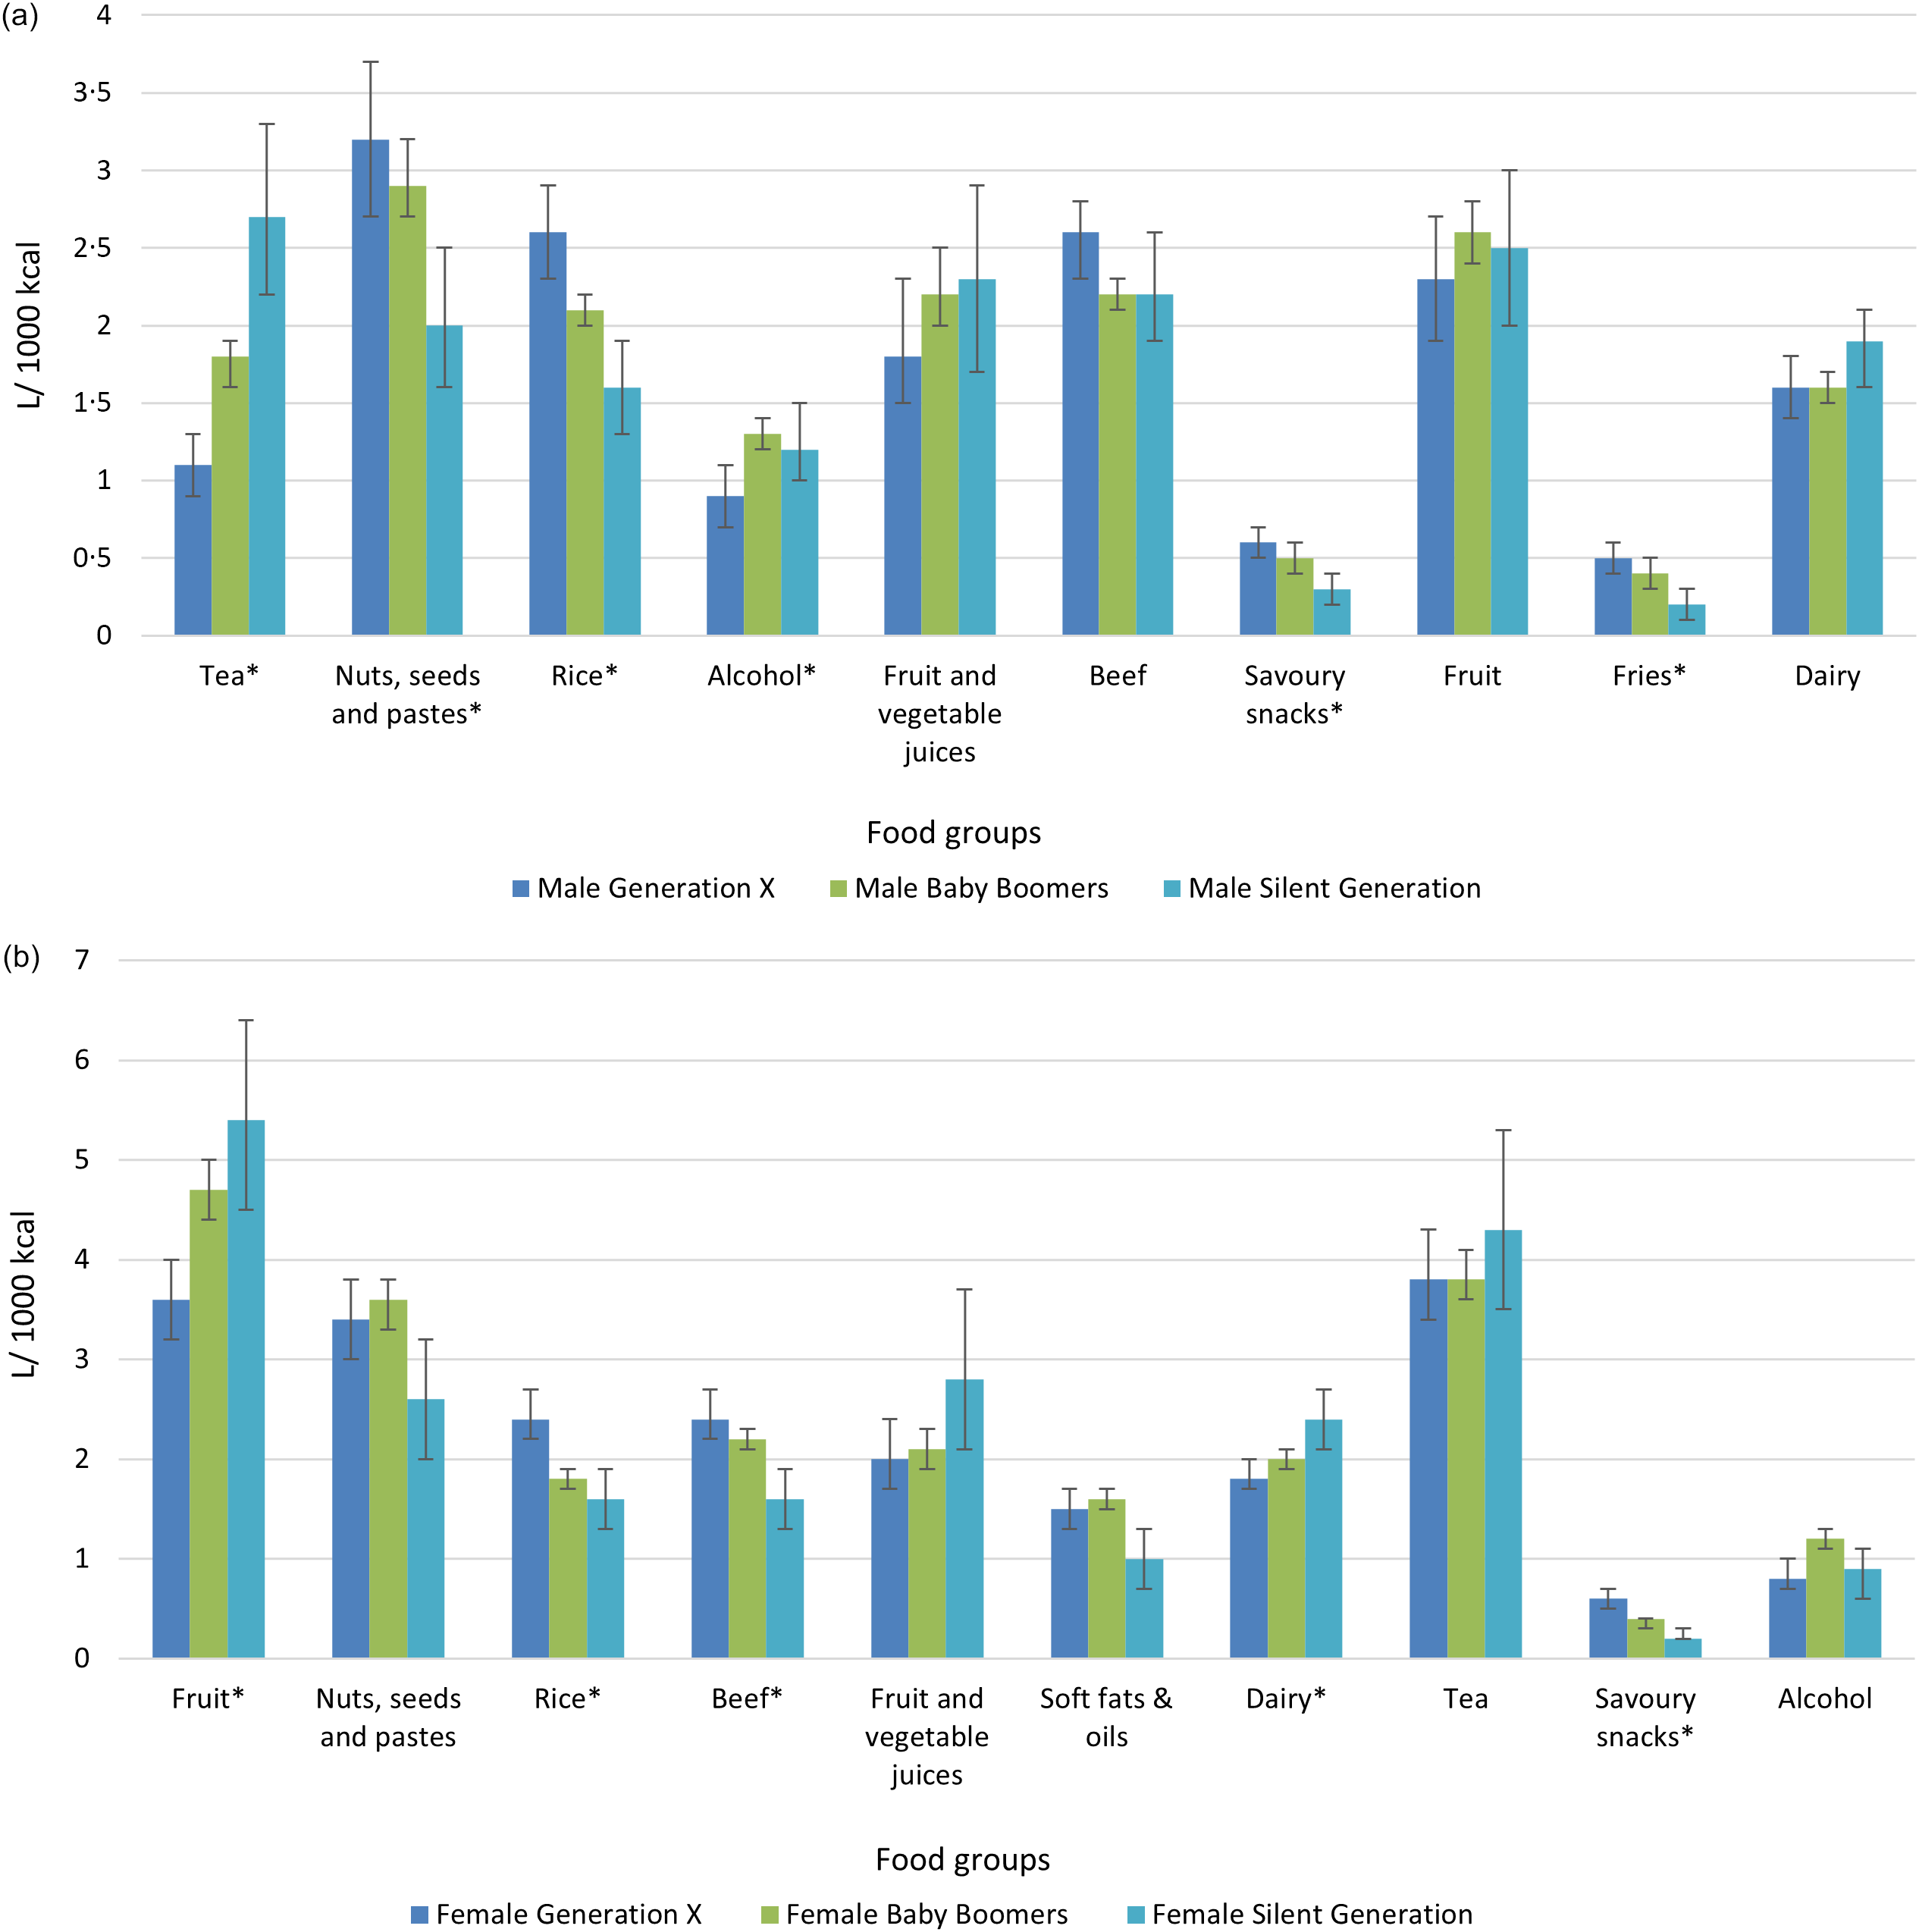
Among males, older generations had higher adjusted mean blue water consumption from tea and alcohol, while Generation X had higher blue water consumption from nuts, seeds and pastes and rice (all P-trends < 0·05; Figure 4). For example, blue water consumption from tea was 1·1 L/1000 kcal (95 % CI 0·9–1·3) in Generation X, 1·8 L/1000 kcal (95 % CI 1·6–1·9) in Baby Boomers and 2·7 L/1000 kcal (95 % CI 2·2–3·3) in the Silent Generation (P-trend < 0·001). Among females, older generations had higher blue water consumption from fruit and dairy products, while Generation X had higher blue water consumption from rice and beef (all P-trends < 0·05). Blue water consumption from fruit was 3·6 L/1000 kcal (95 % CI 3·2–4·0) in Generation X, 4·7 L/1000 kcal (95 % CI 4·4–5·0) in Baby Boomers and 5·4 L/1000 kcal (95 % CI 4·5–6·4) in the Silent Generation (P-trend < 0·001). Comprehensive tables for all food groups, ranked by absolute differences and including adjusted means, 95 % CI, P-trend values and post hoc pairwise P-values, are provided in Appendices 10–12.
Top ten food groups contributing to absolute generational differences in diet–related blue water consumption, by sex (a: men, b: women).
Values are presented as adjusted geometric means (L per 1000 kcal) derived from log–transformed ANCOVA models adjusted for educational level, smoking status and physical activity level. An asterisk (*) indicates a significant linear trend across generations. Black bars represent confidence intervals.

Figure 4. Long description
Panel A: A bar graph comparing the top ten food groups contributing to absolute generational differences in diet-related blue water consumption in men. The horizontal axis lists food groups: Tea, Nuts, seeds and pastes, Rice, Alcohol, Fruit and vegetable juices, Beef, Savoury snacks, Fruit, Fries, and Dairy. The vertical axis measures L per 1000 kcal, ranging from 0 to 4. The graph includes three data series: Male Generation X, Male Baby Boomers, and Male Silent Generation, represented by blue, green, and light blue bars respectively. Notable trends include higher consumption of nuts, seeds, and pastes among Male Baby Boomers and higher tea consumption among Male Silent Generation. Panel B: A bar graph comparing the top ten food groups contributing to absolute generational differences in diet-related blue water consumption in women. The horizontal axis lists food groups: Fruit, Nuts, seeds and pastes, Rice, Beef, Fruit and vegetable juices, Soft fats & oils, Dairy, Tea, Savoury snacks, and Alcohol. The vertical axis measures L per 1000 kcal, ranging from 0 to 7. The graph includes three data series: Female Generation X, Female Baby Boomers, and Female Silent Generation, represented by blue, green, and light blue bars respectively. Notable trends include higher fruit consumption among Female Silent Generation and higher tea consumption among Female Generation X.
Discussion
Modest generational differences were observed in diet quality and the environmental impact of diets. Among females, DHD15 index scores were slightly higher in older generations. Among males, Generation X had a higher proportion of protein derived from plant sources than older generations. Absolute GHGE was lower in older generations. After energy standardisation, differences in GHGE across male generations largely disappeared, suggesting that lower total energy intake in older generations partly accounted for the lower absolute GHGE. Absolute blue water consumption showed a similar pattern among males, with differences attenuating after energy standardisation. Dietary composition also differed across generations. Generation X had higher environmental impacts from certain meats, processed foods and drinks, nuts and rice, whereas older generations had higher impacts from dairy products, tea and fruit.
DHD15 index scores in this study were comparable to those reported in other Dutch cohorts(Reference Biesbroek, Verschuren and Boer3,Reference Baart, Brouwer-Brolsma and De Jong34) . The lower DHD15 index score among female Generation X participants was consistent with findings from Brazil, where Generation X had a higher likelihood of having a lower-quality diet than the Silent Generation(Reference Oliveira, Fróis and Sousa35). Brazilian research also reported lower fruit and higher red meat consumption among Generation X than among older generations, while Dutch national data have shown higher fruit and dairy products consumption among older adults than among middle-aged adults(36,Reference Bezerra, Bahamonde and Marchioni37) . Greater health concerns among older adults, often related to non-communicable diseases, may encourage more favourable food choices(Reference Oliveira, Fróis and Sousa35). In contrast, greater time constraints among middle-aged adults due to work and family responsibilities may increase reliance on convenience foods and ultra-processed foods(Reference Oliveira, Fróis and Sousa35).
The slightly higher proportion of plant-based protein compared with national estimates was largely due to greater legume consumption(18). Among male Generation X participants, the higher proportion of plant-based protein was mainly due to greater contributions from nuts, seeds, pastes, low-fibre bread, rice and pasta. This is consistent with Dutch national data showing a slightly higher relative contribution of plant-based protein among middle-aged adults than among older adults(18). Similarly, an Irish study found a higher relative contribution of plant-based protein among adults aged 51-64 years than among those aged ≥ 65 years(Reference Hone, Nugent and Walton38). The study also reported greater contributions from grains, including rice and pasta, among middle–aged adults(Reference Hone, Nugent and Walton38). This pattern may reflect broader dietary shifts towards plant-based foods among younger generations, although animal protein intake remains relatively high(Reference Alae-Carew, Green and Stewart39).
Compared with national estimates using the same LCA data, the absolute GHGE in the DCS were higher(18). The higher values may partly reflect higher reported energy intake and alcohol consumption in both sexes and higher red and processed meat consumption among DCS females(18,40) . Regional reports have also identified relatively low adherence to alcohol guidelines in the region(41). In addition, differences in dietary assessment methods (FFQ in the DCS v. two 24-hour recalls in the VCP) may have contributed to the observed differences. Although FFQ are generally known to slightly underestimate environmental impact compared with 24-hour recalls(Reference Mertens, Kuijsten and Geleijnse42), this methodological difference may still influence comparability between studies. Mean blue water consumption was similar to national estimates, likely reflecting a balance between somewhat higher consumption of fruit, sweetened beverages and fruit juices, and nuts and slightly lower consumption of vegetables and tea(18). The lower absolute GHGE and blue water consumption among older generations were partly explained by lower energy intake. A Mexican study also reported similar carbon footprints per calorie across age groups but lower total GHGE among older adults because of lower energy intake(Reference López-Olmedo, Stern and Bakhtsiyarava43). European studies likewise identified energy intake as an important driver of variation in dietary environmental impact(Reference Stubbendorff, Hallström and Tomova44,Reference Temme, Toxopeus and Kramer45) . Among females, the differences in energy-standardised adjusted mean GHGE persisted, likely due to more pronounced generational differences in beef and fruit consumption. The lower meat consumption in the Silent Generation may partly reflect differences in formative food environments, as previous research has suggested that experiences of food scarcity and economic conditions may shape later dietary patterns(Reference López-Olmedo, Stern and Bakhtsiyarava43).
This study identifies several opportunities to reduce dietary environmental impact and improve diet quality across generations. Beef and pork contributed disproportionately to GHGE, and their consumption exceeded Dutch dietary recommendations(5). Reducing meat consumption or replacing it with lower-impact protein foods such as legumes or eggs could therefore reduce environmental impact(Reference Guy, Bray and Appleton46). Dairy products consumption was generally within the range recommended by Dutch dietary guidelines but contributed substantially to environmental impact. Replacing part of dairy products consumption with plant-based sources of protein and calcium, such as legumes, nuts and fortified plant-based alternatives, could therefore reduce environmental impact while maintaining nutritional adequacy(Reference Grasso, Olthof and van Dooren47,Reference Mariotti48) . However, attention must be paid to protein quality and calcium adequacy(Reference Grasso, Olthof and van Dooren47,Reference Mariotti48) . Within the dairy products group, replacing cheese with milk or yoghurt may also reduce environmental impact(28).
Blue water consumption requires additional dietary strategies beyond reducing meat and dairy products consumption(Reference Hollander, Vellinga and de Valk49). Several foods with favourable nutritional profiles, including fruit, vegetables, nuts and tea, contributed substantially to blue water consumption. To reduce environmental impact, dietary guidance could emphasize seasonal and locally produced foods, as well as products from regions with lower irrigation requirements(Reference Hollander, Vellinga and de Valk49,Reference Clonan, Roberts and Holdsworth50) . For health benefits, three cups of green tea are sufficient compared with five cups of black tea(26), so guidelines could encourage moderate green tea consumption based on both health and environmental considerations. Moreover, boiling only the required amount of water could reduce environmental impacts by about one third through increased water efficiency and lower energy use(Reference Gallego-Schmid, Jeswani and Mendoza51). Increasing the use of tap water is also recommended to lower the Dutch blue water consumption within a healthy diet(Reference Hess, Chatterton and Daccache52). Furthermore, efforts to reduce blue water consumption could consider generation-specific strategies. In this study, Generation X had significantly higher blue water consumption from rice compared with the Baby Boomers and the Silent Generation. For Generation X, strategies could therefore focus on partially substituting rice with alternative carbohydrate sources with lower blue water requirements, such as potatoes(Reference Hess, Chatterton and Daccache52). The Silent Generation males, in particular, had significantly higher blue water consumption from tea, while among females, this generation had higher contributions from fruit. In institutional settings, such as care homes for older adults, promoting water as the primary beverage option and prioritising locally produced fruit, such as apples and pears(Reference Hollander, Vellinga and de Valk49), may help reduce blue water consumption associated with tea and fruit intake.
Sustainable dietary change also requires consideration of factors beyond the environmental impact of individual foods. Consumers may experience trade-offs between nutritional value, environmental impact, affordability and convenience, which can complicate everyday choices(Reference Fernqvist, Spendrup and Tellström53). In addition, information on the healthfulness and, in particular, the environmental impact of foods is not always known to consumers(Reference Fernqvist, Spendrup and Tellström53). Supporting such choices therefore requires not only clear consumer information but also the development of food-related skills, such as planning, purchasing and preparing meals(Reference Fernqvist, Spendrup and Tellström53). Moreover, dietary behaviour is embedded within a broader socio-ecological context, including food availability, cultural norms and institutional food environments(Reference Fernqvist, Spendrup and Tellström53). Generational differences in these factors may partly contribute to the dietary patterns observed in this study. Previous research suggests that younger generations tend to pay more attention to environmental information on labels and local sourcing(Reference Nichols and Holt54), which may support further shifts towards sustainable dietary patterns. In contrast, for older adults, promoting familiar plant-based protein sources that are healthy, affordable and appealing in taste may be a more effective strategy for supporting dietary change(Reference Grasso, Hung and Olthof55). Taken together, these findings suggest that strategies to encourage healthier and more sustainable diets may benefit from accounting for generational differences in dietary preferences, motivations and food-related practices.
A major strength of this study is the use of detailed dietary data from a well-characterized population-based cohort, combined with multiple complementary indicators of diet quality and environmental sustainability. By integrating the DHD15 index score, the animal-to-plant protein ratio and LCA-based environmental indicators, we were able to assess healthy and sustainable dietary patterns in a nuanced way. Energy standardisation further distinguished differences related to total food intake from those related to dietary composition. However, several limitations should also be considered. The DHD15 index was adapted because the FFQ did not capture salt and specific coffee consumption. This may have resulted in a small underestimation of diet quality, although similar adaptations have been used in previous Dutch studies. The FFQ also lacked information on the country of origin and production method, and therefore, the associated environmental impact estimates may be over- or underestimated for individual diets. However, at the population level, LCA-weighted averages provide a robust estimate of dietary environmental impact, limiting their effect on group comparisons. Relatedly, LCA data represent weighted averages of foods as supplied in the Netherlands, which do not capture variation due to production practices, geographic origin or seasonality(29). This may introduce some imprecision in absolute GHGE and blue water estimates, but the overall direction of associations across generations and sexes is unlikely to be affected. The use of back-transformed food group data limits direct comparison with other studies, as the transformation increases the absolute values, but relative differences across groups remain valid. Furthermore, the study population consisted of middle-aged and older adults, which may limit the generalisability to younger age groups. In addition, Generation X and the Silent Generation had substantially smaller sample sizes than the Baby Boomers. This imbalance may have reduced statistical power and precision for estimates in the smaller groups, particularly for the Silent Generation, and these findings should therefore be interpreted with some caution. Nevertheless, several findings, including the DHD15 index scores and blue water consumption estimates, were broadly comparable to national estimates, suggesting that the generational patterns observed here may reflect broader patterns in the Dutch population. Future longitudinal studies would help capture dietary transitions across the life course, and combining environmental indicators with nutrient adequacy and long-term health outcomes would further strengthen the identification of dietary patterns that optimally balance health and sustainability.
Conclusion
Generational dietary patterns in the DCS differed modestly in both diet quality and environmental impacts. Older female generations had slightly healthier diets, and Generation X males derived a greater share of protein from plant sources than older male generations. Absolute GHGE was lower in older generations; among males, this was partly due to lower energy intake in older males. Absolute blue water consumption followed a similar pattern in males, partly attributable to lower energy intake in older males. Differences in the contributions of specific food groups further explained generational variation in both diet quality and environmental impacts. Although overall generational differences were small, targeting specific food groups or tailoring dietary transition strategies by generation could enhance efforts to promote healthier and more environmentally sustainable diets.
Supplementary material
For supplementary material/s referred to in this article, please visit https://doi.org/10.1017/S0007114526109295
Data availability statement
The data of the Doetinchem Cohort Study cannot be placed in a public repository due to legal and ethical constraints. The participants’ informed consent did not include consent to public availability of the data. However, the data are available upon reasonable request, by contacting the scientific committee of the Doetinchem Cohort Study by email: SAG@rivm.nl.
Acknowledgements
We thank the respondents, epidemiologists and fieldworkers of the Municipal Health Service in Doetinchem for their contribution to the data collection for this study. ChatGPT (GPT-5, OpenAI) was used from October 2025 to March 2026 to assist with improving R code. The tool provided suggestions on coding approaches, which were carefully reviewed and modified before implementation. No proprietary data were uploaded.
Author contributions
De Wolf: methodology, literature search, formal analyses, writing – original draft. Haveman-Nies: conceptualisation, methodology, supervision, writing – review & editing. Vellinga: data curation (LCA), writing – review & editing. Picavet: data curation (cohort), funding acquisition (cohort), writing – review & editing. Verschuren: conceptualisation, supervision, data curation (cohort), funding acquisition (cohort), writing – review & editing. Biesbroek: conceptualisation, methodology, supervision, writing – review & editing.
Financial support
The Doetinchem Cohort Study is supported by the Dutch Ministry of Health, Welfare and Sport and the National Institute for Public Health and the Environment.
Open access funding provided by Wageningen University & Research.
Competing interests
None.




 Open access

