Implications
Our meta-analysis allows the effect of a variation in rumen protozoa concentration on methane emission to be quantified when protozoa ranged between 4.5 and 7.3 log10 cells/ml. From selected experiments, a reduction of 0.12 log10 protozoa cells/ml induced a significant reduction of 1 g methane/kg dry matter intake. Among the experiments of the database, 31% reported a reduction of both protozoa concentration and methane emission, most of these using lipids. However, a reduction of methane emission with no change in protozoa was reported in 21% of the experiments, showing that protozoa are not the only factor responsible for reduced methanogenesis.
Introduction
In the rumen, methanogens produce methane (CH4) mainly from carbon dioxide and hydrogen (H2) released during fermentation of feeds by bacteria, protozoa and fungi. Protozoa are involved in methanogenesis through their high production of butyrate (C4) and acetate (C2), two volatile fatty acids (VFA) whose biosynthesis liberates 2 and 4 moles of H2, respectively, per mole of fermented glucose (Sauvant et al., Reference Sauvant, Giger-Reverdin, Serment and Broudiscou2011). Half of this H2 is used by methanogens inside or in close association with protozoa cells, to produce CH4 (Czerkawski, Reference Czerkawski1986; Williams and Coleman, Reference Williams and Coleman1992). Hence, it was hypothesized that the reduction of rumen protozoa concentration might be an efficient way to decrease CH4 emission (Finlay et al., Reference Finlay, Esteban, Clarke, Williams, Embley and Hirt1994). Previous experiments testing experimental defaunation reported CH4 reduction ranging from 13% to 35% in vivo (Hegarty, Reference Hegarty1999; Morgavi et al., Reference Morgavi, Jouany and Martin2008; Morgavi et al., Reference Morgavi, Martin, Jouany and Ranilla2012) and from 9% to 25% in vitro (Newbold et al., Reference Newbold, Lassalas and Jouany1995). However, the relationship between protozoa concentration and CH4 emission is not precisely quantified. Preliminary work on a limited number of publications indicated that these two parameters were positively correlated (Morgavi et al., Reference Morgavi, Forano, Martin and Newbold2010). This finding prompted us to carry out a deeper analysis of the effects of a variation in protozoa concentration on CH4 emission, by applying a meta-analysis approach with a variance−covariance model (Sauvant et al., Reference Sauvant, Schmidely, Daudin and St-Pierre2008). To this end, we exhaustively gathered evidence from experiments reporting simultaneous measurements of CH4 emission and rumen protozoa concentrations on the same groups of animals. To refine the study, we also tested the influence of qualitative and quantitative interfering factors for this relationship.
Material and methods
Selection of publications
We included in the database only publications reporting in vivo data of both CH4 emission and rumen protozoa concentration measured on the same groups of animals. To find publications, bibliographical databases of editorial platforms (Web of Knowledge, ScienceDirect and Google Scholar) were interrogated, with CH4, protozoa and ruminants as keywords. Unpublished experiments from our research group (INRA, UMR1213 Herbivores) were also added. Quantitative factors (intake, chemical composition of the diet, total tract digestibility, rumen VFA concentrations, rumen pH, rumen bacteria and methanogen concentrations, and rumen sampling time relative to feeding time) were added to the database when available, with s.e. and statistical differences between treatments. Reported data of rumen parameters in kinetics were averaged. Qualitative factors (animal species, CH4 mitigation strategies, and techniques for measuring CH4 emission and protozoa concentration) were also collected. Publications using CH4 emission calculated from equations instead of actual measures were excluded.
When relevant, treatments testing an additive or supplement were characterized by the main active compound in the additive (e.g. C18:1n-9 for rapeseed, diallyl disulphide for garlic or tannin for Quillaja saponaria), by the quantity of the additive and of the main active compound in dry matter, and by the physical form of the additive (grain, powder and oil). For linseed, sunflower, rapeseed, soya, coconut and cottonseed, when the lipid values were not available, the quantity of the main fatty acid was calculated from tables of composition and nutritive value of raw ingredients (Sauvant et al., Reference Sauvant, Perez and Tran2004). An experiment was defined as one control treatment and at least one experimental treatment testing one or several CH4 mitigation strategies with the same basal diet. When relevant, one publication could supply different experiments, if controls were different. The final curated database contained 59 papers (number of experiments N exp=76, number of treatments N t=219), including 6 unpublished experiments (N t=24) from our research group. The list of published papers used is given in Supplementary Material S1.
Coding of experiments
Experiments were first classified into four groups according to their CH4 mitigation strategy. The group ‘biotechnology’ (N exp=13, N t=35) consisted of experiments testing experimental defaunation, probiotics (Lactobacillus, Propionibacterium, Saccharomyces, Trichosporon), prebiotics (galacto-oligosaccharides) or exogenous microbial products (fibrolytic enzyme, secondary metabolites from Monascus). The group ‘additives’ (N exp=26, N t=64) consisted of experiments testing chemical compounds (iodopropane, nitrate, sulphate), organic acids (malate, fumarate) or plants rich in tannin, saponin or essential oil (anacardic acid, diallyl disulphide, carvacrol, allyl isothiocyanate). The group ‘feed components’ (N exp=25, N t=74) consisted of experiments testing lipids (C12:0, C14:0, C18:1n-9, C18:2n-6, C18:3n-3), forages (Cichorium intybus, Lolium perenne, Trifolium repens, Trifolium pratense, Medicago sativa, Vigna unguiculata) or cereal grains (wheat, maize and barley). The group ‘association’ (N exp=12, N t=46) grouped experiments associating several strategies.
Experiments were further coded according to the distribution of the additive. Experiments with a ‘dose−response effect’ tested different amounts of an additive (N exp=41, N t=105). Experiments with a ‘source effect’ tested different sources of an active compound given at equal doses (e.g. the comparison between tannins originating from chestnut tree or acacia, N exp=21, N t=62). Experiments with a ‘form effect’ tested different forms of an additive given at equal doses (e.g. the comparison between linseed fatty acids supplied as seed or oil, N exp=2, N t=6). Experiments testing experimental defaunation were considered as having a dose−response effect with protozoa as the active compound (N exp=7, N t=17).
Experiments were then sorted into four classes according to their variations in CH4 or protozoa: no variation of either parameters, variation in protozoa concentration only, variation in CH4 emission only or variation in both parameters. Protozoa concentration was expressed as log10 cells/ml, to ensure normal distribution of residues. Three experiments reporting protozoa concentration as proportion of protozoal 18S rDNA per total bacterial 16S rDNA, or as log gene copies of protozoal 18S rRNA/g of fresh matter, could not be used, as conversion to log10 cells/ml was not possible. CH4 emissions were expressed in g/kg dry matter intake (DMI) to allow interpretation of data from animals with different levels of DM intake, that is, large and small ruminants. Two papers had to be excluded, as DMI was not mentioned. Experiments were considered as reporting a significant variation in protozoa or CH4 if the within-experiment variation of the parameter was, respectively, higher than one or two times the database average s.e.m. for the parameter. The threshold levels for protozoa and CH4 were then 5.3 log10 cells/ml (2.2×10⁵/ml) and 1.1 g/kg DMI, respectively.
Statistical analysis
Description of the meta-design
The relationship between the four CH4 mitigation strategies and their effects on protozoa concentration or CH4 emission was assessed with three χ 2 tests. The effect of the following classes on CH4 mitigation strategies was tested: (i) variation in protozoa v. no variation in protozoa, (ii) variation in CH4 v. no variation in CH4 and (iii) variation in protozoa and/or CH4.
In addition, the relationship between quantitative factors (see further) and rumen protozoa concentration (log10 cells/ml) or CH4 emission (g/kg DMI) was examined to gain a better understanding of the effect of these factors on the relationship between CH4 and protozoa. This analysis was performed using all the experiments in the database except for those testing defaunation, as they presented a high leverage effect. A one-way ANOVA was used to test whether protozoa or CH4 varied according to qualitative factors. In order to elucidate the relationship between protozoa or CH4 and quantitative factors, various and complementary approaches were taken. First, global correlation was calculated using all treatments, irrespective of the experiment. Second, the between-experiment correlation was calculated using, for each experiment, the mean of each factor and the mean of the protozoa concentration or of the CH4 emission. Third, the within-experiment correlation was calculated with a GLM using experiments with a reliable within-experiment variation of protozoa concentration or CH4 emission:
 $${\rm Factor}=\alpha {\plus}\alpha _{i} {\plus}\beta {\times}{\rm protozoa}{\plus}\beta _{i} {\times}{\rm protozoa}{\plus}e$$
 $${\rm Factor}=\alpha {\plus}\alpha _{i} {\plus}\beta {\times}{\rm CH}_{{\rm 4}} {\plus}\beta _{i} {\times}{\rm CH}_{{\rm 4}} {\plus}e$$
where α is the overall intercept, α i the fixed effect of the experiment i on the overall intercept α, β the overall slope, β i the fixed effect of the experiment i on the slope and e the random residual error.
Response of CH 4 emission to a variation in rumen protozoa concentration
The average response law was sought using experiments that had a sufficient variation in rumen protozoa concentration between control and treatment (average within-experiment variation of 5.3 log10 cells/ml). Five experiments using defaunated animals were excluded, as justified above. A GLM was applied to determine the relationship between CH4 (g/kg DMI) and rumen protozoa concentration (log10 cells/ml):
 $${\rm CH}_{4} =\alpha {\plus}\alpha _{i} {\plus}\beta {\times}{\rm protozoa}{\plus}\beta _{i} {\times}{\rm protozoa}{\plus}e$$
where α, α i , β, β i and e were as defined in equation (1). A quadratic adjustment was also tested and compared with the linear one. The experiment effect was included in the model as a fixed factor. Given that quantitative and qualitative factors differed between experiments and that they were not documented for all treatments, one of the major aims of this work was to study and explain how these factors might affect the relationship between protozoa and CH4 emission. Normality of residuals was tested (Anderson−Darling test) and normalized residuals were calculated. Treatments with high normalized residuals (N out, <−3 or >+3) were identified and discarded from the model as statistical outliers if they also had a high leverage effect based on H i calculation and Cook distance (Sauvant et al., Reference Sauvant, Schmidely, Daudin and St-Pierre2008).
Determination of factors influencing the response law
Potential interfering factors for the response of CH4 to protozoa were investigated. The interfering quantitative factors tested were: intake level (g DMI/day per kg BW), total tract digestibility of organic matter (OM), NDF, starch and CP (%), rumen total concentration of VFAs (mmol/l), proportions of C2, C4 and propionate (C3) (mol/100 mol), C2/C3 and (C2+C4)/C3 ratios (mol/mol), pH and concentrations of bacteria and methanogens (cells/ml) in rumen fluid. The interfering qualitative factors tested were: method of CH4 measurement (SF6, chamber), CH4 mitigation strategy (biotechnology, additives, feed components and association), animal species (large or small ruminants), method of distribution of the additive (dose−response, source and form) and rumen sampling time (before feeding, i.e., more than 6 h after last feeding; after feeding, i.e., less than 6 h after last feeding; and average of before and after feeding).
The influence of these factors on the response law of CH4 to protozoa was tested in a three-step process as described previously (Loncke et al., Reference Loncke, Ortigues-Marty, Vernet, Lapierre, Sauvant and Nozière2009). The first step consisted in highlighting the interfering factors influencing the three parameters of the model: slopes, least square means (LSMeans) and residuals (i.e. the difference between observed CH4 emission and emission predicted by the response law). A factor influencing the slopes or residuals may explain differences in variations of CH4 emission between experiments for a similar variation in protozoa concentration. A factor influencing the LSMeans may explain the differences in CH4 emission between experiments for a same level of protozoa. Slopes and LSMeans of each experiment used in the determination of the response law were calculated and their correlation with quantitative factors was tested. Residuals (observed minus predicted CH4 emission) were calculated for all the treatments in the database, except for experiments testing defaunation, in order to ensure a normal distribution of the residuals. The relationship between residuals and quantitative factors was tested using the GLM procedure with experiment as a fixed factor:
 $${\rm Residuals}=\alpha {\plus}\alpha _{i} {\plus}\beta {\times}{\rm factor}{\plus}\beta _{i} {\times}{\rm factor}{\plus}e$$
where α, α i , β, β i and e were as defined in equation (1). A reliable within-experiment response is achieved only with a minimal variation of the factor. Thus, for each factor, the within-experiment variation was calculated and the experiments presenting the 25% lowest variations were not included in the GLM. The influence of qualitative factors on the model parameters was tested with a one-way ANOVA.
In the second step of the analysis, the significant interfering factors were included individually in equation (2). Quantitative factors were tested as additional covariable, either in substitution of the experiment effect (equation (4)) or in addition to the experiment effect (equation (4′)):
 $${\rm CH}_{{\rm 4}} =\alpha {\plus}\beta {\times}{\rm protozoa}{\plus}\gamma {\times}{\rm factor}{\plus}e$$
 $${{\rm CH}_{4} =\ \alpha {\plus}{\rm }\alpha _{i} {\plus}{\rm }\beta {\times}{\rm protozoa}{\plus}{\rm }\beta _{i} {\rm }{\times}{\rm protozoa} \atop \cr {\plus}\gamma {\times}{\rm factor}{\plus}{\rm }\gamma _{i} {\times}{\rm factor}{\plus}{\rm }e$$
where α, α i , β, β i and e were as defined in equation (1), γ is the linear term for the factor and γ i the fixed effect of the experiment i on the factor slope. This approach allows the identification of factors able to replace the experiment effect while explaining a part of the variability between experiments not explained by the model. Qualitative factors were added as fixed effects to the equation (2) with the experiment effect nested within the factor:
 $${{\rm CH}_{4} =\ \alpha {\plus} \alpha _{{i{\rm }}} ({\rm factor}){\plus}\beta {\times}{\rm protozoa}{\plus}{\rm factor} \atop \cr {\plus}{\rm factor}{\times}{\rm protozoa}{\plus}e$$
where α, β and e were as defined in equation (1) and α i is the fixed effect of the experiment i (nested within the qualitative factor) on the overall intercept α. In a third step, significant interfering quantitative factors were included simultaneously in equation (2) to rank them in terms of how much they contributed to the relationship between CH4 and protozoa.
At each step of the meta-analysis process, graphical observations were made to check the coherence of relationships, and to identify obviously abnormal values. All statistical analyses were carried out using Minitab, Version 16. Statistical significance was considered at P⩽0.05 and a trend was declared at P<0.1.
Results
Description of the meta-design
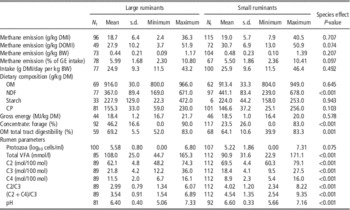
A summary of the main database parameters is given in Table 1. Information is presented separately for large and small ruminants, represented by 37 experiments with dairy and beef cattle and 39 experiments with sheep and goats. No statistical difference was observed between animal species for CH4 emission (g/kg DMI, P=0.707; g/kg BW, P=0.207), intake level (g DMI/day per kg BW, P=0.492), gross energy of the diet (MJ/kg DM, P=0.452) or diet CP and OM content (g/kg DM, P=0.103 and 0.645, respectively). In contrast, small ruminants had a more fibrous diet with a higher NDF content (g/kg DM, P<0.001) and a lower diet OM digestibility (%, P=0.001), inducing a higher proportion in the rumen of C2 and lower proportions of C3 and C4 (mol/100 mol, P<0.001) than in large ruminants. Rumen protozoa concentration (log10 cells/ml) tended to be lower in small than in large ruminants (P=0.075).
Description of the complete database: methane emission, intake, diet composition and rumen parameters in large and small ruminants

N t=number of treatments; DMI=dry matter intake; GE=gross energy; DOMI=digestible organic matter intake; OM=organic matter; VFA=volatile fatty acids; C2=acetate; C3=propionate; C4=butyrate.
The CH4 emission tended to be higher when expressed in g/kg digestible OM intake (P=0.074), and lower when expressed as a percentage of gross energy intake (P=0.097), in small compared with large ruminants. On these reduced data sets presenting measurements of OM digestibility or gross energy intake, CH4 emission expressed in g/kg DMI did not differ between small and large ruminants (P=0.899 and 0.481, respectively).
To measure CH4 emission, 31 experiments (N t=88) used the SF6 tracer technique and 45 experiments (N t=131) used open or closed chambers. Protozoa concentration was determined from rumen samples taken before feeding (N exp=19, N t=64), after feeding (N exp=34, N t=89) and both before and after feeding (N exp=17, N t=47). This information was unclear or not reported in six experiments (N t=19). To determine protozoa concentrations, counting chambers were used in 70 experiments (N t=201) and 6 experiments (N t=18) used qPCR.
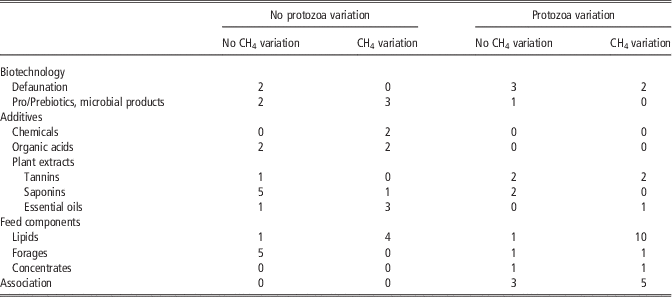
Information on CH4 emission (g/kg DMI) and protozoa concentration (log10 cells/ml) was collected for 70 experiments (N t=198). The distribution of these experiments according to their variation in CH4 or protozoa is presented in Table 2. The χ 2 tests showed that no variation in protozoa was mostly observed in experiments from the ‘additives’ strategy, whereas all the experiments in the ‘association’ strategy reported variation in protozoa (P=0.004). Conversely, if the effect on protozoa was not considered, no specific strategy affected CH4 emission (P=0.376). Looking simultaneously at their effects on protozoa concentration and/or CH4 emission, strategies were statistically related to specific effects on these parameters (P=0.032). No variation in either protozoa or CH4 was observed in 19 experiments, in particular those testing different forages. Conversely, 15 experiments reported a variation in CH4 with no variation in protozoa, mostly experiments testing chemicals or essential oils. In all, 14 experiments reported a reduction of protozoa concentration with no change in CH4 emission. A reduction of protozoa concentration was associated with a reduction of CH4 emission in 22 experiments. Experiments testing tannins and lipids were the most numerous in this last group.
Number of experiments without or with significant within-experiment variation of protozoa concentration (log10 cells/ml) or methane emission (g/kg dry matter intake)
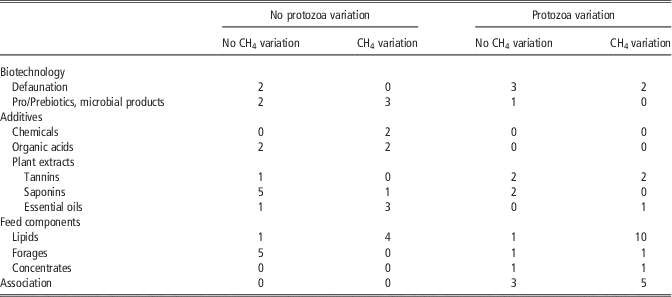
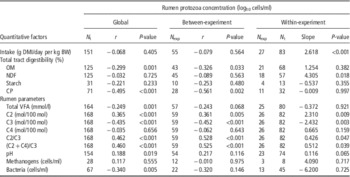
Table 3 reports the correlations between rumen protozoa concentration and quantitative factors. With a global analysis approach, rumen protozoa were negatively correlated to OM and CP total tract digestibility (P=0.001), rumen total VFA concentration (P=0.001), C3 proportion (P<0.001) and bacteria concentration (P=0.005). Using the same approach, rumen protozoa concentration was positively correlated to rumen pH (P=0.019), proportion of C2 (P<0.001) and the ratios C2/C3 and (C2+C4)/C3 (P<0.001). Similar trends were observed with the between-experiment analysis approach, except for rumen pH and bacteria, which were no longer correlated to protozoa. With the within-experiment approach, intake, NDF digestibility, rumen proportion of C2 and the ratios C2/C3 and (C2+C4)/C3 were positively correlated with protozoa (P<0.001, P=0.018, 0.009, 0.047 and 0.039, respectively), whereas rumen proportion of C3 was again negatively correlated to this parameter (P=0.003). In none of these approaches were rumen proportion of C4 and number of methanogens correlated to protozoa. The rumen protozoa were significantly affected by animal species, CH4 mitigation strategy and rumen sampling time (P=0.027, 0.031 and 0.006, respectively; data not shown) and a tendency was observed with the method of distribution (dose−response, source and form) of the additive (P=0.061; data not shown).
Global correlation, between- and within-experiment (equation (1)) relationship between rumen protozoa concentration and quantitative factors
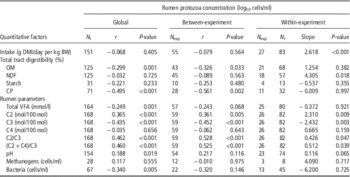
N exp=number of experiments; N t=number of treatments; DMI=dry matter intake; OM=organic matter; VFA=volatile fatty acids; C2=acetate; C3=propionate; C4=butyrate.
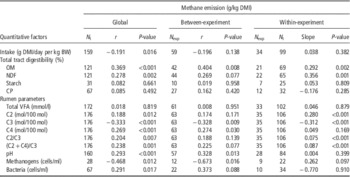
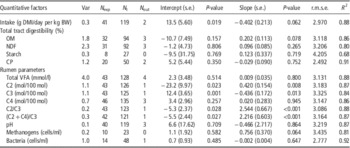
Table 4 reports the correlations between CH4 emission and quantitative factors. With a global approach, CH4 emissions were negatively correlated with intake (P=0.016), C3 proportion (P<0.001) and rumen methanogens (P=0.012), and positively correlated with OM and NDF digestibility (P<0.001 and P=0.002), C2 and C4 proportions (P=0.012 and P<0.001), C2/C3 and (C2+C4)/C3 ratios (P=0.007 and 0.001), rumen pH (P<0.001) and bacteria concentration (P=0.017). With the between-experiment approach, OM digestibility, C4 proportion and rumen pH were also positively correlated with CH4 (P=0.008, 0.030 and 0.013, respectively) and C3 proportion and methanogen concentration were negatively correlated with CH4 (P=0.009 and 0.016). The within-experiment approach yielded the same information as the between-experiment approach, except that C2 proportion was positively correlated with CH4 (P<0.001) unlike C4 proportion (P=0.169). CH4 emission was not significantly affected by animal species, CH4 mitigation strategy, CH4 method of measurement or the method of distribution of the additive (dose−response, source and form; P=0.131, 0.431, 0.084 and 0.331, respectively; data not shown).
Global correlation, between- and within-experiment (equation (1′)) relationship between methane emission and quantitative factors

N exp=number of experiments; N t=number of treatments; DMI=dry matter intake; OM=organic matter; VFA=volatile fatty acids; C2=acetate; C3=propionate; C4=butyrate.
Effects of a variation of rumen protozoa concentration on CH4 emission
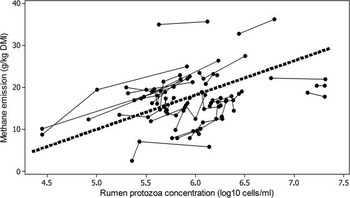
The within-experiment relationship between rumen protozoa concentration and CH4 emission is presented in Figure 1. When protozoa concentration ranged between 4.5 and 7.3 log10 cells/ml (0.3 and 206×105 cells/ml), the response law relating CH4 emission (g/kg DMI) to rumen protozoa concentration (log10 cells/ml) was linear (equation (2)):
 $${\rm CH}_{{\rm 4}}\ ={\minus}{\rm 3}0.{\rm 74}\, \left( {{\rm s}.{\rm e}.\, {\rm 5}.0{\rm 9}} \right)^{{{\asterisk}{\asterisk}{\asterisk}}} {\plus}{\rm 8}.{\rm 14}\, \left( {{\rm s}.{\rm e}.\,{\rm }0.{\rm 85}} \right)^{{{\asterisk}{\asterisk}{\asterisk}}} {\times}{\rm protozoa}$$
where N t=91, N exp=28, residual mean square error (r.m.s.e.)=1.94, R 2=0.93, adjusted R 2=0.90 and N out=0.
Relationship between methane emission and rumen protozoa concentration (raw data). The black dashed line represents the average within-experiment relationship (equation (2)).

Effects of interfering factors for the response law relating CH4 to protozoa
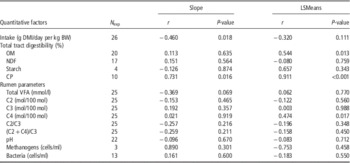
Table 5 presents the correlations between slopes and LSMeans of experiments from equation (2) with quantitative factors. One experiment presenting a very high slope value had to be excluded to get a normal distribution of slopes (P=0.210) and LSMeans (P=0.141). The digestibility of OM and CP and the rumen proportion of C4 were positively correlated to LSMeans (P=0.013, P<0.001 and P=0.017, respectively) and slopes were correlated with intake (P=0.018) and CP digestibility (P=0.016). No other significant correlation was observed.
Correlations between slopes and LSMeans of experiments from equation (2) with quantitative factors

N exp=number of experiments; LSMeans=least square means; DMI=dry matter intake; OM=organic matter; VFA=volatile fatty acids; C2=acetate; C3=propionate; C4=butyrate.
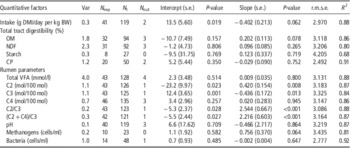
Table 6 gives the within-experiment correlation between quantitative factors and residuals determined from equation (2) for all the experiments in the database. The distribution of calculated residuals did not significantly differ from normality (P=0.054). They were positively correlated to rumen proportion of C2 (P=0.008) and the ratios C2/C3 and (C2+C4)/C3 (P<0.001) and negatively correlated to rumen proportion of C3 (P=0.013). No qualitative factors influenced slopes or LSMeans but residuals were influenced by method of CH4 measurement, CH4 mitigation strategy, distribution of additive, animal species and rumen sampling time (P=0.003, 0.021, 0.003, 0.018 and 0.006, respectively; data not shown).
Within-experiment relationship between the residuals (observed CH4 minus predicted CH4 with equation (2)) and quantitative factors (equation 3)
Var=minimum within-experiment variation level of the tested factor; N exp=number of experiments; N t=number of treatments; N out=number of outliers; r.m.s.e.=residual mean square error; DMI=dry matter intake; OM=organic matter; VFA=volatile fatty acids; C2=acetate; C3=propionate; C4=butyrate.
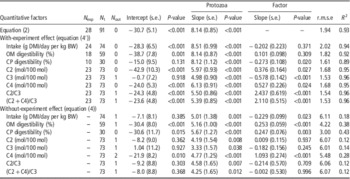
None of the qualitative factors appeared significant when included in the model with the experiment effect nested within the factor (equation (5); data not shown). Table 7 shows the response law relating CH4 to protozoa with significant quantitative factors added to or substituted for the experiment effect. Added to experiment effect, CP digestibility and C3 proportion were negatively correlated to CH4 emission (P=0.020 and P<0.001), whereas C2 and C4 proportions and the ratios C2/C3 and (C2+C4)/C3 were positively correlated to CH4 emission (P=0.027, P=0.024, P<0.001 and P<0.001, respectively). Substituted for experiment effect, OM and CP digestibility and rumen C4 proportion were positively correlated to CH4 emission (P<0.001, P=0.003 and P<0.001, respectively), whereas intake was negatively correlated to CH4 emission (P=0.023). When simultaneously including these four quantitative factors in equation (2) together with protozoa concentration (data not shown), protozoa concentration (P=0.028) and C4 proportion (P=0.018) explained 39% and 48% of the variability, experiment effect excluded. Intake, OM and CP digestibilities were not significant.
Relationship between methane emission (g/kg DMI) and rumen protozoa concentration (log10 cells/ml) with quantitative factors in addition (equation (4′)) or in substitution (equation (4)) of the experiment effect
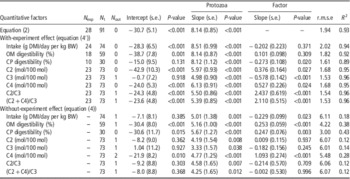
N exp=number of experiments; N t=number of treatments; N out=number of outliers; r.m.s.e.=residual mean square error; DMI=dry matter intake; OM=organic matter; C2=acetate; C3=propionate; C4=butyrate.
Discussion
The database was well balanced for animal species, with almost the same number of treatments between small and large ruminants. A confounding effect between diet composition and animal species was noteworthy, with large ruminants having a diet richer in energy than small ruminants. This led to differences in rumen fermentation profiles, with lower proportion of C2 and higher proportion of C3 in large ruminants. However, CH4 emission (expressed in g/kg DMI or g/kg BW) and protozoa concentration (log10 cells/ml) were homogeneously distributed between animal species. Consequently, it appears unlikely that any potential animal species effect would be revealed in further analyses.
Influence of CH4 mitigation strategy on CH4 and protozoa
Although the database was not built to evaluate mitigation strategies for their effect on CH4 emission and rumen protozoa, the χ 2 tests highlighted that most experiments testing lipids or tannins reduced both protozoa concentration and CH4 emission. This information confirmed that a potential mode of action of these compounds on methanogenesis is through protozoal inhibition. These additives may change protozoa membrane permeability, leading to cell lysis (Doreau and Ferlay, Reference Doreau and Ferlay1995; Goel et al., Reference Goel, Puniya, Aguilar and Singh2005). As reported in a previous review, the effects of these compounds is variable depending on the source, the mode and the length of administration (Popova et al., Reference Popova, Morgavi, Doreau and Martin2011). This could explain the variability of the effects of these additives on protozoa concentration. As an example, lipid effect on protozoa is dependent on the fatty acid profile, with a higher effect of medium chain fatty acids than polyunsaturated ones, which was confirmed by our data: lauric acid tended to reduce protozoa more markedly than polyunsaturated fatty acids (Jordan et al., Reference Jordan, Lovett, Monahan, Callan, Flynn and O’Mara2006).
Defaunation studies did not necessarily observe a reduction of CH4 emission. Difference in diets may explain this variable effect as removal of protozoa has a more marked effect on methanogenesis with high concentrate diets (Hegarty, Reference Hegarty1999). However, this effect was not clearly seen in our database, as two out of four experiments reporting no variation in CH4 emission after defaunation used a diet with 83% of concentrate. Conversely, in the two experiments showing a reduction of CH4 emission after defaunation, animals were fed a diet with more than 60% of concentrate.
Chemicals, essential oils and organic acids were identified as methanogenesis reducers without affecting protozoa. Two different mechanisms can be pointed out for these additives. On the one hand, some essential oils are known to directly inhibit growth and activity of methanogens inducing a direct reduction of CH4 emission (Calsamiglia et al., Reference Calsamiglia, Busquet, Cardozo, Castillejos and Ferret2007). On the other hand, some chemicals and organic acids divert H2 from methanogenesis to other pathways. For example, nitrate and sulphate are reduced to ammonia and hydrogen sulphide, respectively, with the consumption of 4 mol of H2 (Ungerfeld and Kohn, Reference Ungerfeld and Kohn2006). Enhancing C3 synthesis with malate or fumarate, which are precursors of C3, is another way to divert H2 from methanogenesis (Ungerfeld et al., Reference Ungerfeld, Kohn, Wallace and Newbold2007). However, experiments testing organic acids in our database were inconclusive, as already reported in a previous review (Hook et al., Reference Hook, Wright and McBride2010). A part of added fumarate may be used for C2 production, balancing the effect on C3 production (Ungerfeld et al., Reference Ungerfeld, Kohn, Wallace and Newbold2007).
Finally, in our data set, forage modification, addition of probiotics, prebiotics or exogenous microbial products had a weak influence on protozoa concentration, whereas their effect on CH4 emission was variable. The mechanisms of action of these additives on CH4 emission remain to be clarified. Probiotics and prebiotics may either enhance specific microbial groups able to use excess H2 for C3 synthesis, or stimulate microbial growth leading to a higher H2 consumption for microbial biomass synthesis (Jeyanathan et al., Reference Jeyanathan, Martin and Morgavi2014). However, in one experiment testing probiotics, CH4 yield was reduced by 25% with no changes in ruminal fermentation and protozoa (Lettat, Reference Lettat2012).
Effects of a variation in protozoa concentration on CH4 emission
To our knowledge, only one publication has established a quantitative relationship between numbers of protozoa and CH4 emission (Morgavi et al., Reference Morgavi, Forano, Martin and Newbold2010). In that work using a data set of 21 experiments, the number of protozoa explained 47% of the variability in CH4 emission (r.m.s.e.=3.25). CH4 was reduced by 1 g CH4/kg DMI by every decrease of 0.12 log10 protozoa cells/ml. In agreement with these findings, we showed that rumen protozoa concentration explained 93% of the variability in CH4 emission, and that a reduction of 0.12 log10 protozoa cells/ml induced a reduction of 1 g CH4/kg DMI (r.m.s.e.=1.94). Our analysis is more reliable than the previous work as it included seven additional experiments and presented a lower r.m.s.e. In addition, our approach distinguished between intra and inter-experiment effects, and focused more specifically on experiments with a significant within-experiment variation of protozoa concentration. Equation (2) can be used to quantify with a good accuracy the impact of changes in protozoa concentration (in the range 4.5 to 7.3 log10 cells/ml) on CH4 emission in the wide diversity of intake level and diet composition defined by the meta-design. However, the significant experiment effect implies that this equation cannot accurately estimate the absolute CH4 emission from a measured protozoa concentration. Consequently, the study of interfering factors is required.
Interfering factors for the response law relating CH4 to protozoa
One aim of this study was to improve our understanding of the relationship between CH4 and protozoa by testing different quantitative and qualitative potential interfering factors. A reliable interfering factor can be accepted if its inclusion into the response law does not lead to a large variation in the initial equation slope (protozoa linear term). When including the experiment effect, the slopes associated with CP digestibility, VFA proportions and the ratios C2/C3 and (C2+C4)/C3 were significant, but the r.m.s.e. of the overall equations were only slightly improved. However, the change in the mean slope (or its s.e.) associated with protozoa demonstrated confounding effects between quantitative interfering factors and experiment effect. A positive relationship between the C2/C3 ratio and CH4 emission has already been quantified by a meta-analysis approach (Sauvant et al., Reference Sauvant, Giger-Reverdin, Serment and Broudiscou2011). With the present database, a similar relationship was observed (P<0.05; data not shown), and the residuals of this relationship were evidenced to be positively correlated to rumen protozoa (P<0.001; data not shown).
When substituting for the experiment effect, intake, OM and CP digestibility, and rumen proportion of C4 significantly influenced the response law relating CH4 to protozoa, but strongly modified the slope associated with protozoa, and markedly increased the r.m.s.e. This result shows that taking into account experimental effects provides the most precise estimate of the influence of protozoa on CH4 production.
When simultaneously adding intake, OM and CP digestibility and rumen proportion of C4 in equation (2), C4 proportion was the main interfering quantitative factor, with a strong contribution to the explained variability. It is known that protozoa preferentially ferment OM to C4 rather than to C2 or C3 (Williams and Coleman, Reference Williams and Coleman1992; Brossard et al., Reference Brossard, Martin, Chaucheyras-Durand and Michalet-Doreau2004). Surprisingly, in our database, we did not find any significant relationship between protozoa and C4, showing that C4 concentration cannot be considered as a direct indicator of rumen protozoa activity. Other microbial populations may be responsible for C4 production, such as Butyrivibrio fibrisolvens (Stewart et al., Reference Stewart, Flint and Bryant1997). Unfortunately, our database contained limited information about quantity or diversity of other rumen microbes, precluding further analyses.
The response law relating CH4 to protozoa is independent of qualitative factors such as method of CH4 measurement, animal species or CH4 mitigation strategy. No effect of mitigation strategies was observed on the relationship between protozoa and CH4, as only experiments showing a relevant within-experiment variation of protozoa concentration were included in the analysis, which strongly oriented the selection towards experiments testing lipids (nearly half of the eligible experiments).
Conclusion
By building an exhaustive database from experiments with data for CH4 emission and rumen protozoa concentration on the same groups of animals, we showed that a reduction of protozoa concentration was in most cases indicative of a reduction of CH4 emission. We also quantitatively assessed the effect of a variation in protozoa concentration on CH4 emission. We showed that this relationship was positively influenced by the proportion of butyrate in the rumen.
Acknowledgement
J. Guyader is the recipient of an INRA-Région Auvergne PhD scholarship.