


1. Introduction
Deep-sea sediment cores from the North Atlantic reveal six–seven layers of ice-rafted terrigenous debris (IRD) deposited during the time period between the onset of North American glaciation during isotopic stage 5 and the Younger Dryas (Heinrich, 1988; Bond and others, 1992: Broecker, 1994). These layers, deposited over a short, century-scale time span, are virtually devoid of marine foraminiferous sediment, are spatially widespread and imply an 1RD flux to the ocean floor that far exceeds the background flux during glacial times. The remarkable IRD deposition events implied by these layers are called Heinrich events after Heinrich (1988), who first noticed the cyclicity of peak IRD deposition in North Atlantic sediments.
A satisfactory explanation of Heinrich events has yet to be achieved (e.g. Broecker, 1994). The hypothesis we explore here is that Heinrich events were dramatic surges of an ice stream in Hudson Strait which flooded the North Atlantic with armadas of sediment-laden icebergs. Several recent observations lend credibility to this hypothesis. Heinrich layers are rich in detrital carbonate and other rock types that are sourced in Hudson Strait and Hudson Bay (Broecker, 1994). Heinrich layers are continuous and thicken towards the mouth of Hudson Strait (Andrews and Tedesco, 1992; Dowdeswell and others, 1995). Heinrich events occur at times of inconsistent orbitally induced insolation (Maslin and Shackleton. 1995). Moreover, Heinrich events correlate with low-salinity events in the North Atlantic (Maslin and Shackleton, 1995), suggesting that the volume of melting icebergs in the North Atlantic was also above glacial background levels during Heinrich events. Our purpose is to evaluate further the credibility of the surge hypothesis using ice-sheet model experiments.
Two classes of explanation for these events have been proposed. One, the “external forcing” explanation, holds that climate forcing triggers a Hudson Strait ice-stream surge or, in the absence of a plausible triggering mechanism, otherwise promotes unusually extensive rafting of ice-entrapped sediment. Evidence for an external climate forcing is the coincidence between the periodicity of Heinrich events and the periodicity of forcing; although irregular, the 7–12 ka period of these events is similar to the half-period of the Earth’s precession cycle that can enter the climate system through geographic filtering of Milankovitch cycles (e.g. Short and others, 1991). Further evidence comes with the new discovery of additional, reduced-magnitude ice-rafting events in the North Atlantic sediment record, which occur between Heinrich events, and appear to correspond with stadials (abrupt cold events) seen in the Greenland ice-core records (Bond and Lotti, 1995).
The other class of explanation, the “internal forcing” explanation, holds that Heinrich events are free oscillations of the ice sheet that are independent of climate conditions. Using a highly idealized model of ice flow and basal temperature. MacAyeal (1993a, b) has argued that free oscillations (a “binge/purge theory”) of a Hudson Strait ice stream are plausible under certain simplifying assumptions concerning how ice flow reacts to a switch between frozen and temperate basal conditions. As with the external-forcing explanation described above, motivation for the internal-forcing explanation comes from the estimated periodicity of ice rafting in the North Atlantic. Payne (1995), in an important improvement on the highly idealized model of the binge/purge theory, showed that a two-dimensional dynamic thermodynamic model of an ice sheet resting on initially flat bedrock topography can have free oscillations under constant climate conditions with periods in the order of 103–104 a.
Since the observed periodicity supports the external-as well as the internal-forcing explanation, it does not help us to distinguish between them. A further complication is the interdependence between the presence and extent of ice sheets and climatic conditions. Remedy may be provided from precise dating of Heinrich events on the one hand and associated climatic changes on the other, in order to find out what is cause and what is effect (provided that this separation is possible after all).
Aside from their paleoclimatological significance, Heinrich events may shed light on the possible effects of global change on present-day ice sheets. For instance, a similar surge of one or more ice streams in the West Antarctic ice sheet could cause a sea-level rise of up to 5 m, with drastic consequences to some highly populated regions on Earth.
To further test the internal forcing explanation of Heinrich events, we display simulations of ice-flow and temperature conditions along a transect of the Laurentide ice sheet leading from its lobate continental margin, across the divide, to its iceberg-calving terminus in Hudson Strait. These simulations are made using the polythermal ice-sheet model developed by Greve (l995). (The term “polythermal” used here refers to the fact that this model explicitly accounts for the water/ice mixture that can exist in an ice sheet when volumetrically significant parts become temperate.) Ten different boundary-condition sets (each supposed to represent idealized, time-independent glacial conditions) are employed to see how the Laurentide ice sheet grew from an ice-free initial state. Our simulations reveal internal oscillations of flow and temperature that can be identified with Heinrich events.
2. Modelling Approach
We use a coupled dynamic/thermodynamic ice-sheet model. SICOPOLIS (SImulation COde for POLythermal Ice Sheets), developed by Greve (1995), that integrates the time-dependent equations governing ice-sheet extent and thickness, ice velocity, temperature and water content along the flowline shown in Figure I. We do not take into account the special dynamical properties (e.g. longitudinal stress gradients, sediment deformation details) of an ice-stream flow regime in Hudson Strait or of an ice shelf further downstream. This restriction affords us the possibility of determining whether Heinrich events are intrinsic to ice sheets in general or are specialized phenomena of ice streams and shelves.
A leading feature of the model we use is its ability to treat ice within the body of the ice sheet as temperate, i.e. “polythermal”. In regions where ice is below the melting point, the energy-conservation equation is used to determine the evolution of the temperature field

(x, horizontal coordinate; z, vertical coordinate (height a.s.l.); t, time; v x , horizontal velocity; v z , vertical velocity; T, temperature: ρ, ice density; c, specific heat of ice; k, heat conductivity of ice; A(Tʹ). creep-rate factor for cold ice dependent on homologous temperature Tˉ; E, creep-enhancement factor; σ, effective shear stress; n, exponent in Glen’s flow law). In temperate ice, the energy-conservation equation is used to govern the production and advection of the water held within veins and fluid inclusions of the ice. The two regions, cold and temperate, are separated by a cold temperate transition surface (CTS), whose motion is described by the kinematic equation and the dynamic conditions that are peculiar to this type of Stefan problem (see Greve (1995), for further detail). We emphasize a detailed treatment of temperate ice in our study because of the crucial role played by near-basal temperature conditions in the possible occurrence of internal oscillations.
The modelled flowline of the Laurentide ice sheet from the southern ice margin along Hudson Bay and Hudson Strait to the. North Atlantic. Regions of crystalline bedrock and unlithified sediment are delineated using the map from Jenson (1994).

In temperate ice, water held within inclusions and veins is governed by the water-content equation (Greve, 1995; Greve and Hutter, 1995)

(ω, water content; L, latent heat of ice; A t(ω), creep-rate factor for temperate ice; D(ω), water-drainage function. In this equation, the local change of water content with time is balanced by horizontal and vertical advection, water production due to strain heating, water drainage and a small Clausius–Clapeyron correction (“CCC”, not given explicitly here; see Greve (1995)) resulting from the pressure-dependence of the melting temperature. It is assumed that water travels with the same velocity as ice. Preliminary computations revealed that a water-drainage mechanism must be included, however, to ensure that water content does not exceed 100%. On a higher level of complexity, this drainage mechanism could be something like an extended Darcy law (Hutter, 1993), describing the interaction force between water and ice travelling with different velocities. For our study, however, we introduce a simple empirical drainage function D(ω) (Greve, 1995; Greve and Hutter, 1995) that is based on measurements of typical water-content values in glaciers

According to this formulation, any water surplus exceeding the threshold value ωmax is assumed to drain instantaneously to the subglacial bed.
The Laurentide ice sheet is underlain by two fundamentally different types of bedrock, crystalline and unlithified, soft sediment. This fact plays an important role in the basal boundary conditions. In particular, our basal-sliding law distinguishes between these two types of bed. Jenson (1994) modelled a flowline extending from the ice-sheet dome southward across the soft sediments of the Lake Michigan lobe, and found reasonable success using a no-slip condition for crystalline bedrock and a slightly non-linear viscoplastic behavior for soft sediment. Since we have no means to verify the details of sediment movement at the bed of Hudson Strait, we simplify the flow law for soft sediment used in Jenson’s study by assuming a constant thickness of the shear layer and by disregarding non-linearity in the viscous component of sediment deformation. By adopting the lower boundary of Jensen’s (1994) measured sediment viscosities, μ = 5.2 × 10⁹ Pas, and a shear-layer thickness of H shear = 2 m, representing an average value of Jenson’s (1994) calculated thicknesses, we obtain the basal sliding law
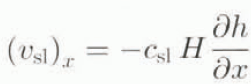
((v sl) x , basal sliding velocity; c sl, sliding coefficient; H, ice thickness; h, z coordinate of the free surface); with c sl = 100a−1. This basal sliding law describes the basal-sliding velocity above unlithified sediment in the case of a temperate ice base. In the absence of a temperate ice base, we assume a vanishing basal-sliding velocity regardless of the nature of the basal bedrock.
Summary of further model features
Model equations based on the shallow-ice approximation (Hutter, 1983; Morland, 1984).
Two-dimensional flowline model incorporating flow-band width variation, based on finite differences.
Polythermal calculation (as described above).
Lithosphere; evolution of temperature calculated in a layer of thickness H r (this requires knowledge of lithosphere density ρr, specific heat c x and heat conductivity K r); reaction on varying ice load accounted for by assuming local isostasy (based on ice density ρ and asthenosphere density ρa) with time lag τV.
Horizontal resolution: 17.5 km.
Time step: 1a for the calculation of velocity and ice topography, 10a for the calculation of ice temperature and water content.
In the vertical; σ coordinates for each of the three regions (lithosphere: 11 equidistant grid points, temperate ice: 11 equidistant grid points, cold ice: 51 grid points with densification towards the bottom), i.e. vertical columns are mapped to [0, 1] intervals.
Temperature and water-content equation: implicit discretization of z derivatives, explicit discretization of x derivatives (upwind scheme for the horizontal advection terms).
Height-evolution equation: implicit discretization of x derivatives.
Glen’s flow law with n = 3 and an enhancement factor E = 3 (accounting for the apparent stiffness reduction of ice accumulated during glacial periods); rate factor A depending on homologous temperature in the case of cold ice (commonly used exponential law A(Tʹ) = A 0exp(−Q/R(T 0 + Tʹ)) with two different activation energies Q for Tʹ < − 10°C and Tʹ > − 10°C, respectively and the absolute temperature T 0 = 273.15 K, see Paterson (1994)) and on water content in the case of temperate ice (A t(ω) = A(Tʹ = 0°C) × (1 + 184ω), according to Lliboutry and Duval (1985)).
The values for the physical quantities used in the model are listed in Table 1.
3. Modelling a Laurentide ICE-Sheet Flowline
3.1. Flowline topography
Our main interest is the behavior of the Laurentide ice sheet in Hudson Bay and Hudson Strait. We therefore consider an approximate flowline, running from the position (ϕ, λ) = (40° N. 99° W), south of the ice margin determined for the Last Glacial Maximum 21 000 calendar years ago, through Hudson Bay and the center of Hudson Strait. Its eastern margin is situated at (ϕ, λ) = (60.9° N, 60.8° W), beyond the sill separating Hudson Strait from the open sea. Figure 1 shows the course of this flowline together with the regions of crystalline bedrock and unlithified sediment, determining the basal sliding regime. Figure 2 depicts the present bedrock topography z= b 0, assumed to be approximately in isostatic equilibrium with no ice load.
To correct for flow-band width denoted by s) variation, we introduce a term proportional to ds/dx in the mass-balance equation governing the evolution of ice thickness H, so that

(q
x
, horizontal mass flux;  surface accumulation-ablation function;
 , basal melting rate), and estimate a flow-band width s(x) around the constructed flowline. We assume s(x) to be approximately constant in the southern part and use the present margin contours of Hudson Bay and Hudson Strait as flow-band limits in the northern part (Fig. 1). This affects mainly the transition zone between Hudson Bay and Hudson Strait, where the correction accounts for the channeling effect of Hudson Strait on the ice flow toward the North Atlantic.
Values for the distinct physical quantities used in the model calculations

Present bedrock topography along the modelled flowline (see Fig. 1), assumed to represent the isostatic equilibrium with no ice load, z = b0, x = 0 represents the southern flowline end, x = 3500 km represents the north-eastern end where icebergs are assumed to discharge into the North Atlantic.

3.2. Standard glacial boundary conditions
All model experiments simulate the Laurentide ice sheet under time-independent, glacial climate conditions. For the mean annual air temperature, T ma, above the ice we apply a function of latitude, ϕ, and height above sea level, h, derived by Reeh (1991) for the Greenland ice sheet under present climate conditions:

with θ1 = 38.38°C, θ2 = −0.007924°C m−1 and θ3 = −0.7512°C × (deg N. lat.)−1. The value of θ1 given here is 10°C below Reeh’s value to account for glacial conditions.
The accumulation—ablation function  consists of two parts, namely surface snowfall, S
0, and surface melting, M, from which it can readily be obtained via
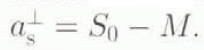 . As for the snowfall, ice-core analyses indicate that glacial accumulation rates were about one-hall to one-fourth of present values. We thus choose S
0 = 0.3 ma−1.
The ablation rate (surface melting) is parameterized according to Calov (1994) following the degree-day model (Braithwaite and Olesen, 1989; Reeh, 1991). This method couples the melting rate linearly to the air-temperature excess above 0°C; it is distinguished between (i) transformation of snow via water to superimposed ice (i.e. ice above firm and (ii) melting of ice.
The ice-surface temperature T s is assumed equal to the mean annual air temperature, T ma, unless the formation rate of superimposed ice, M*, exceeds the ice-melting rate, M. In this circumstance, an empirical firn-warming correction due to the latent-heat release of the remaining superimposed ice is applied (Reeh, 1991);

with the firn-warming correction coefficient μfwe = 24.206°C m−1 a. Naturally, T s must not exceed the melting point of ice. Hence, we constrain T s to a maximum of −0.001°C; the slightly negative value is artificially introduced to avoid a temperate ice-sheet surface. This circumvents problems associated with the upper-boundary condition for water content and has little effect on the outcome of our study.
The remaining boundary condition affects the lower boundary of the model domain, the lithosphere base. Here, the geothermal heat flux is required by the mode and we use the standard value for Precambrian shields, namely  (Lee, 1970).
3.3. Model experiments
In the following, we wish to discuss ten model experiments, all of them aimed at building up the Laurentide ice sheet under idealized, time-independent glacial climate conditions, starting from an ice-free initial condition. Run rlp01 is our control experiment and is carried out subject to the standard conditions defined in sections 2 and 3.2: in runs rlp02–rlplO several properties are varied, namely
Run rlp02: subglacial meltwater storage in the unlithified sediment regions included, acting as reservoir of latent energy. Hereby, the evolution of the thickness of the meltwater column, H w, is calculated by
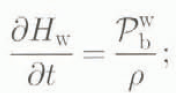
H w corresponds to an amount of latent energy per unit area

at the ice-sediment interface. It is furthermore assumed that the restriction H w ≤ 25 m holds and any surplus is regarded as draining away. Because of temperature steadiness, the effect of the presence of subglacial meltwater is that at any position the ice base remains temperate as long as H w > 0 is fulfilled; in other words, the entire amount of meltwater must refreeze before the basal temperature can switch from temperate to cold.
Run rlp03: θ1 = 37.38°C (mean annual air temperature decreased by 1°C).
Run rlp04: c sl = 50 a−1 (basal-sliding coefficient cut down in half).
Run rlp05: θ2 = −0.007 C m−1 (lapse rate for mean annual air temperature increased by approximately 0.001°C m−1).
Run rlp06: S 0 = 0.2 ma−1 (snowfall decreased by one-third).
Run rlp07: E = 2.5 (enhancement factor in the flow law decreased by 0.5).
Run rlpOB: τv = 10 000 a (time lag for bedrock sinking increased by 7000 a).
Rim rlp09: polythermal mode switched off. Instead solution of the temperature equation for cold ice in the entire ice-sheet domain, afterwards resetting of temperatures that exceed the pressure-melting point on the pressure-melting point.
Run rlp10: calculation without horizontal advection in the temperature and water-content equations.
The runs cover an iteration time of 60 000 years, representing the approximate time the Laurentide ice sheet had for growth during the Wisconsin glacial period.
3.4. Discussion of model results
In Figure 3, the total ice volume of the modelled transect V tot, the ratio of temperate to total ice volume P temp the ice-covered area A i,b, the area covered by temperate ice A t,b, and the iceberg discharge from Hudson Strait qHS are depicted for all runs as functions of time. Here, qHS assumed equal to the mass flux q x through the last grid cell x ϵ [3482.5 km, 3500 km] of the model domain immediately adjoining the ocean (see Fig. 2). This is indeed a good measurement for the iceberg discharge, because it represents the amount of ice flow towards the ocean that is not compensated by melting, i.e. the calving rate. If the second-to-last grid point at x = 3482.5 km is ice-free and therefore the mass flux through the last grid cell is equal to zero, the seaward ice flow from the inner ice-sheet region is annihilated by surface and basal melting before reaching the coast, and thus calving does not appear (no iceberg discharge).*
In all cases except rlp02. P temp and A t,b, undergo an oscillatory behaviour. In rlp02, the A t,b oscillations are much smaller and vanish after 30 ka but p temp, remains slightly oscillating. Of particular interest in our effort to understand Heinrich events is the iceberg discharge through Hudson Strait, qHS. This variable is seen to be oscillatory in all runs except rlp02 and rlp06, demonstrating that the presence of discharge events is not particular to a special set of parameters. The onset of iceberg-discharge oscillations is in all cases delayed 15–25 ka from the inception of the ice sheet. This is because the ice sheet needs a finite amount of time to reach the North Atlantic by growing down the Hudson Strait channel. Iceberg-discharge in run rlp02 is predominantly smooth (we are unable to judge the significance of two tiny negative peaks during the last 4 ka of the model time). Also of note is the iceberg-calving flux of rlp06 which does not become oscillatory until the last 1000 years of the model time. This is explained by the fact that lower snowfall in this run means that the ice sheet does not grow sufficiently fast to reach its iceberg-calving terminus until late in the model run.
The oscillations of A t,b, p temp and qHS coincide; high .A t,b and P temp values entail high qHs values and vice versa. This is in agreement with the idealization of the binge/purge theory: extensive temperate ice at the base provides extensive basal sliding and, as a consequence, extensive iceberg discharge. Due to the high ice velocities, advection of cold surface ice towards the bottom is enhanced during such an event, resulting in a decrease of A t,b, until basal sliding can no longer sustain a significantly elevated iceberg-calving flux. During the quiet phase, when little temperate ice exists at the bed, the ice sheet grows. As it grows, the base becomes warmer and eventually temperate basal conditions build up sufficiently to initiate the next discharge event.
Why do the oscillations of qHS not appear in rlp02? This can be understood by the influence of the meltwater layer on the basal temperature conditions. In section 3.3, we stated that with a meltwater layer included, a temperate ice base must remain temperate until the underlying meltwater has refrozen completely. This condition causes a thermal “inertia effect” on the meltwater layer and its stored latent energy, hampering the switch from a predominantly temperate base to a predominantly cold one after a discharge event. Therefore, as opposed to the other runs with no meltwater layer taken into account, temperate basal conditions prevail, leading to a continuous iceberg discharge.
Fig. 3. Time evolution of the total ice volume Vtot (103 km2), the ratio of temperate to total ice volume ptemp (per mille), the ice coverage Ab, (103 km) along the modelled flowline (dashed line; total ice-covered basal area Ai,b, solid line: basal area covered by temperate ice At,b and the iceberg discharge into the North Atlantic qHS (km2 a−1 for the ten runs rlp01–rlp10 (rlp01 control, rlp02 subgtacial meltwater reservoir included. rlp03 mean annual air temperature decreased. rlp04 basal sliding decreased, rlp05 lapse rate for mean annual air temperature increased, rlp06 snowfall decreased, rlp07 enhancement factor decreased, rlp08 time lag for bedrock sinking increased, rlp09 polythermal model switched off. rlp10 no horizontal advection).

In rlp09, the polythermal calculation has been switched off. This has a major effect on the ratio of temperate ice volume to total ice volume, P temp, whose absolute values and oscillations are much bigger than for the polythermal simulation rlp01 (note the different axis scale for p temp of run rlp09 in Figure 3). This is due to the fact that solving the temperature equation for cold ice in the whole domain provides unrealistic temperatures above the pressure-melting point in pans of the ice sheet. Because of the implicit solution technique, this leads to a temperature field slightly too warm in the entire ice sheet, so that the amount of temperate-ice regions is over-predicted. However, the effect on A t,b, and qHS is only marginal; the main characteristics of the oscillations are the same in both cases. Evident differences occur in the time interval between 30 and 40 ka, where the oscillations provided by rlp09 appear to be more regular than the ones of rlp01. This shows that the oscillations are mainly due to the switch between basal sliding and basal adhesion; the presence of a soft (due to the strong dependence of the rate factor A t(ω) on water content temperate-ice layer above the base is of minor importance.
Run rlp10 was carried out without accounting for horizontal advection in the evolution equations for temperature (cold regions; Equation (1)) and water content (temperate regions; Equation (2)). The impact on the dynamic behaviour of the modelled ice-sheet flowline is remarkable. The ratio P temp is more than 10 times bigger than in the control run rlp01, and the oscillations of A t,b and qHS are of higher frequency and lower amplitude. In particular, after the onset of iceberg discharge at t = 29.2 ka it does not break down anymore, i.e. this run does not provide distinct discharge events interrupted by quiet periods. This is due to the fact that horizontal advection is responsible for the transport of cold surface ice from the inner ice-sheet regions towards the margin, where it enforces the switch from temperate basal conditions (basal sliding) to cold basal conditions (basal adhesion). However, since vertical advection also transports cold surface ice to the base, the binge/purge mechanism as explained above can still be sustained, so that some oscillatoric behaviour remains.
The range of model integration time steps that provide stable runs is very small. In order to test the possible influence on results, we carried out run rlp01 two more times with (i) △t = 0.5 a/5 a and (ii) △t = 2 a/20 a (instead of the standard set △t = 1 a/10 a (see “summary of farther model features”). Both of these runs crash between t = 50 ka and t = 55 ka; since then, they provide almost the same dynamic behaviour of the modelled ice sheet as standard run rlp01. Furthermore, the simulated periodicity (> l ka) is much bigger than the integration time steps, so that a purely numerical reason for the simulated oscillations can in all probability be excluded. However, we have not conducted three-dimensional simulations to check the consequences of the flowline restriction; with a horizontal resolution fine enough to include adequately the topography of Hudson Strait, this would require a large amount of CPU lime. Payne (personal communication (1995)) carried out three-dimensional simulations on the Laurentide ice sheet with a somewhat coarser resolution (△x = △y = 50 km) and observed subsequent on- and off-switch events of draining tee streams, indicating that oscillatoric behaviour still holds in the three-dimensional case.
Run rlp01; ice-sheet topography (z = h free surface, z = b ice base) along the modelled flowline for t = 58.7 ka (solid line, corresponds to high At,b and maximum qJHS) and t = 59.1 ka (dashed line, corresponds to low A t,b and qHS = 0).

Figure 4 shows the ice-sheet geometries for rlp01 at two stages in the cycle of iceberg discharge. At an active point in the cycle, specifically at t = 58.7 ka, corresponding to the second-to-last qHS peak in Figure 3, the seaward margin has advanced to the coast and the ice surface near the dome has lowered. For this time, qHS amounts to a total value of 2.71 km2 a−1, from which 0.99 km2 a−1 result from basal sliding according to Equation (4) and 1.72 km2 a−1 from internal deformation. At a quiet stage in the cycle, specifically at t = 59.1 ka, where qHS has come to zero afterward, the seaward margin has retreated and the surface elevation has grown again.
4. Conclusions
Qualitatively, our results demonstrate that a wide variety of model parameters can lead to free oscillations identifiable with Heinrich events. The quantitative aspects of our results, however, suggest that this identification is less convincing. First, the time between two subsequent modelled discharge maxima is between 1.5 and 5 ka for all simulations, whereas the Heinrich-event periodicity seems to be 7–12 ka (Heinrich, 1988; Bond and others, 1992). Yet new data give evidence for additional ice-rafting events with periods of 1–2 ka (Bond and Lotti, 1995), providing better agreement with our simulations.
Secondly, the intensities of the modelled discharge events may be too small to explain the large amounts of ice-rafted debris in the North Atlantic. Estimates of IRD layer thickness and areal extent. (Alley and MacAyeal, 1994; Dowdeswell and others, 1995) suggest that each Heinrich layer represents a volume of approximately 100 km3. It is not known how much ice is required to carry this debris volume, because observations of debris/ice-volume ratios for icebergs and ice streams are scarse. An estimate for this ratio of 1/1000 (10 m of dirty ice in a 100 m thick iceberg with the debris concentration of dirty ice at 1%) would require 105 km3 of ice to transport the debris contained in each Heinrich layer. To achieve a net ice discharge of this magnitude, the intensity of modelled discharge would have to be increased over the intensities achieved in our experiments. These shortcomings may indicate that, although a model based solely on grounded ice-sheet dynamics can yield free oscillations with periods in the same order of magnitude as the recorded ones, modelling of Heinrich events in their full intensity require the application of ice-stream dynamics (very low basal shear stresses, hence behaviour similar to ice shelves) in Hudson Bay and Hudson Strait.
Acknowledgements
The thorough reviews by A. J. Payne and C. Ritz of an earlier draft of this paper are gratefully acknowledged.
While performing this work R. Greve was supported by the Studienstiftung des Deutschen Volkes and the Department of the Geophysical Sciences, University of Chicago. D. R. MacAyeal was supported by the U.S. National Science Foundation under grant number NSF OPP 9321457.



