I. INTRODUCTION
Because of their outstanding chemical stability, electrical and mechanical properties, high-dielectric constant, and wide band gap, hafnium dioxide (HfO2) materials have been considered as one of the most important materials with a wide range of potential scientific and technological applications, such as electronics,Reference Tan, Chim, Cho and Choi1, Reference Buckley, De Salvo, Ghibaudo, Gely, Damlencourt, Martin, Nicotra and Deleonibus2 magnetoelectronics,Reference Goncalves, Carturan, Montagna, Ferrari, Zampedri, Pelli, Righini, Ribeiro and Messaddeq3, Reference Afify, Dalba, Armellini, Ferrari, Rocca and Kuzmin4 optoelectronics,Reference Lange, Kiisk, Reedo, Kirm, Aarik and Sildos5 and metal oxide semiconductor devices.Reference Wilk, Wallace and Anthony6, Reference Houssa, Pantisano, Ragnarsson, Degraeve, Schram, Pourtois, De Gendt, Groeseneken and Heyns7 Moreover, HfO2 is prospective material for optical filters, high-reflectivity mirrors, high-power lasers, and other optoelectric devicesReference Liu, Tibuleac, Shin, Young and Magnusson8–Reference Khoshman, Khan and Kordesch11 because of their high refractive index, low absorption from near-ultraviolet (UV) to mid-infrared (IR), and high threshold for laser damage.
It is well known that the optical property of HfO2 is one of the most important prerequisites for the preparation of HfO2 films with desired functions. Generally, the optical and electric properties of HfO2 films are highly dependent on the surface and interface structures, morphologies, and chemical stoichiometric. These aspects can usually be controlled by the preparation techniques, growth conditions, and post treatments.Reference Goncalves, Carturan, Montagna, Ferrari, Zampedri, Pelli, Righini, Ribeiro and Messaddeq3–Reference Lange, Kiisk, Reedo, Kirm, Aarik and Sildos5, Reference Liu, Tibuleac, Shin, Young and Magnusson8–Reference Khoshman, Khan and Kordesch11 Recently, the optical properties of HfO2 films grown by various methods have been extensively studied.Reference Lange, Kiisk, Reedo, Kirm, Aarik and Sildos5, Reference Liu, Tibuleac, Shin, Young and Magnusson8–Reference Modreanu, Sancho-Parramon, Durand, Servet, Stchakovsky, Eypert, Naudin, Knowles, Bridou and Ravet12 Much effort has been made to investigate the optical properties of HfO2 films with different structures.Reference Khoshman, Khan and Kordesch11, Reference Modreanu, Sancho-Parramon, Durand, Servet, Stchakovsky, Eypert, Naudin, Knowles, Bridou and Ravet12 HfO2 has been known to possess several crystalline phases, such as monoclinic, tetragonal, and cubic ones.Reference Modreanu, Sancho-Parramon, Durand, Servet, Stchakovsky, Eypert, Naudin, Knowles, Bridou and Ravet12, Reference Luo, Demkov, Triyoso, Fejes, Gregory and Zollner13 However, few studies have been focused on the optical properties of HfO2 films with mixed phases. Therefore, to explore the ability to tailor the properties so as to optimize performance requires a detailed understanding of the relationship between the optical properties and mixed phase. This work was, therefore, performed on thermally oxidized HfO2 thin films with mixed phase (monoclinic and cubic) to understand the influence of mixed phase on the optical properties. Our experimental results reveal that the mixed phase has a certain effect on the increase of the optical band gap (Eg) of HfO2 films.
II. EXPERIMENTAL PROCEDURE
A. Sample preparations
HfO2 thin films (~60 nm) were prepared by thermal oxidation of metallic hafnium films in oxygen at different temperatures. First, the metallic hafnium films were fabricated by radio frequency sputtering at room temperature on Si (100) and quartz substrates. All substrates were thoroughly cleaned by the root cause analysis (RCA) technique and dried with high purity nitrogen before placed into the vacuum chamber, which was then pumped down to a base pressure of 10−4 Pa by a turbomolecular pump. A 4-inch hafnium (99.95%) plate was used as the target, and the target-substrate distance was set as 5 cm. A high purity Ar (99.99%) was then introduced into the chamber with a flow rate of 30 sccm and the growth pressure was maintained constantly at ~0.2 Pa. The sputtering power was kept at 100 W for all the films. The deposition was conducted at room temperature for 30 min.
Subsequently, both the metallic hafnium films on Si and quartz substrates were divided into 7 pieces and then annealed in oxygen at atmosphere pressure for 4 h at 400, 450, 500, 550, 600, 700, and 800 °C, respectively.
B. Characterization
The structural properties of the films were studied by x-ray diffraction (XRD; Philips, X’pert Pro MPD, Cu Kα, 0.154056 nm, PANalytical B.V., Almelo, The Netherlands). The UV Raman scattering spectra were performed on a Jobin-Yvon LabRam HR800 spectrometer (HORIBA, Ltd., Kyoto, Japan) with a laser source wavelength of 325 nm under the backscattering geometry. The UV-visible (UV-VIS) spectra were determined using a TU-1901 UV-VIS spectrophotometer (Purkinje General Instrument Co. Ltd., Beijing, China) and the wavelength ranging from 200 to 900 nm. The transmission data were used for calculating the optical Eg by the Tauc relation.
III. RESULTS AND DISCUSSION
A. Structure properties
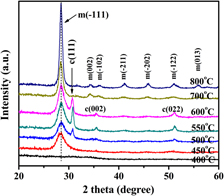
Figure 1 shows the XRD patterns of the HfO2 thin films prepared at different oxidation temperatures. It could be seen that the HfO2 film annealed at 400 °C was amorphous. The films began to crystallize with a monoclinic structure at the oxidation temperature of 450 °C, and the samples showed a preferential (−111) growth orientation. With the increase of the oxidation temperature, the diffraction peaks of the monoclinic structure became more and more intense and sharp. This result suggested that the grain size became larger and the crystal quality was improved with the increase of the oxidation temperature. It was interesting to find that the films thermally oxidized at 500, 550, and 600 °C consisted of predominant monoclinic phases with a trace of cubic ones. The cubic phase started to form at 500 °C, and its intensity reached the maximum value at 550 °C. However, the cubic phase depressed obviously with the further increase of the oxidation temperature, and it disappeared at 700 °C. Furthermore, it could be observed from Fig. 1 that the (111) peak of cubic phase slightly shifted to the lower angle with the increase of oxidation temperature, whereas the peak positions of the monoclinic phase showed no significant changes with the increase of the oxidation temperature.
XRD patterns of HfO2 films prepared at different oxidation temperatures.

Frequently, the average grain sizes in the films can be estimated by the Scherrer formula using the full width at half-maximum (FWHM) value of the XRD peaks. The Scherrer formula can be expressed as follows:
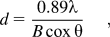
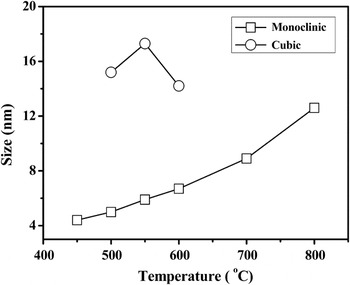
where d, λ, θ, and B are the mean grain size, the wavelength of x-ray, Bragg diffraction angle, and the FWHM of the (−111) diffraction peak at 28.3°, respectively. The results are shown in Fig. 2. It could be easily observed that the average grain size of the monoclinic phase monotonically increased with the oxidation temperature increasing. The crystallite sizes of cubic phase (d cub) within the samples annealed at 500, 550, and 600 °C could be calculated as 15.2, 17.3, and 14.2 nm, respectively, which were much larger than that of the monoclinic phase (d mon), which were 5.0, 5.9, and 6.7 nm for the same samples.
Grain sizes measured for HfO2 films prepared at different oxidation temperatures.

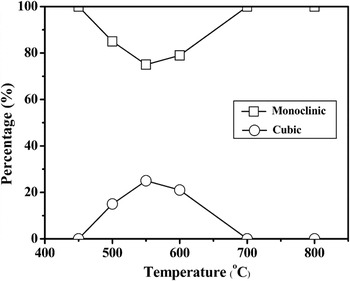
For a rough approximation, we have estimated the percentage of each crystalline phase (monoclinic and cubic) using the areas of all the peaks from each phase in the XRD patterns. The percentage of one phase is calculated with the ratio of the peak areas from the corresponding phase over the sum of the peak areas from both phases. Figure 3 shows relative contents of different phases as a function of the oxidation temperature. The transition from a monoclinic phase to a cubic phase started at 500 °C. The amount of cubic phase continuously increased up to a maximum of 25% at 550 °C, and then decreased to about 20% as the annealing temperature increased to 600 °C. This transition was usually unexpected for the samples prepared at low temperature because this cubic phase is a high-temperature (2700 °C) phase for HfO2. Furthermore, Modreanu et al.Reference Modreanu, Sancho-Parramon, Durand, Servet, Stchakovsky, Eypert, Naudin, Knowles, Bridou and Ravet12 have also observed the coexistence of monoclinic and cubic phases at low temperatures in the HfO2 films prepared by plasma ion-assisted deposition. Both results might suggest that the oxidation temperature plays an important role for the crystallization.
Relative contents of crystalline phases of HfO2 films as a function of the oxidation temperature.

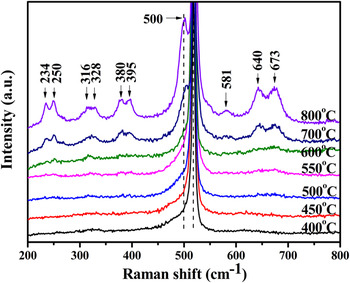
Further investigations on the structure of the samples were conducted by UV Raman spectra. The Vanderbilt group predicted that the monoclinic structure of HfO2 possesses 36 phonon modes.Reference Zhao and Vanderbilt14 Among them, 18 modes (9Ag + 9Bg) belong to Raman-active modes, another 15 modes (8Au + 7Bu) belong to IR-active modes, and the other three modes belong to the zero-frequency translation ones. Only one IR-active mode (F1u) and one Raman-active mode (F2g) are predicted for the cubic structure of HfO2. Figure 4 shows the Raman spectra of the HfO2 films prepared on silicon substrates at different temperatures (400–800 °C). For all samples, the strongest peak centered at 500 cm−1, and other peaks at around 234, 250, 316, 328, 380, 395, 581, 640, and 673 cm−1 (the peak of ~520 cm−1 was the signal of Si substrate), could be assigned to the Ag and Bg modes of monoclinic HfO2, respectively.Reference Jayaraman, Wang, Sharma and Ming15 The Raman peaks became more and more remarkable and the FWHM of the strongest peak became narrower with the temperature increasing. These results were in agreement with the XRD analysis, indicating that the crystalline quality of the samples was improved with increasing the oxidation temperature. Raman measurements have not detected the presence of the Raman-active mode (F2g) assigned to the cubic phase in the annealed HfO2 films because this is a weak Raman mode.
Raman spectra of the HfO2 films deposited on silicon substrates using a 325-nm laser for 300 s, the silicon peak is located at ~520 cm−1.

B. Optical properties
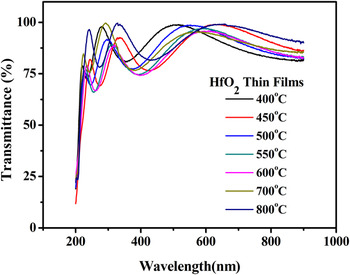
To investigate the optical properties of HfO2 films, the UV-VIS transmittance spectra of the samples deposited on the quartz substrates were measured, as shown in Fig. 5. It could be clearly seen that the HfO2 films showed a high transparency in the spectral region except where the incident radiation was absorbed across Eg.
Optical transmittance spectra of HfO2 films deposited on quartz substrates.

The optical absorption coefficient (α) of the films can be evaluated using the following relationReference Tyagi and Vedeshwar16:

where T is the transmittance, R is the reflectance, and t is the thickness of the film. In the Eg region (high absorption) or above the fundamental absorption edge, the absorption follows a power law in the following formReference Aarik, Mandar, Kirm and Pung17:

where hv is the energy of the incident photon, B is the parameter of the absorption edge width, Eg is the band gap. The exponent n can be determined by the type of the electronic transitions causing the optical absorption. Generally, n can take values ½ and 2 for direct-allowed and indirect-allowed transitions, respectively. The band gap of thin films can be estimated by extrapolating the linear parts of the curves plotted from Formula (3) to α(hv) = 0.
Figures 6(a) and 6(b) show the absorption data and the plots obtained for HfO2 films. The function of (αhv)2 versus hv showing linear plots suggested the direct allowed transitions across Eg of HfO2 films, which was consistent with the previous results.Reference Khoshman, Khan and Kordesch11, Reference He, Zhu, Liu, Fang and Zhang18 It could be seen that the HfO2 films thermally oxidized at 700 and 800 °C had an additional shoulderlike absorption peak just below the band gap energy. The shoulderlike absorption peak began to occur at an oxidation temperature of 700 °C, and became stronger and sharper at the oxidation temperature of 800 °C. This absorption peak indicated the existence of additional energy states at about 0.3 eV as a result of trap levels [see Fig. 6 (b)], which are due to the existence of the hafnium silicate interface at high-temperature oxidation (700 and 800 °C). Our results agree with the work of others.Reference Cosnier, Olivier, Theret and Andre19, Reference Nguyen, Davydov, Chandler-Horowitz and Frank20
Band gap determination of HfO2 films prepared at different oxidation temperatures on quartz substrates from transmittance: (a) 400, 450, 500, 550, and 600 °C; (b) 700 and 800 °C. A plot of (αhv)2 versus hv.

Figure 7 shows the optical Eg values determined by extrapolating the linear region of the plot to α(hv) = 0. It could be seen that Eg first increased with the increase of the annealing temperature and reached the maximum value at 550 °C, and then decreased with further increasing the oxidation temperature. Several research groups have found that Eg of monoclinic HfO2 films decreased with increasing grain size (d), which was attributed to quantum size effect.Reference Kosacki, Petrovsky and Anderson21, Reference Ramana, Vemuri, Fernandez and Campbell22 Although Park et al.Reference Park, Lee, Lim, Lee and Choi23 found that Eg of monoclinic HfO2 films was monotonically increased with increasing the annealing temperature. However, these findings are not the same result as our case. The Eg of the amorphous films thermally oxidized at 400 °C was about 5.73 eV and it increased to 5.93 eV as the oxidation temperature increased to 450 °C. This increase might be due to the crystallization of HfO2, i.e., transition from an amorphous phase to the monoclinic one.Reference Khoshman, Khan and Kordesch11 The films thermally oxidized at 500, 550, and 600 °C showed high values of Eg, while the values of Eg decreased with an even higher oxidation temperature. From the aforementioned analysis, the films thermally oxidized at 500, 550, and 600 °C possessed a mixture of cubic and monoclinic phases, and the films thermally oxidized at 700 and 800 °C possessed a pure monoclinic phase. Previous worksReference Jaffe, Bachorz and Gutowski24–Reference Demkov26 predicted the value of Eg for cubic HfO2 is smaller than the one of monoclinic HfO2. However, our results showed that the Eg values of the HfO2 films with a mixture of cubic and monoclinic phase were not only larger than the Eg of amorphous or cubic HfO2 films but also larger than that of the monoclinic HfO2 films. This result suggests that the mixture phases have an obvious effect on the increase of the values of Eg of HfO2 films. Further work is needed to understand the influence of the mixed phase on the optical properties of HfO2.
Optical band gap of HfO2 thin films as a function of the oxidation temperatures.

IV. CONCLUSION
In summary, HfO2 thin films were prepared by thermal oxidation of metallic hafnium films. To study the influence of mixed phases on the optical properties, the samples were characterized by XRD, UV Raman and UV-VIS techniques. The thermal oxidation of metallic hafnium films gives rise to two competitive crystalline phases (monoclinic and cubic). All HfO2 films showed a high transparency in the spectral region, except the points where the incident radiation is absorbed across Eg. The Eg values for the HfO2 films with a mixture of cubic and monoclinic phase were higher than the ones of amorphous or monoclinic HfO2 films, suggesting that the mixed phase has a certain effect on the Eg of HfO2 films.
ACKNOWLEDGMENTS
This work is supported by NSAF Joint Funds of the National Natural Science Foundation of China (Grant No. 10776010) and partly by State Key Laboratory of Surface Engineering Technology, China (Grant No. 9140C5401010801), and Open Project of Key Laboratory for Magnetism and Magnetic Materials of the Ministry of Education, Lanzhou University, China, (Grant No. LZUMMM2010023).