





Experiencing childhood adversities is common (Bellis et al., Reference Bellis, Wood, Hughes, Quigg and Butler2023). Childhood adversities are defined as negative environmental experiences that are likely to require significant adaptation by an average child and represent a deviation from the expected environment (Lacey & Minnis, Reference Lacey and Minnis2020; McLaughlin, Reference McLaughlin2016), such as growing up in poverty, facing loss or illness in the family, or having parents struggling with substance abuse. In some families, children endure a multitude of adversities across childhood (Jones & Hoffmann, Reference Jones and Hoffmann2023; Raghunathan et al., Reference Raghunathan, Johnson, Voegtline, Sosnowski, Kuehn, Ialongo and Musci2024), which often co-occur with physical and mental health problems (Raghunathan et al., Reference Raghunathan, Johnson, Voegtline, Sosnowski, Kuehn, Ialongo and Musci2024; Rod et al., Reference Rod, Bengtsson, Elsenburg, Taylor-Robinson and Rieckmann2021). Children growing up in families navigating significant adversity often face substantial marginalization later in life (Kreshpaj et al., Reference Kreshpaj, Elsenburg, Andersen, de Vries, Thielen and Rod2025), underscoring the urgent need to prioritize these children and their families for intervention to prevent both short-and long-term harm. While our understanding of the patterns of childhood adversity and physical and mental health across these families has steadily increased, we still know relatively little about the dynamics underlying these patterns (Rod et al., Reference Rod, Broadbent, Rod, Russo, Arah and Stronks2023). Understanding these dynamics is, however, crucial to establish leverage points for intervention aimed at disrupting vicious circles of accumulating childhood adversity and poor health.
Vicious circles of childhood adversity and poor health throughout childhood may be best understood as arising from reinforcing feedback loops between childhood adversities and poor health over time. Drawing on life course theory (Kuh et al., Reference Kuh, Ben-Shlomo, Lynch, Hallqvist and Power2003), childhood adversities in the first years of life, a sensitive period where infants are highly dependent on parents due to limited capacity for self-regulation and internal coping, may set some children on a trajectory of poor health early in childhood (Wallander et al., Reference Wallander, Berry, Carr, Peterson, Waldie, Marks, D’Souza and Morton2021). Following initial health problems, poor health may then start to accumulate due to reciprocal associations between poor physical and mental health and worsening of poor health over time (Aarons et al., Reference Aarons, Monn Ar Fau - Leslie, Leslie Lk Fau - Garland, Garland Af Fau - Lugo, Lugo L Fau - Hough, Hough Rl Fau - Brown and Brown2008; Oldehinkel & Ormel, Reference Oldehinkel and Ormel2023; Wiese et al., Reference Wiese, Chen, Tay, Friedman and Rector2019) through a variety of cognitive, social, and neurobiological pathways. These reinforcing feedback loops and autocorrelation effects likely become stronger as the child grows older, and internal processes become more important for navigating adversity and maintaining good health (Masten & Tellegen, Reference Masten and Tellegen2012).
Childhood adversities may not only affect the physical and mental health of the developing child but may also become manifest because of the child’s deteriorated health state (Bronfenbrenner, Reference Bronfenbrenner1979). For example, parents may experience increased levels of mental health problems because of difficulties coping with their child’s poor physical or mental health (Hu et al., Reference Hu, Grosse, Han, Marchak and Ji2024). The family may also struggle with financial problems either due to the inability of the mentally ill parent to retain employment or because they must take care of the child at home (Knifton & Inglis, Reference Knifton and Inglis2020). These examples illustrate the highly dynamic nature of the associations between childhood adversity and health, characterized by feedback loops and autocorrelation effects. Empirical evidence of these dynamics, however, remains notably scarce (Raghunathan et al., Reference Raghunathan, Johnson, Voegtline, Sosnowski, Kuehn, Ialongo and Musci2024).
Network analytical approaches have the potential to provide insight into the potential dynamics underlying childhood adversities and health across childhood (de Vries et al., Reference de Vries, Arends, Hulvej Rod, Oldehinkel and Bültmann2022; Lacey, Reference Lacey2023). Despite this potential, network analytical models have been applied mainly to small, largely cross-sectional, datasets (Breuer et al., Reference Breuer, Greggersen, Kahl, Schweiger and Westermair2020; Carozza, Holmes, & Astle, Reference Carozza, Holmes and Astle2022; de Vries et al., Reference de Vries, Arends, Oldehinkel and Bültmann2024; Pollmann, Fritz, Barker, & Fuhrmann, Reference Pollmann, Fritz, Barker and Fuhrmann2023). Many, if not all, of these studies also only included relatively few children from families experiencing high rates of adversity, resulting in study samples with relatively low rates of childhood adversity and health problems and, thus, potentially underpowered studies.
In this study, we leverage cross-lagged network models (Wysocki, McCarthy, van Bork, & Cramer, Reference Wysocki, McCarthy, van Bork and Cramer2025) to explore the dynamics of childhood adversities and health outcomes in a large sample of 11,978 children who experienced a high degree of childhood adversity and physical and mental health problems across childhood (Rod et al., Reference Rod, Bengtsson, Budtz-Jørgensen, Clipet-Jensen, Taylor-Robinson, Andersen, Dich and Rieckmann2020, Reference Rod, Bengtsson, Elsenburg, Taylor-Robinson and Rieckmann2021). We utilize unique longitudinal life-course data from the Danish Life Course (DANLIFE) cohort, including annual data on childhood adversity and physical and mental health spanning the first 16 years of childhood.
Methods
The Danish Life Course (DANLIFE) cohort includes all children born in Denmark between January 1, 1980, and December 31, 2015, totaling 2,223,972 individuals (Bengtsson, Dich, Rieckmann, & Hulvej Rod, Reference Bengtsson, Dich, Rieckmann and Hulvej Rod2019). For the present study, we restricted the cohort to 436,335 children born between January 1, 1995, and December 31, 2001, who did not die or emigrate before age 16 years to ensure full follow-up, and to allow for the usage of outpatient hospitalization data, which is only available from 1995 onwards (Mors, Perto, & Mortensen, Reference Mors, Perto and Mortensen2011). Within this subsample, we selected 11,978 children who were previously assigned to a high-adversity trajectory group (Rod et al., Reference Rod, Bengtsson, Budtz-Jørgensen, Clipet-Jensen, Taylor-Robinson, Andersen, Dich and Rieckmann2020) through group-based model building in order to zoom in on the vicious circles of adversity and health in this subpopulation (see Supplementary Figure S1 for a flowchart). Individuals who died before age 16 were more likely to be born preterm or small for gestational age, while individuals who migrated before age 16 were more likely to have parents with a non-Western background (Rod et al., Reference Rod, Bennetsen, Elsenburg, Sabel, Taylor-Robinson, Kovacs, Zucco and de Vries2025). More information about the cohort has been described in detail elsewhere (Bengtsson, Dich, Rieckmann, & Hulvej Rod, Reference Bengtsson, Dich, Rieckmann and Hulvej Rod2019). More information about the included adversities and group-based model building can be found in Supplementary Information S1. Statistics Denmark and the Danish Health Data Authorities granted access to pseudonymized data from the Danish administrative and health registers. DANLIFE has been approved by the Danish Data Protection Agency through the records of research projects that involve personal data at the Faculty of Health and Medical Sciences, University of Copenhagen (Copenhagen, Denmark) (record no. 514-0641/21-3000). In accordance with Danish law, registry linkage studies do not require informed consent or ethical approval by the Danish National Committee on Health Research Ethics.
Measures
Childhood adversity
We included annual measures of 12 different childhood adversities (Supplementary Information S1), divided into three dimensions (Bengtsson, Dich, Rieckmann, & Hulvej Rod, Reference Bengtsson, Dich, Rieckmann and Hulvej Rod2019): material deprivation (family poverty and parental long-term unemployment), loss or threat of loss (parental somatic illness, sibling somatic illness, parental death, and sibling death), and family dynamics (foster care placement, parental psychiatric illness, sibling psychiatric illness, parental alcohol abuse, parental drug abuse, and maternal separation). These childhood adversities and their predefined dimensions of childhood adversity were derived by experts in stress, child health, and child psychology following a thorough investigation of the literature (Bengtsson, Dich, Rieckmann, & Hulvej Rod, Reference Bengtsson, Dich, Rieckmann and Hulvej Rod2019; McLaughlin, Reference McLaughlin2016; Rod et al., Reference Rod, Bengtsson, Budtz-Jørgensen, Clipet-Jensen, Taylor-Robinson, Andersen, Dich and Rieckmann2020). The high-adversity group selected for this study was characterized by high and increasing adversities across all three dimensions and has previously been shown to carry a markedly higher risk of premature mortality, health problems, and social marginalization in young adulthood compared to their peers (Rod et al., Reference Rod, Bengtsson, Budtz-Jørgensen, Clipet-Jensen, Taylor-Robinson, Andersen, Dich and Rieckmann2020, Reference Rod, Bengtsson, Elsenburg, Taylor-Robinson and Rieckmann2021; Kreshpaj et al., Reference Kreshpaj, Elsenburg, Andersen, de Vries, Thielen and Rod2025).
Mental health hospitalizations
We considered inpatient, emergency, and outpatient diagnoses in public and private hospitals as recorded in the Danish Psychiatric Central Research Register (Mors, Perto, & Mortensen, Reference Mors, Perto and Mortensen2011). We included all diagnostic categories in the fifth chapter (Mental and behavioral disorders) of the International Statistical Classification of Diseases and Related Health Problems, Tenth Revision (ICD-10), except for neurodegenerative and organic disorders (F00-F09) (see Supplementary Information S2 and Supplementary Table S1 for more information and an overview of hospital contacts by diagnostic code, respectively).
Physical health hospitalizations
We included inpatient and emergency diagnoses from public and private hospitals as recorded in the Danish National Patient Registry (Schmidt et al., Reference Schmidt, Schmidt, Sandegaard, Ehrenstein, Pedersen and Sørensen2015). Diagnoses included all chapters of the ICD-10 except for chapters 5, 15, 17, 20, and 21 (see Supplementary Information S2 and Supplementary Table S2 for more information and an overview of hospital contacts by diagnostic code, respectively).
Demographic information
Demographic information obtained include sex at birth (male/female), birth year, parental country of origin (Western/non-Western), parental educational background (≤ 9, 10–12, and > 12 years), and maternal age at time of birth (<20/20–30/>30 years). Parental country of origin was defined as Western if one or both parents were of European, North American, Australian, or New Zealand descent and non-Western if both parents were from elsewhere.
Statistical analysis
We first derived measures of childhood adversity and mental and physical health across four developmentally relevant periods, considering the Danish context (e.g. school entry): infancy (0 < 2 years of age), early childhood (2 < 7 years of age), middle childhood (7 < 12 years of age), and adolescence (12 < 16 years of age). Within each developmental period, we counted the frequency of different types of childhood adversity, as well as hospital contacts for physical and mental health problems. Because the four developmental periods are not the same length in years, we calculated for each variable a rate by dividing the calculated counts by the number of years within each respective developmental period to obtain time-standardized measures. Rates were derived on the entire population born between January 1, 1995, and December 31, 2001 (N = 436,335). These rates were used across all analyses. There was no missing data, except N = 43 missing on parental education for sensitivity analysis only, in the final analytical sample. All analyses were performed using R (version 4.3.1) embedded in the RStudio environment (version 2023.03.2) (Posit team, 2025; R Core Team, 2021). All analytical code is available online at https://osf.io/2yps6.
Cross-sectional networks
To facilitate the interpretation of the cross-lagged network models, we first estimated cross-sectional networks for each developmental period. We applied the model search algorithm (ggmModSelect) with a step-up estimation approach as implemented in qgraph (version 1.9.5) to estimate four cross-sectional networks, one for each developmental period (Epskamp et al., Reference Epskamp, Cramer, Waldorp, Schmittmann and Borsboom2011). Models were estimated using Spearman correlations. Through the graphical least absolute shrinkage and selection operator (gLASSO), 100 networks were estimated ranging from very sparse to very dense for each developmental period. A best-fitting model for each developmental period was selected by minimizing the Bayesian Information Criterion (BIC). For each of these four models, individual edges were progressively included or excluded from this most optimal model in the previous step to further improve model fit as indicated by lower BIC values.
Cross-lagged models
We computed a series of cross-lagged panel network models to estimate temporal associations between childhood adversity and mental and physical health using the two-step modeling approach (Wysocki, McCarthy, van Bork, & Cramer, Reference Wysocki, McCarthy, van Bork and Cramer2025). First, we obtained initial network estimates by using lasso regression in combination with a 10-fold cross-validation approach. Estimates are obtained for a sequence of 100 lambda values, and the value that produces the lowest cross-validation error is chosen as the final model. We obtained three models, for the transitions between infancy to early childhood, early childhood to middle childhood, and from middle childhood to adolescence, respectively. Second, we re-estimated the model parameters from the best-fitting models in step one within a structural equation modeling (SEM) framework to obtain nonregularized estimates for cross-lagged and autoregressive effects across the developmental periods. To achieve this, we re-estimated the three initial lasso-regularized networks while fixing the edges that were removed in the regularized network to zero. We estimated the models using maximum likelihood estimation with robust (Huber–White) standard errors due to deviations from normality in our adversity and health variables. Across these models, we allowed for residual covariances between variables within the same time point to capture shared variance attributable to within-time-point effects (e.g. direct causal effects and unmeasured common causes that arise between measurement intervals). We inspected model fit through examination of the robust root mean square error of approximation (RMSEA), robust comparative fit index (CFI), the robust Tucker–Lewis Index (TLI), and standardized root mean square residual (SRMR) using commonly used cutoffs to assess fit (RMSEA <0.05, CFI >0.90, TLI > 0.90, SRMR <0.08). Reported estimates are bootstrapped standardized beta coefficients and confidence intervals (see below). Analyses were conducted utilizing both the glmnet (version 4.1-8) and lavaan packages (version 0.6-16).
Network visualization and descriptive statistics
All networks were visualized with the same layout to facilitate interpretability using the qgraph package (Epskamp et al., Reference Epskamp, Cramer, Waldorp, Schmittmann and Borsboom2011). All networks include nodes, which represent the variables included in the model, and edges, which represent the conditional associations between the nodes. Edges in the cross-lagged networks represent directed conditional predictive associations, controlling all other variables at the previous measurement occasion. For the cross-lagged networks, only significant edges (p < .05) are retained.
Network stability and sensitivity
We assessed the uncertainty of the edge weights of the cross-sectional and cross-lagged network models by computing 95% confidence intervals through nonparametric bootstrapping (1000 samples) using the Bootnet package (version 1.5) and lavaan, respectively. We also re-estimated our cross-lagged network models stratifying by parental educational strata and sex (N = 11,935).
Results
Of the 11,978 children that experience a high burden of adversity, approximately half were girls (46.3%), and 96.1% of individuals had parents of Western origin. Most individuals had parents with a low educational background (50.0%), and compared with the full DANLIFE, a relatively high proportion also had teenage mothers (8.4%). Table 1 provides an overview of the sample characteristics.
Descriptive statistics

Table 1. Long description
The table contains three columns: Variable, Study sample (N = 11,978), and Full DANLIFE population between 1995 and 2002 (N = 436,335).
* Sex assigned at birth: Girls represent 46.3 percent (5,548) of the study sample versus 48.6 percent (212,227) of the full population. Boys represent 53.7 percent (6,430) of the study sample versus 51.4 percent (224,108) of the full population.
* Origin of parents: Non-Western origins account for 3.9 percent in the study sample and 4.6 percent in the full population. Western origins account for 96.1 percent in the study sample and 95.4 percent in the full population.
* Parental educational background: Low (9 years or less) is 50.0 percent in the study sample versus 11.6 percent in the full population. Medium (10 to 12 years) is 38.6 percent in the study sample versus 48.9 percent in the full population. High (more than 12 years) is 11.1 percent in the study sample versus 39.3 percent in the full population.
* Maternal age at birth: Less than 20 years is 8.4 percent in the study sample versus 1.7 percent in the full population. 20 to 30 years is 62.8 percent in the study sample versus 59.6 percent in the full population. More than 30 years is 28.8 percent in the study sample versus 38.7 percent in the full population.
* Birth year: 1995 to 1998 accounts for 61.2 percent of the study sample and 57.7 percent of the full population. 1999 to 2002 accounts for 38.8 percent of the study sample and 42.3 percent of the full population.
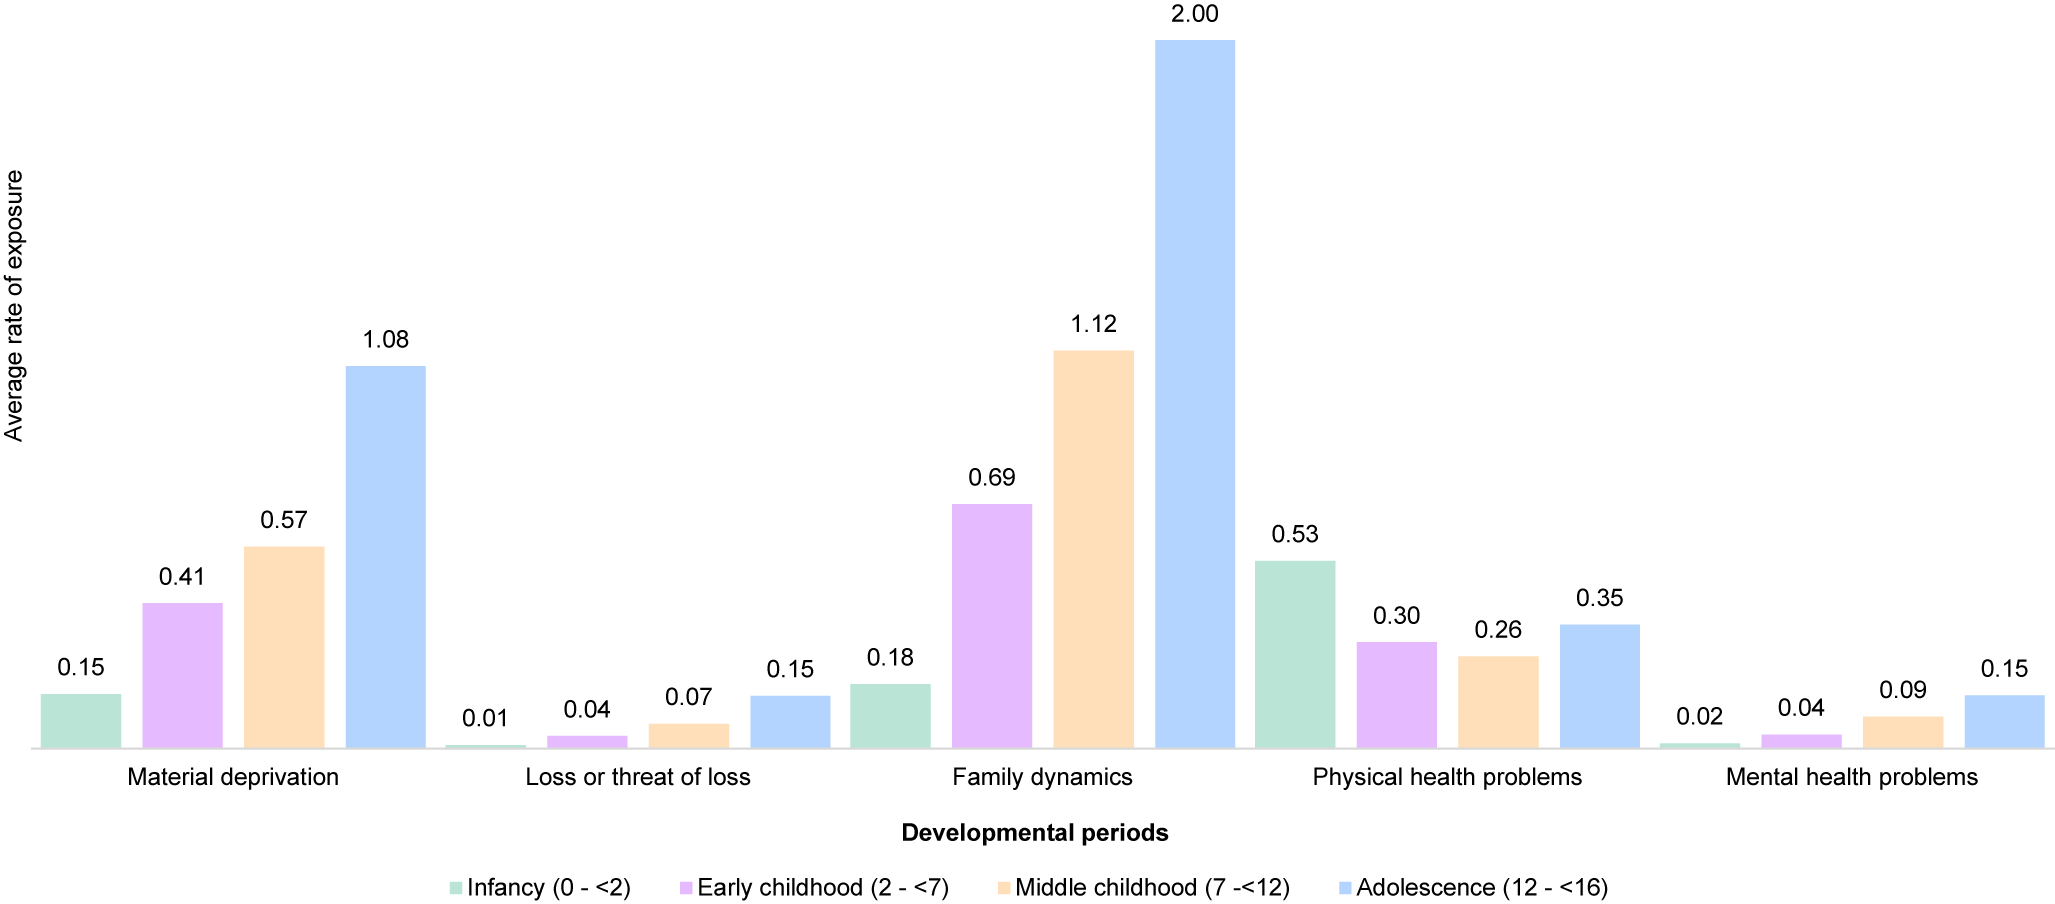
Figure 1 illustrates exposure to all three dimensions of adversity, and physical and mental health problems, within this sample of children across the four developmental periods. The rates of exposure to adversity in the family dynamics domain continuously increased from infancy (mean = 0.18, SD = 0.25) to adolescence (mean = 2.00, SD = 1.18).
Average rates of exposure to childhood adversity, mental health problems, and physical health problems across the four developmental periods. Note: Standard deviations were omitted from this figure to improve visual clarity but are presented in this footnote instead (from infancy to adolescence). Material deprivation: 0.19, 0.41, 0.53, 0.92; Loss or threat of loss: 0.05, 0.11, 0.18, 0.36; Family dynamics: 0.25, 0.59, 0.71, 1.18; Physical health problems: 0.88, 0.46, 0.41, 0.58; Mental health problems: 0.13, 0.16, 0.24, 0.33.

Figure 1. Long description
The Y axis is labeled Average rate of exposure and the X axis is labeled Developmental periods. A legend at the bottom identifies four stages: Infancy (0 to less than 2) in green, Early childhood (2 to less than 7) in purple, Middle childhood (7 to less than 12) in orange, and Adolescence (12 to less than 16) in blue.
Data is presented in five clusters from left to right:
* Material deprivation: Shows a steady increase across the four periods with values of 0.15, 0.41, 0.57, and 1.08.
* Loss or threat of loss: Shows a gradual increase with values of 0.01, 0.04, 0.07, and 0.15.
* Family dynamics: Shows the most significant increase, starting at 0.18 in infancy and peaking at 2.00 in adolescence, with intermediate values of 0.69 and 1.12.
* Physical health problems: Shows a downward trend from infancy at 0.53 to early childhood at 0.30 and middle childhood at 0.26, before a slight rise to 0.35 in adolescence.
* Mental health problems: Shows a consistent upward trend with values of 0.02, 0.04, 0.09, and 0.15.
Exposure to material deprivation similarly continuously increased from infancy (mean = 0.15, SD = 0.19) to adolescence (mean = 1.08, SD = 0.92). Exposure to loss or threat of loss is relatively low across developmental periods and highest during adolescence (mean = 0.15, SD = 0.36). Similar patterns were observed for mental health problems, which also exhibit their peak in adolescence (mean = 0.15, SD = 0.33).
Rates of physical health problems remain largely stable over time, following a peak in infancy (mean = 0.53, SD = 0.88).
Cross-sectional networks
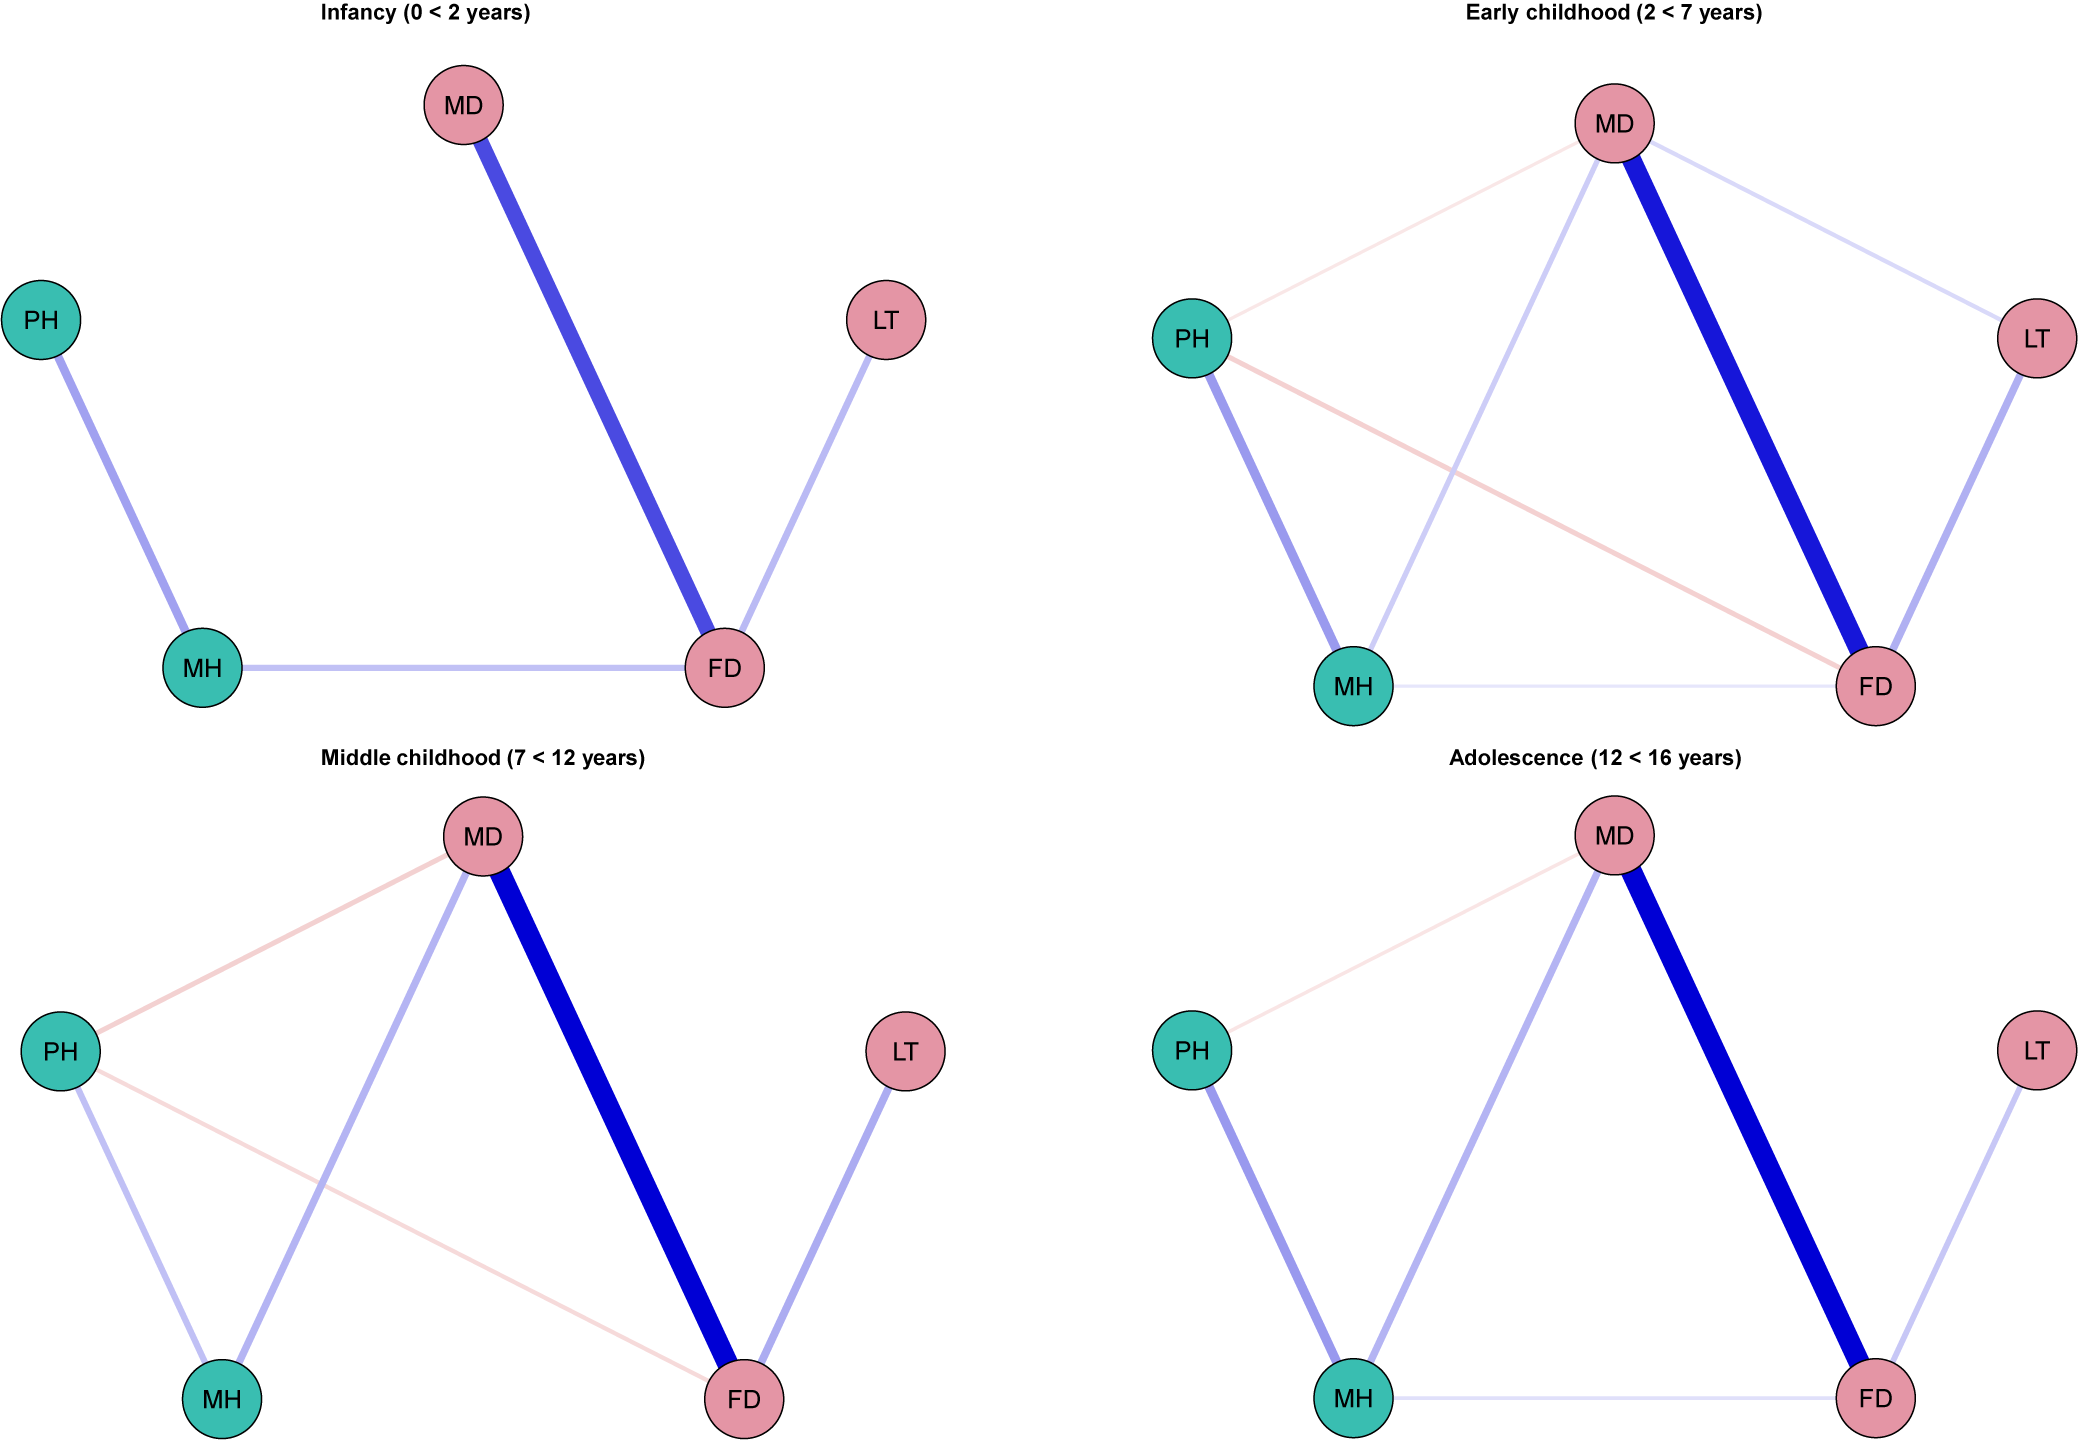
Figure 2 highlights the co-occurrence of childhood adversity and physical and mental problems by illustrating how these variables are conditionally associated within the four developmental periods. Childhood adversity and health were found to be highly interconnected within developmental periods. For example, mental health and family dynamics were positively associated across all developmental periods with the exception of middle childhood, while material deprivation and family dynamics, and physical and mental health problems were associated across childhood. The cross-sectional networks were highly stable (results not shown).
Cross-sectional networks of childhood adversity and physical and mental health problems across the four developmental periods. Note: FD, Family dynamics; LT , Loss or threat of loss; MD, Material deprivation; MH, Mental health problems; PH, Physical health problems. Edge thickness represents the strength of the associations between variables, whereas thicker edges represent stronger associations (depicted by stronger color saturation). Blue edges indicate positive associations, whereas red edges indicate negative associations.

Figure 2. Long description
Four network diagrams represent developmental periods: Infancy (0 to less than 2 years), Early childhood (2 to less than 7 years), Middle childhood (7 to less than 12 years), and Adolescence (12 to less than 16 years). Each network contains five nodes: M D (Material deprivation), L T (Loss or threat of loss), and F D (Family dynamics) in pink; P H (Physical health problems) and M H (Mental health problems) in teal.
* Infancy: A very thick blue edge connects M D and F D. Thinner blue edges connect F D to L T, F D to M H, and M H to P H.
* Early childhood: The network becomes more dense. The thickest blue edge remains between M D and F D. New blue edges connect M D to L T, M D to M H, and M D to P H. A thin red edge appears between P H and F D.
* Middle childhood: Similar structure to Early childhood. The blue edge between M D and F D remains the strongest. Red edges are visible between P H and M D, and P H and F D.
* Adolescence: The network maintains a similar density to Middle childhood. The strongest association is the blue edge between M D and F D. Blue edges connect M H to P H, M H to M D, and M H to F D. Faint red edges connect P H to M D and P H to F D.
Cross-lagged networks
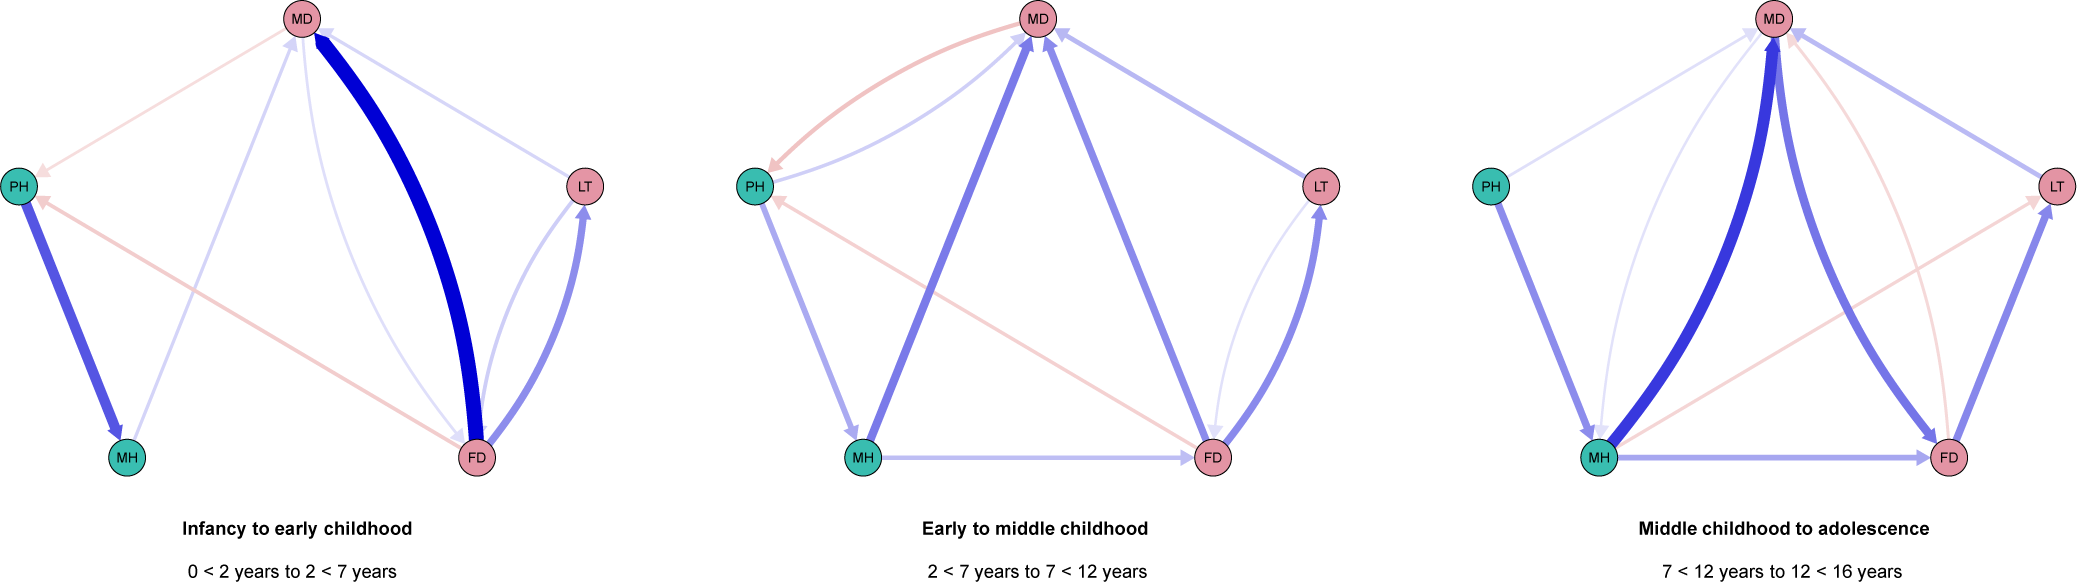
Figure 3 shows how domains of childhood adversity and physical and mental health problems (co-) evolve across developmental periods, illustrated by the various feedback loops, cross-lagged effects, and strong autocorrelation effects (Table 2).
Cross-lagged network models. Note: FD, Family dynamics; LT, Loss or threat of loss; MD, Material deprivation; MH, Mental health problems; PH, Physical health problems. Edge thickness represents the strength of the associations between variables, whereas thicker edges represent stronger associations (depicted by stronger color saturation). Blue edges indicate positive associations, whereas red edges indicate negative associations. The network model fit the data well (Robust TLI = .976, Robust CFI = .988, Robust RMSEA = .023 (90% CI: 0.020–0.024), SRMR = .015). Autoregressive effects are excluded for visual clarity.

Figure 3. Long description
The figure consists of three panels labeled Infancy to early childhood (0 to less than 2 years to 2 to less than 7 years), Early to middle childhood (2 to less than 7 years to 7 to less than 12 years), and Middle childhood to adolescence (7 to less than 12 years to 12 to less than 16 years). Each panel features five circular nodes: M D at the top, L T at the right, F D at the bottom-right, M H at the bottom-left, and P H at the left.
* In the first panel (Infancy to early childhood), the most prominent feature is a very thick, dark blue curved arrow pointing from F D to M D. A medium-thickness blue arrow points from P H to M H. Other edges are thin and faint.
* In the second panel (Early to middle childhood), the network is more interconnected. Thick blue arrows point from M D to F D and from M D to M H. A medium blue arrow points from P H to M H. Faint red edges are visible between M D and P H.
* In the third panel (Middle childhood to adolescence), the strongest association is a thick blue arrow pointing from M H to M D. Medium-thickness blue arrows point from M D to F D and from P H to M H.
Across all panels, blue arrows indicate positive associations and red arrows indicate negative associations, with line thickness representing the strength of the cross-lagged effect.
Bootstrapped standardized beta coefficients and 95% confidence intervals across 1000 bootstrapped samples

Table 2. Long description
The tables display bootstrapped standardized beta coefficients and 95 percent bootstrapped confidence intervals across five domains: Material deprivation, Loss or threat of loss, Family dynamics, Physical health problems, and Mental health problems.
Table 1: Infancy to early childhood.
* Material deprivation to itself: 0.33 (0.31 to 0.35).
* Loss or threat of loss to itself: 0.19 (0.15 to 0.23).
* Family dynamics to itself: 0.52 (0.50 to 0.54).
* Physical health problems to itself: 0.43 (0.38 to 0.49).
* Mental health problems to itself: 0.35 (0.30 to 0.40).
* Notable cross-domain: Family dynamics to Material deprivation is 0.16 (0.14 to 0.18).
Table 2: Early to middle childhood.
* Material deprivation to itself: 0.43 (0.41 to 0.44).
* Loss or threat of loss to itself: 0.31 (0.28 to 0.35).
* Family dynamics to itself: 0.46 (0.44 to 0.48).
* Physical health problems to itself: 0.38 (0.33 to 0.44).
* Mental health problems to itself: 0.45 (0.42 to 0.48).
* Notable cross-domain: Mental health problems to Material deprivation is 0.08 (0.07 to 0.10).
Table 3: Middle childhood to adolescence.
* Material deprivation to itself: 0.55 (0.53 to 0.56).
* Loss or threat of loss to itself: 0.30 (0.28 to 0.33).
* Family dynamics to itself: 0.35 (0.33 to 0.38).
* Physical health problems to itself: 0.43 (0.39 to 0.48).
* Mental health problems to itself: 0.53 (0.51 to 0.55).
* Notable cross-domain: Mental health problems to Material deprivation is 0.12 (0.11 to 0.14).
Note: Empty cells reflect edges that were estimated to be zero in the regularized network model and therefore not estimated in subsequent models. Presented coefficients represent standardized beta coefficients that can be interpreted as the effect of one node at time t on another node (or itself) at time t + 1, holding all other nodes at time t constant.
Associations between domains of childhood adversity
The three domains of childhood adversity were interlinked across childhood, as illustrated by several cross-lagged effects and reinforcing feedback loops across domains. For example, we found that material deprivation in infancy was positively associated with family dynamics in early childhood, which was subsequently positively associated with material deprivation in middle childhood, which was again positively associated with family dynamics in adolescence. We also consistently found positive cross-lagged effects from loss or threat of loss to material deprivation and from family dynamics to loss or threat of loss across developmental periods, and a negative cross-lagged effect between family dynamics and material deprivation in adolescence. All domains of childhood adversity exerted strong autoregressive effects, indicating that adversity is highly pervasive throughout childhood and across domains. The included edges between domains of adversity were highly stable.
Associations between physical and mental health
We observed consistent cross-lagged effects from physical health to mental health problems throughout childhood. We also observed strong autoregressive effects for both physical and mental health problems, highlighting the pervasive nature of health problems. The edges from physical health problems to mental health problems were highly stable (Table 2).
Associations between childhood adversity and physical and mental health
We observed several cross-lagged effects between domains of childhood adversity and physical and mental health problems across developmental periods, but relatively few feedback loops. Moreover, while associations between domains of childhood adversity and subsequent physical health problems were all negative, associations between health problems and subsequent adversity were positive in nature. The only exception was a positive cross-lagged effect from material deprivation in middle childhood to mental health problems in adolescence. To further illustrate: we found that mental health problems across childhood were positively associated with subsequent material deprivation. Both family dynamics and material deprivation in infancy were negatively associated with physical health problems in early childhood, while mental health problems in middle childhood were negatively associated with loss or threat of loss in adolescence. These associations were highly stable (Table 2). Across bootstrapped samples, we found several associations between physical health problems and subsequent mental health problems, although bootstrapped 95% confidence intervals included zero and should thus be considered uncertain. Estimates were similarly uncertain for suggested edges between physical health problems and subsequent adversity, except between physical health problems in early/middle childhood and subsequent material deprivation.
Sensitivity analyses
The networks stratified by parental educational background and sex differed slightly from the main analysis (Supplementary Figures S2–S7 and Supplementary Tables S3–S8), particularly among girls with lower parental education. In this group, adversities were more interconnected, cross-lagged effects from physical to mental health were more pronounced, and family dynamics in infancy and material deprivation in early childhood were associated with subsequent mental health, patterns not observed among boys with similarly low parental education. In the network models based on the full DANLIFE population, we observed a highly dense network, with all domains of adversity and health highly interconnected (Supplementary Figure S8 and Table S8).
Discussion
In this large study of children who grew up in families navigating significant adversity, we found that associations between childhood adversity and registered physical and mental health problems are highly complex. Our findings show that childhood adversity and physical and mental health problems co-occur both within developmental periods, while their associations over time appear primarily driven by autoregressive effects and feedback loops between adversities and cross-lagged effects between health problems. This may potentially create vicious circles of adversity on the one hand, and health problems on the other. Surprisingly, childhood adversity was only weakly and negatively associated with physical and health problems over time, and estimates were largely unstable. However, physical and mental health problems were associated with the subsequent experiences of adversity. Together, the findings suggest that emergent patterns of childhood adversity and poor health are highly complex and dynamic.
In line with previous research (Raghunathan et al., Reference Raghunathan, Johnson, Voegtline, Sosnowski, Kuehn, Ialongo and Musci2024), we observed that most children already experience high degrees of concurrent childhood adversity and health problems early in childhood. Across childhood, these problems continue to accumulate due to reinforcing feedback loops between dimensions of adversity and cross-lagged effects between physical and mental health states. For example, we found material deprivation and family dynamics to continually reinforce each other over time. One potential explanation for this finding may be that the family experiences financial difficulties due to the inability of a mentally ill parent to retain employment, which may then further amplify mental health problems and financial difficulties (Hu et al., Reference Hu, Grosse, Han, Marchak and Ji2024; Knifton & Inglis, Reference Knifton and Inglis2020). Similarly, children were found to experience increased mental health problems following physical health problems across childhood, both of which also showed substantial autoregressive effects. These associations are likely to arise due to an increased reliance on internal processes, for example, stress regulation as children grow older (Masten & Tellegen, Reference Masten and Tellegen2012), which may, when maladaptive, provoke self-reinforcing patterns of health problems.
While we found clear evidence of associations between childhood adversity and especially mental health problems within developmental periods, we found little evidence for associations between childhood adversity and subsequent registered health problems in cross-lagged network models. Instead, those were largely negative, and some were also relatively weak and unstable across developmental periods. These findings may seem counterintuitive given the plethora of research showing that childhood adversity is associated with increased health problems across the life course (Raghunathan et al., Reference Raghunathan, Johnson, Voegtline, Sosnowski, Kuehn, Ialongo and Musci2024; Rod et al., Reference Rod, Bengtsson, Elsenburg, Taylor-Robinson and Rieckmann2021), but we have two potential explanations for this finding. Negative associations found in cross-lagged network models may sometimes be counterintuitive (Wysocki, McCarthy, van Bork, & Cramer, Reference Wysocki, McCarthy, van Bork and Cramer2025), because the estimates represent conditional associations. It is possible that poor health is established early in life following exposure to childhood adversity, which then accumulates through self-reinforcing feedback loops and direct effects between mental health and physical health instead of because of ongoing exposure to childhood adversity (Oldehinkel & Ormel, Reference Oldehinkel and Ormel2023; Wiese et al., Reference Wiese, Chen, Tay, Friedman and Rector2019). Previous research has repeatedly highlighted the importance of infancy as a critical period during which health problems may arise following childhood adversity (Kuh et al., Reference Kuh, Ben-Shlomo, Lynch, Hallqvist and Power2003; Wallander et al., Reference Wallander, Berry, Carr, Peterson, Waldie, Marks, D’Souza and Morton2021), giving plausibility to this explanation. This is further supported by Bakker, Ormel, Verhulst, and Oldehinkel (Reference Bakker, Ormel, Verhulst and Oldehinkel2012), who found that continued family instability did not predict mental health problems in adolescence, but that this association was instead largely mediated by earlier-onset mental health problems, a pattern closely resembling what we observed. Our findings suggest the possibility of a thresholding effect of childhood adversity during childhood in children of families where high rates of adversity are persistent, whereby adversity does not lead to continuously increasing poor health, given that some children may experience significant health problems in infancy. This may imply that a linear dose–response association may simply not hold among this group of children experiencing high adversity. That the pattern differs in these high adversity children compared with children in general is supported by the sensitivity analysis of an unselected sample of children regardless of their history of adversity. Here we observed the expected pattern of adversity being associated with higher subsequent health problems across developmental periods. Importantly, it is plausible that these findings are also partially driven by our inability to separate within- and between-person effects. Previous research has shown that reactions and responses to stressors such as childhood adversity are highly heterogeneous between individuals (Lunansky et al., Reference Lunansky, Bonanno, Blanken, van Borkulo, Cramer and Borsboom2025). While some children who experience high rates of adversity may exhibit health problems following exposure to childhood adversity relatively early, others may either exhibit delayed effects or experience no health issues following childhood adversity. Indeed, most children tend to grow up healthy despite their history of adversity. Thus, it is possible that this mixture of responses following childhood adversity also averages out the effects of adversity on health in our group of high-adversity children, thus resulting in null findings. To further disentangle these findings, we recommend that future research zooms in on the potential nonlinear and heterogeneous nature of the effects of childhood adversity on subsequent health across both shorter and longer time lags, as well as individual differences (e.g. sex) in susceptibility to childhood adversity.
Associations between health problems and subsequent childhood adversity were consistently positive and notably stronger than the reverse, especially for mental health problems predicting later material deprivation in the family. A possible explanation is that ongoing child health problems can increase caregiving demands, reduce parental labor market participation, and lower household income. Mental health issues also predicted later adversity in the dimension of family dynamics, possibly because parents struggle to cope over time and potentially develop mental health problems and substance abuse problems, with effects intensifying across development (Nomaguchi & Milkie, Reference Nomaguchi and Milkie2020). However, it is important to note that the family dynamics measure also includes foster care placement, which could also explain the association between child mental health problems and subsequent adversity in the family dynamics dimension. Nevertheless, these findings highlight the potential importance of viewing children within dynamic family systems, where mutual influences unfold over time, aligning with ecological systems theory and dynamic systems approaches (Boele et al., Reference Boele, Nelemans, Denissen, Prinzie, Bülow and Keijsers2023; Bronfenbrenner, Reference Bronfenbrenner1979).
Importantly, Denmark’s strong social security system means that the prevalence of adversity and health problems is relatively low compared to other sociopolitical settings, potentially because adversities are less likely to cascade into further adversity, health, and vice versa. Although we observe meaningful associations between adversity and health in our study, our findings should be interpreted as having occurred in a relatively advantaged population. Our findings may be more pronounced in countries with different social security systems, which warrants further investigation.
Strengths and limitations
Using life-course data with annual measurements across multiple dimensions of childhood adversity and health on a large group of children and their families who face substantial adversity allowed us to obtain insight into temporal dynamics between dimensions of childhood adversity and health problems across four developmental periods. We also acknowledge several limitations. First, our analytical approach cannot differentiate between- and within-person effects, which may have led to the inclusion of cross-lagged effects that are not truly reflective of associations between childhood adversities and health over time but instead stable individual differences (Hamaker, Kuiper, & Grasman, Reference Hamaker, Kuiper and Grasman2015). Some cross-lagged paths included in the network may thus not be reflective of within-person effects, but instead stable between-person differences or a mixture of both. Differentiating between- and within-person variance is important for formulating theoretical frameworks for developmental sciences (Curran & Bauer, Reference Curran and Bauer2011) as well as the development of interventions and should be a priority in future studies. The cross-lagged effects found in this study should therefore be seen as potentially reflective of true within-person effects that require further study in future research. Second, our study relies on register data only, which has several implications. Namely, our measures include the most severe cases of both childhood adversity and physical and mental health problems. However, this also means that the findings are likely to underestimate true population effects between childhood adversity and health problems. Moreover, due to the nature of register-based data, which requires contact with services, the associations observed may also partially be driven by patterns of health care utilization. It is well known that families of lower socioeconomic standing are less likely to receive and seek support for their health-related problems, which has potentially led us to underestimate the burden of adversity and health problems in this group. The register-based nature of our study makes it impossible to detect these latent, ongoing problems, leading to a further underestimation of the true population effects. In addition, we were unable to capture measures of childhood maltreatment, which may partially explain some of the associations found in our study (de Vries et al., Reference de Vries, Arends, Oldehinkel and Bültmann2024; Stith et al., Reference Stith, Liu, Davies, Boykin, Alder, Harris, Som, McPherson and Dees2009). Future studies should ideally complement register data with other sources of data (e.g. parent or observer-rated data) to assess the robustness of our findings.
Implications
The strong co-occurrence between adversity and child health from early infancy and throughout childhood suggests that leverage points for intervention exist across multiple sectors, targeting societal, psychosocial, and health factors, underscoring the need for a whole-of-society approach for supporting children highly exposed to adversity as well as their families (Metzler et al., Reference Metzler, Merrick, Klevens, Ports and Ford2017). For example, (local) governments may use income supplementation and increase access to affordable housing to positively affect both material deprivation and family dynamics (Courtin, Allchin, Ding, & Layte, Reference Courtin, Allchin, Ding and Layte2019). Interventions aimed at parenting skills, for example, through home visiting services, may be used simultaneously to positively affect offspring health (Avellar & Supplee, Reference Avellar and Supplee2013). Efforts should also be made to break the cycle of poor physical and mental health. Such efforts could be initiated within a hospital or clinical setting, and these settings may also be used to identify ongoing problems in the child’s family to potentially break patterns of accumulating adversity (Garg, Byhoff, & Wexler, Reference Garg, Byhoff and Wexler2020). Given the findings in this study, and consistent with previous research, intervening as early as infancy appears critical in some children, as this is where accumulating patterns of adversity and poor health outcomes may already take hold. Given that problems may emerge in multiple domains, we argue for the importance of combined multisectoral intervention programs, including home visiting services and income supplementation, that simultaneously address multiple domains of adversity rather than isolated factors.
Our findings suggest that childhood adversity not only affects offspring health, as shown in a myriad of previous studies, but offspring health may also affect the presence of adversity within the family. While children may exhibit resilience following exposure to childhood adversity, families, and parents specifically, may still experience substantial degrees of adversity that may require interventions to alleviate. The aforementioned intervention programs thus ought to be viewed as not only beneficial for offspring but for entire families. Moreover, the experience of ongoing adversity even in the absence of proximal health effects may still place the child at increased risk of health problems later in life, as adaptive responses to an adverse family environment may be maladaptive in other contexts later in life (McCrory & Viding, Reference McCrory and Viding2015). While a focus on child development following childhood adversity may be useful for investigating patterns of poor health over time, it fails to acknowledge the fact that in the context of childhood adversity, the entire family system is affected (see also Syed et al., Reference Syed, Howe, Lacey, Deighton, Qummer ul Arfeen, Feder and Gilbert2025). Future research on childhood adversity may greatly benefit from using complex systems approaches to both conceptualize and analyze questions pertaining to adversity within the family context to better align with the complexity of its occurrence (Minnis et al., Reference Minnis, van Harmelen, Gajwani, Rizeq, Combet, Reynolds, Gillberg, Henderson, Ho, Mondelli, Pell, Smith and Shiels2024; Rod et al., Reference Rod, Broadbent, Rod, Russo, Arah and Stronks2023).
Conclusion
In this study, we have explored the dynamics between childhood adversity and health problems. Our findings highlight the complex nature of childhood adversity and health in the first 16 years of life in a section of the Danish population who experience substantial adversity and health problems. Echoing recent discussions in the field (Minnis et al., Reference Minnis, van Harmelen, Gajwani, Rizeq, Combet, Reynolds, Gillberg, Henderson, Ho, Mondelli, Pell, Smith and Shiels2024), our findings suggest that it is time to embrace complexity in both research and interventions addressing childhood adversity and child (health) development.
Supplementary material
The supplementary material for this article can be found at http://doi.org/10.1017/S0033291726105613.
Funding statement
This project has received funding from the European Research Council (ERC) under the European Union’s Horizon 2020 research and innovation program (Grant agreement no. [consolidator grant no. 101124807]). The Copenhagen Health Complexity center is funded by TrygFonden.
Competing interests
The authors declare no competing interests.
Ethical standards
The authors assert that all procedures contributing to this work comply with the ethical standards of the relevant national and institutional committees on human experimentation and with the Helsinki Declaration of 1975, as revised in 2008. Statistics Denmark and the Danish Health Data Authorities granted access to pseudonymized data from the Danish administrative and health registers. DANLIFE has been approved by the Danish Data Protection Agency through the records of research projects that involve personal data at the Faculty of Health and Medical Sciences, University of Copenhagen (Copenhagen, Denmark) (record no 514-0641/21-3000). According to Danish law, registry linkage studies do not require informed consent or ethical approval by the Danish National Committee on Health Research Ethics.



 Open access

