This study is primarily concerned with self-estimated intelligence (SEI) which is a topic of considerable current interest (Freund & Kasten, Reference Freund and Kasten2012; Kaufman, Reference Kaufman2012). The studies are now international ranging from Austria (Stieger et al., Reference Stieger, Kastner, Voracek, von Stumm, Chamorro-Premuzic and Furnham2010) to Spain (Pérez, González, & Beltrán, Reference Pérez, González and Beltrán2010) and Russia (Furnham & Shagabutdinova, Reference Furnham and Shagabutdinova2012) to Portugal (Neto, Mullet, & Furnham, Reference Neto, Mullet and Furnham2016) They have also been extended to issues like self-rated attention and concentration (Mengelkamp & Jager, Reference Mengelkamp and Jager2007).
Over thirty studies that used the ‘multiple’ self-estimated intelligences model (e.g., Furnham, Reference Furnham2000; Furnham & Bunclark, Reference Furnham and Bunclark2006; Furnham, Clark, & Bailey, Reference Furnham, Clark and Bailey1999; Furnham & Gasson, Reference Furnham and Gasson1998; Rammstedt & Rammsayer, Reference Rammstedt and Rammsayer2002a) have found that gender differences were strongest on the mathematical/logical and spatial intelligences, followed by overall (g) and also verbal intelligences, with males giving much higher scores (around 5 to 10 IQ points) than females. This consistent gender difference has been referred to as the Hubris-Humility Effect (HHE) (Storek & Furnham, Reference Storek and Furnham2012; Reference Storek and Furnham2013; Reference Storek and Furnham2014).
A meta-analytical study investigating the magnitude of gender differences in mathematical/logical, spatial, overall and verbal self-assessed intelligences (Szymanowicz & Furnham, Reference Szymanowicz and Furnham2011), found that the biggest weighted mean effect sizes were for mathematical/logical, (d = .44), followed by spatial (d = .43), overall (d = .37) and verbal (d = .07) intelligence, with males providing higher estimates in all but verbal intelligence. Mathematical, spatial and verbal intelligences were the best predictors of self-estimated overall intelligence as demonstrated through numerous multiple regression analyses (e.g., Furnham, Reference Furnham2001). This finding led Furnham (Reference Furnham2000) to conclude that gender differences in SEI reflect laymen’s view of intelligence, i.e., an amalgamation of verbal, mathematical and spatial intelligences. Furnham (Reference Furnham2000) proposed that people view intelligence as ‘male-normative’, since mathematical/logical and spatial intelligences are areas where males are believed to excel.
Cross-cultural studies have shown that while there are consistent sex differences across culture, Africans tend to give themselves highest estimates and Asians lowest, with Americans and Europeans between these extremes. This study aims to confirm the existence of the Hubris-Humility Effect on the Domain-Masculine Intelligence Type with participants from Columbia and England. Few studies have had participants from South America, an exception being Furnham and Chamorro-Premuzic (Reference Furnham and Chamorro-Premuzic2005) who found a five IQ point difference between the male and female students who completed the questionnaire.
The second feature of this study was to examine the separate effects of sex and sex-role in self-estimated intelligence. A few studies done in Britain have examined this issue. Furnham et al. (Reference Furnham, Clark and Bailey1999) in Great Britain, found sex differences more powerful determinants of self-estimates of multiple intelligences rather than gender role (or their interaction). Syzmanowicz and Furnham (Reference Szymanowicz and Furnham2013) in a British study found males estimated their general IQ slightly, but mathematic IQ significantly higher than females, who rated the social and emotional intelligence higher than males. Masculine individuals awarded themselves somewhat higher verbal and practical IQ scores than did feminine participants. Both participant gender and gender role differences in IQ estimates were found, with gender effects stronger in cognitive and gender role than in ‘personal’ ability estimates. Neither of the above studies so a cross-cultural comparison which is done in this study.
Gender stereotypes are thought to play role in HHE (e.g., Petrides, Furnham, & Martin, Reference Petrides, Furnham and Martin2004) and were shown to be most pronounced in areas that are associated with masculine and feminine characteristics, such as math/sciences and arts (Brown & Josephs, Reference Brown and Josephs1999). These stereotypes were also exposed to negatively impact performance and ability perception in women on tasks that are perceived as masculine, such as math (cf. Dar-Nimrod, Reference Dar-Nimrod2007; Kiefer & Sekaqueptewa, Reference Kiefer and Sekaquaptewa2007; Rudman & Phelan, Reference Rudman and Phelan2015; Rydell, Rydell, & Boucher, Reference Rydell, Rydell and Boucher2010; Steele & Aronson, Reference Steele and Aronson1995).
Although the existence of HHE was confirmed in another South American culture, i.e., Argentina (Furnham & Chamorro-Premuzic, Reference Furnham and Chamorro-Premuzic2005) and in nearly all studies with various British populations (cf. Furnham, Reference Furnham2001; Furnham et al., Reference Furnham, Clark and Bailey1999; von Stumm, Gale, Batty, & Deary, Reference von Stumm, Gale, Batty and Deary2009), no other study investigated the existence of HHE on DMIQ in a Colombian and British sample. Thus, HHE is expected to occur in both cultures (H1).
According to Hofstede’s cultural model (2003) Colombia and the United Kingdom are divergent cultures. However, both countries score highly on Masculinity, with Colombia having the second highest national score among South American nations (e.g., Hofstede, Reference Hofstede2003). Given the fact that both countries are highly ‘masculine’, it is expected that masculinity will be the best predictor of DMIQ in both cultures (H2).
Method
Participants
A total of 102 participants took part in this study. There were 54 males (53%) and 48 females. Their age ranged from 18 to 33 (M = 23.30, SD = 3.60) years. Fifty two participants (51%) were native English speakers and 50 were native Spanish speakers from Colombia. In the Colombian population (n = 50), there were 28 males (56%) and 22 females, with their age ranging from 18 to 33 (M = 23.86, SD = 3.93) years. In the UK population (n = 52), there were 26 males (50%) and 26 females, with their age ranging from 18 to 32 (M = 22.77, SD = 3.20) years. The two groups were not significantly different in terms of age or education.
Measures
Domain-masculine intelligence type (DMIQ)
This is a simple half-page questionnaire based on that developed by Furnham and Gasson (Reference Furnham and Gasson1998). The measure was used in all self-estimated intelligence programmic studies by Furnham and his collaborators (e.g., Furnham & Chamorro-Premuzic, Reference Furnham and Chamorro-Premuzic2005; Furnham, Shahidi, & Baluch, Reference Furnham, Shahidi and Baluch2002; Swami & Furnham, Reference Swami and Furnham2010). The measure consists of a normal IQ score distribution (M = 100, SD = 15) with descriptive labels and a normal distribution IQ curve figure. The average score is 100, a score of 55 is labeled ‘mild retardation’, a score of 75 a ‘mild retardation’, a score of 85 ‘low average’, score of 115 ‘high average’, score of 130 ‘superior’, and that of 145 ‘gifted’. Thereafter, a table with the ten labeled and briefly described intelligence types and the overall-estimated IQ score was provided, e.g., ‘Verbal/Linguistic Intelligence: the ability to speak fluently along with understanding of grammar (syntax) and meaning (semantics)’. The ten intelligences were based on Gardner (Reference Gardner1983) and comprise of verbal, mathematical, spatial, musical, body-kinaesthetic, interpersonal, intrapersonal, existential, spiritual, and naturalistic intelligences. The participants were asked to estimate their 10 own actual intelligences as well as their overall IQ scores by providing an actual IQ score estimate. Alpha for Domain-Masculine Intelligence Type was .62 and the inter-item correlation r = .45.
Bem sex role inventory (BSRI; Bem, Reference Bem1981)
This non-timed 60-item measure is designed to measure the orthogonal constructs of masculinity and femininity. Each construct is made of 20 items, with the remaining 20 items measuring the gender-neutral or androgynous characteristics; the items are worded as adjectives. Items were scored using a 7-point scale, where 1 = never or almost never true and 7 = almost always true, e.g., athletic, sensitive to other’s needs, solemn. The scale has been shown to have satisfactory internal reliability and homogeneity, with alphas for masculinity .86 and femininity .74 (Francis & Wilcox, Reference Francis and Wilcox1998). The alphas for masculinity and femininity in this study were, .83 and .80, respectively.
Procedure
Participants in both countries were recruited through word of mouth among student populations and general public Colombian participants were recruited through a local research coordinator, who was a native Spanish speaker. The data were collected face-to-face by the UK and Colombian research administrators, who handed out hard copies of the survey questionnaire, together with Data Protection documents. Participants were also given a brief description of all measures, with short feedback and background of the study. For the Colombian population, all documents were translated into Spanish and back-translated to English by the local Colombian research coordinator. This questionnaire has been translated and back translated into many languages including Chinese and Russian with few problems. Prior to the main survey, the Spanish questionnaire was tested on a number of control subjects, with no difficulties or discrepancies reported. Pilot study indicated that it took approximately 30 minutes to complete the questionnaire. No issues were found, hence the questionnaire was deemed ready for administration. Participants were aware that they were free to withdraw their participation at any point or leave questions unanswered. The study has met the Ethics requirements of the Psychology Department and followed BPS ethical procedures, including seeking informed consent from all participants before undertaking part in the survey.
Results
Hubris-humility effect and the domain-masculine intelligence type
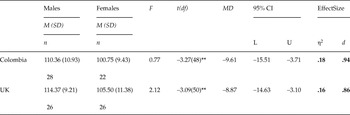
Independent samples t-tests were computed for each population. Results are presented in Table 1. Significant gender differences, with males providing higher self-estimates on DMIQ than females were observed in Colombian and the UK samples. The observed effect sizes were large, with a larger ES for Colombia. Hypothesis 1 was confirmed.
Independent Samples t-Tests and Effect Sizes for DMIQ – Colombia and the United Kingdom

Note: *p < .05, **p < .01, ***p < .001 (2-tailed). d = Cohen’s d. Large effect sizes are in bold.
Impact of gender and masculinity on the domain-masculine intelligence type
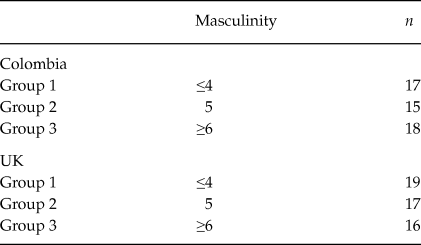
At the outset the dataset was split per nationality. Because the distribution of scores in both samples, masculinity was collapsed into categorical variable, with Group 1 containing subjects with lowest masculinity scores, Group 2 subjects with average masculinity scores and Group 3 subjects with highest masculinity scores. Results are presented in Table 2.
Overview of Masculinity Banded

Note: Computed using Visual Bander technique (SPPS 13.0)
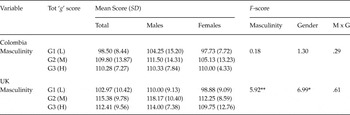
Two 2-way between-groups analyses of variance were conducted to explore whether gender influences the relationship between masculinity and DMIQ in Colombia and the UK. Results are presented in Table 3.
2-way ANOVA (Masculinity and Gender) on DMIQ – Colombia and the United Kingdom

Note: *p < .05, **p < .01, ***p < .001 (2-tailed).
In the Colombian sample, the homogeneity of variance assumption was violated (Levene Statistic p < .05), indicating the groups variances were not equal. An alternative check for comparing variances was used. Firstly, the largest and the smallest standard deviations were squared. The largest squared SD was divided by the smallest squared SD, with resulting value of 1.43, which is smaller than the recommended value of 2, suggesting that the group variances, albeit not equal, were tolerable. Subsequently, the significance level was adjusted to p < .01.
The interaction effect between gender and masculinity was not significant, F(2, 44) = .29, p = .75, η p 2 = .01. The main effect for masculinity, F(2, 44) = 1.82, p = .18, η p 2 = .10 was non-significant. The main effect for gender was also non-significant, F(1, 44) = 1.30, p = .26, η p 2 = .03. Planned contrasts revealed no significant differences between the three groups. Post-hoc comparisons using the Games-Howell and Bonferroni revealed no significant differences in mean scores between the three groups.
For the United Kingdom sample, the interaction effect between gender and masculinity was not significant, F(2, 46) = .61, p = .55, η p 2 = .03. The main effect for masculinity, F(2, 46) = 5.92, p < .01, η p 2 = .21 was significant, with large effect size. The main effect for gender was also significant, F(1, 44) = 6.99, p < .05, η p 2 = .13, with medium effect size. Planned contrasts revealed significant differences between Group 1 and Group 3 (Contrast Estimate –9.10, p < .01). Post-hoc comparisons using the Tukey HSD and Bonferroni tests indicated that mean scores for Group 1 (≤4) differed significantly from mean scores for Group 2 (5) as well as Group 3 (≥6). Results were confirmed by the Ryan-Einot-Gabriel-Welch Range test of homogenous subsets. Thus, hypothesis 2 was partially confirmed.
Gender and gender identity variables as predictors of DMIQ in colombia and the UK
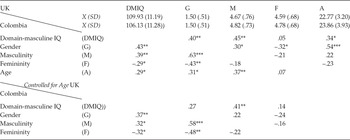
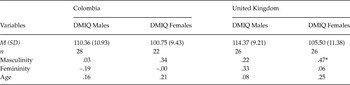
The dataset was split per nationality before all analyses were computed in order to test the hypotheses. The relationship between DMIQ, gender and gender identity variables was explored. Given that age was shown to impact the SEI estimations (e.g., Rammstedt & Rammsayer, Reference Rammstedt and Rammsayer2002b) and correlated with DMIQ the variable was included in the analysis to consider whether it plays role in this dual-culture sample. The results of the correlational and partial correlational analyses are presented in Tables 4 and 5.
Correlations and Partial Correlations, Means and Standard Deviations between DMIQ, Gender, Gender Identity, and Age – Colombia (n = 50) and the UK (n = 52)

Note: *p < .05, **p < .01, ***p < .001 (2-tailed).
Correlations, Means and Standard Deviations between DMIQ, Gender Identity and Age – Per Gender and Nationality

Note: *p < .05, **p < .01, ***p < .001 (2-tailed).
For the Colombian population, a medium positive correlation was observed between DMIQ and gender (r = .43, p < .01), with males providing higher scores than males (M Male = 110.36, SD Male = 10.93; M Female = 100.75, SD Female = 9.43). Medium positive relationships were observed between DMIQ and masculinity (r = .39, p < .01) and between DMIQ and age (r = .29, p < .05), with older Colombian participants providing higher DMIQ estimates. This finding validates the findings of Study 8. Medium negative relationship was observed between the intelligence type and femininity (r = –.29, p < .05).
Given the significant relationship between age and DMIQ, the correlational analysis was recomputed, with age partialled out. An inspection of the partial correlational matrix revealed no significant differences in the correlational pattern from the initial analysis. However, an independent samples t-test for age was significant; t(48) = –2.26, p < .05; M Male = 24.93, SD Male = 3.90; M Female = 22.50, SD Female = 3.62, with older Colombian participants being male. The magnitude of the differences in the means (mean difference = –2.43, 95% CI: –4.59 to –.26) was medium (η2 = .10; Cohen’s d = .65). It should be noted that the small sample size (n = 50) is likely to have influenced the results.
For the United Kingdom population, a medium positive correlation was observed between DMIQ and gender (r = .40, p < .01), with males providing higher scores than males (M Male = 114.37, SD Male = 9.21; M Female = 105.50, SD Female = 11.38). Medium positive relationships were observed between DMIQ and masculinity (r = .45, p < .01) and between DMIQ and age (r = .34, p < .05), with older British participants providing higher DMIQ estimates. No other significant relationships were observed.
Given the significant relationship between age and DMIQ, the correlational analysis was recomputed, with aged partialled out. When age was controlled for, gender no longer correlated with DMIQ. Likewise, the previously significant relationships between masculinity, femininity and gender lost significance. An independent t-test for age was significant; t(50) = –4.47, p < .001; M Male = 24.46, SD Male = 2.87; M Female = 21.08, SD Female = 2.58, with older British participants being male. The magnitude of the differences in the means (mean difference = –3.39, 95% CI: –4.91 to –1.86) was large (η2 = .29; Cohen’s d = 1.24). As in the Colombian sample, the size of the UK sample (n = 52) is likely to have influenced the results. Overall the results imply that age influenced DMIQ estimates in both cultures. This replicates many other findings.
Gender as the best predictor of DMIQ
To further investigate whether the correlational patterns differed for males and females, the data was split per gender and the correlations recomputed (see Table 5). For Colombia, no significant relationships were observed. In the British sample, the only significant relationship was observed between DMIQ and masculinity (r = .47, p < .05) but only for females. Although an unexpected finding, it confirms female susceptibility to gender role stereotypes that appear to be the strongest in areas perceived as ‘masculine’, such as maths, spatial abilities and sciences (Rudman & Phelan, Reference Rudman and Phelan2015). At the same time, the results confirms that females associate DMIQ with ‘masculine’ qualities.
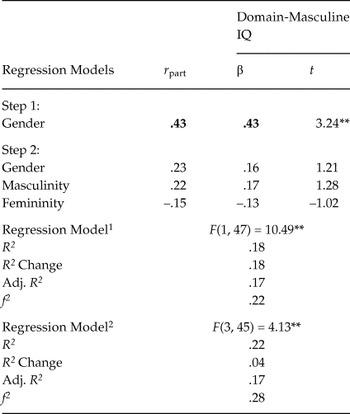
In order to test hypothesis 3, hierarchical regression was computed with the Colombian population. Results are presented in Table 6. Gender and gender identity were regressed on DMIQ to ascertain whether masculinity was the best predictor. Stepwise method was used for each block.
Hierarchical Regression of Gender and Gender Identity Constructs onto DMIQ – Colombian Sample (n = 50)

Note: *p < .05, **p < .01, ***p < .001 (2-tailed). Significant values are in bold.
Gender (β = .43, p < .01, r part = .43) was entered in Step 1, explaining 19% of variance in domain-masculine intelligence. When gender identity variables were added at Step 2, gender failed to reach significance but neither masculinity nor femininity did reach significance. The overall regression was significant, F(3, 45) = 4.13, p < .01, f 2 = .28, with the overall model explaining 22% of total variance in DMIQ. Thus, hypothesis 3 was not confirmed in the Colombian sample.
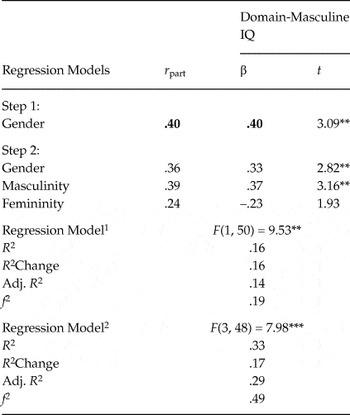
Table 7 shows the hierarchical regression results for the British population. Gender and gender identity were regressed on DMIQ to ascertain whether masculinity was the best predictor. Gender (β = .40, p < .01, r part = .40) was entered in Step 1, explaining 16% of variance in DMIQ. When masculinity and femininity were added at Step 2, gender (β = .36, p < .01, r part = .33) explained 11% of variance. As predicted, Masculinity (β = .39, p < .01, r part = .37) was also a significant predictor of the intelligence type. Masculinity explained 14% of variance in DMIQ and as such was its best predictor. Femininity did not significantly contribute to the prediction. The overall regression was significant, F(3, 48) = 7.98, p < .001, f 2 = .49, with the overall model explaining 33% of total variance in DMIQ. Hence, hypothesis 3 was confirmed in the British sample.
Hierarchical Regression of Gender and Gender Identity Constructs onto DMIQ – United Kingdom Sample (n = 52)

Note: *p < .05, **p < .01, ***p < .001 (2-tailed). Significant values are in bold.
Thus, hypothesis 1 was confirmed and hypotheses 2 and 3 were partially confirmed.
Discussion
This study intended to confirm the previous literature findings with regard sex and sex role difference in self-estimates of DMIQ. In addition, this study was unique in that it compared two distinctive cultures, Colombia and the United Kingdom. To date we believe no SEI study was conducted with a Colombian sample.
The first hypothesis aimed to confirm the existence of HHE on DMIQ. The data supported the hypothesis for both cultures, with Colombia having a slightly large effect size (η2 = .18, d = .94) than the British sample (η2 = .16, d = .86). The results confirm the claim that gender differences in SEI, and in particular on DMIQ, are universal and pan-cultural (cf. Furnham, Reference Furnham2001; von Stumm et al., Reference von Stumm, Gale, Batty and Deary2009).
The second hypothesis, which expected gender to influence the relationship between masculinity and DMIQ in both cultures, was partially confirmed. No significant effects were observed in the Colombian sample. Nonetheless, the small sample size is likely to have impacted the results which is a serious limitation for this under powered study. For the British sample, a large significant masculinity effect and a medium gender effect were observed. The main interaction was not significant. The results have shown that individuals with the lowest masculinity provided lowest DMIQ estimates that differed significantly from the estimates of average and highest masculinity individuals. Unexpectedly, individuals with average masculinity provided the highest DMIQ estimates. The very same estimation pattern was observed for both genders, with average masculine males and females providing the highest DMIQ estimates. Furthermore, males had higher DMIQ estimates than females in all three masculinity groups, providing further support for male hubris in estimation. Equally, correlational analyses revealed that masculinity correlated positively with DMIQ in both cultures, while femininity correlated negatively with DMIQ, but only in the Colombian sample. Moreover, age influenced DMIQ estimates in both samples, further confirming existing literature (Rammstedt & Rammsayer, Reference Rammstedt and Rammsayer2002b). The results also revealed that British females, but not males, perceived DMIQ as masculine, replicating other studies and confirming the assertion of male-normativeness of intelligence (cf. Furnham, Reference Furnham2001).
Given that both cultures are highly Masculine (Hofstede, Reference Hofstede2003) masculinity was expected to be the best predictor of DMIQ, over and above gender and femininity. The results partially confirmed this, with masculinity as the best predictor of the intelligence type, but only in the British sample. Although the overall hierarchal regression was significant in the Colombian sample, no variable significantly contributed in the prediction of DMIQ. This finding is surprising, given that Colombia is a second highest masculine culture in South America (Hofstede, Reference Hofstede2003). Yet, the small sample sizes are likely to have influenced the results in both cultures.
This study had a major limitation of small sample size which may had various consequences. It meant the study was under-powered and that the N was insufficient to achieve a normal distribution of the masculinity score which was categorized. However despite this limitation many results confirmed previous studies on DMIQ conducted exclusively in Europe (Storek & Furnham, Reference Storek and Furnham2012; Reference Storek and Furnham2013; Reference Storek and Furnham2014). Thus this should be described as an exploratory study and one that merits replication and extension.