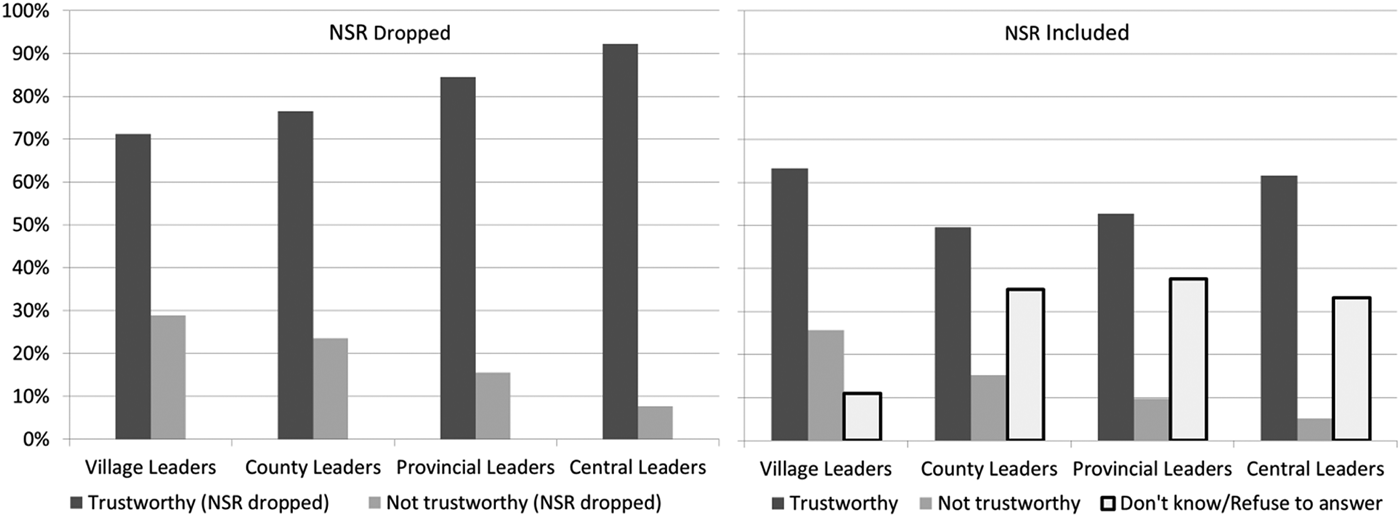
Conventional wisdom maintains that Chinese citizens have relatively high levels of trust in the central government but low levels of trust in local government.Footnote 1 As the story goes, the centre benefits from widespread perceptions that Beijing's policies are well intentioned and that local officials are to blame for improper implementation. Initial analysis of our survey of villagers supports this contention. When nonresponse is taken into consideration, however, we find little difference between trust in central and local officials (see Figure 1).
Trust in State Leaders with and without Nonresponse
Source:
HEPS survey.

When we include nonresponse (i.e. do not know, refuse to answer or missing), the proportion of respondents who stated that they trusted government officials was stable across each level of government: 62 per cent for central leaders; 53 per cent for provincial leaders; 50 per cent for county leaders; and 63 per cent for village leaders. Remarkably, both central and village leaders received higher proportions of respondents expressing trust in them than did provincial or county leaders, complicating our understanding of political trust in China.
To examine item nonresponse in China, this report utilizes the Health, Environmental Protection and Society Survey (HEPS). This original survey of over 800 villagers in rural China was conducted by the authors in 2012. We also conducted a similar analysis with four additional datasets that have been cited as evidence of high political trust in China:Footnote 2 the 1993 Survey on Social Mobility and Social Change in China (SSMSC); the 2008 China Survey; the 2011 Asian Barometer (Wave 3); and Lianjiang Li's 2014 survey.Footnote 3
From our HEPS survey, we find that item nonresponse can be significantly reduced through careful questionnaire design and enumerator training. We find low rates of non-substantial response (NSR) on politically sensitive questions in all the data we analysed, which indicates that survey research is useful even in an authoritarian setting. Marginalized individuals are more likely to give a non-substantial response, but the relationship between cosmopolitanism and NSR is unclear. We also find that marginalized individuals have different perceptions of trust compared to their privileged counterparts. Finally, we find that nonresponse may have led scholars to overestimate political trust and exaggerate the gap between trust in central and local leaders.
Nonresponse in Survey Research
There are two types of nonresponse: unit nonresponse and item nonresponse. Unit nonresponse occurs when the respondent refuses or fails to participate in the survey. Neil Munro finds that unit nonresponse, also known as refusal bias, may have contributed to overestimates of trust in government by as much as 6 per cent,Footnote 4 despite advances in sampling techniques that seek to minimize the effect of refusals.Footnote 5 In addition to unit nonresponse, item nonresponse is common in surveys in China and may impact substantive conclusions.Footnote 6
Item nonresponse, or non-substantial response, can be defined as “the failure to obtain information for a question within an interview or questionnaire” and can occur owing to respondent and/or question characteristics.Footnote 7 We use both terms, “item nonresponse” and “non-substantial response,” to indicate a response of “do not know,” “refuse to answer” or for missing data in lieu of answering a question. Several respondent characteristics have been associated with item nonresponse: education, age, sex and cognitive ability.Footnote 8 NSRs sometimes suggest that the respondent perceives the question as sensitive, which could also mean that preference falsification could be higher for these questions.Footnote 9
NSR is understudied in the China field but the few existing studies suggest that politically sensitive questions are associated with NSRs and that changes in political dynamics can change NSR rates. NSRs for questions concerning satisfaction with the government increased by approximately 10 to 20 per cent following the 1989 government crackdown in Tiananmen Square.Footnote 10 Using the World Values Survey, Liying Ren finds that China has comparable rates of NSR to the US in general but higher rates of NSR with political questions.Footnote 11 With the exception of Ren's study, research on NSR in China relies on data from the 1990s.Footnote 12 Experimental studies are divided on the degree to which Chinese self-censor through nonresponse or preference falsification.Footnote 13 Recent survey research only briefly discusses NSR.Footnote 14
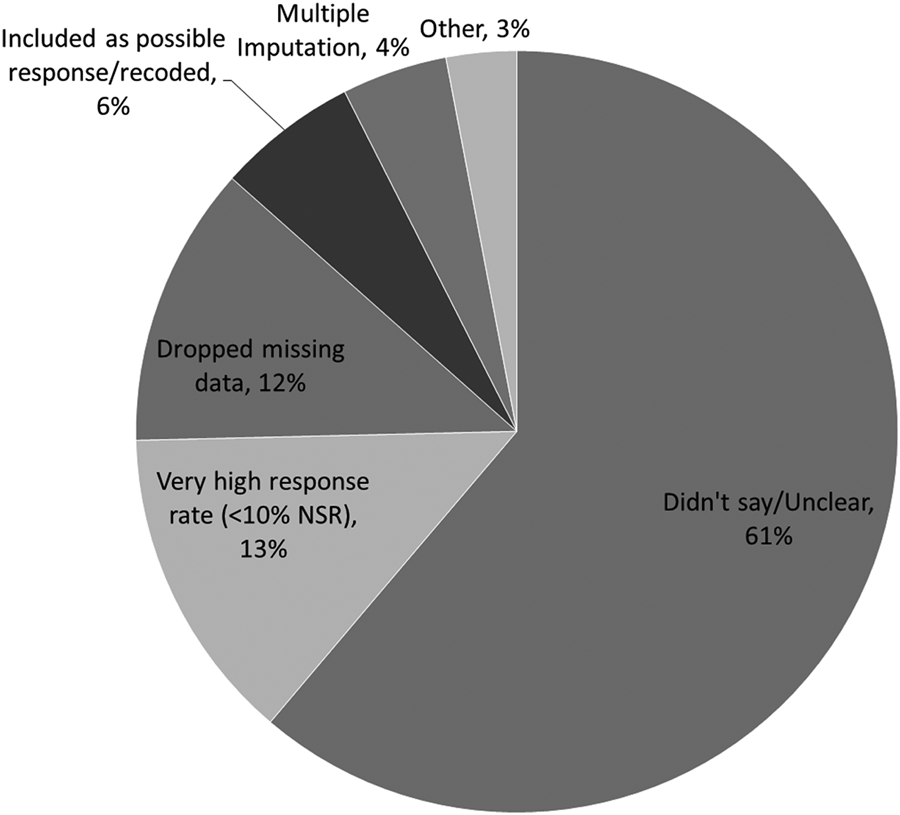
Until recently, survey research in China was uncommon: Melanie Manion identifies only eight scientific political science surveys conducted between 1978 and 1995.Footnote 15 In 1996, survey research increased but publications often avoided discussing nonresponse. We found that in 67 studies published between 1998 and 2016 that use survey data collected in China related to politics, 61 per cent did not specify an NSR rate, nor did they explain how they addressed NSR in their analysis (Figure 2). Some had a very high response rate. Others dropped the missing data, while a few recoded missing data or used imputation.
Nonresponse in Survey Research in China
Notes:
Sample includes 67 academic publications from 1998 through 2016 that use survey research in China on political or social science topics.

We focus on survey questions on political trust, i.e. whether respondents perceived government leaders at the village, county, provincial and central levels to be trustworthy.Footnote 16 A commonly held belief in China is that Beijing's policies are good but that local government is corrupt and implements central policies poorly. Central officials generally enjoy high levels of trust while local leaders are blamed for problems.Footnote 17 Therefore, questions regarding trust in government leaders are particularly salient in the Chinese context.
Nonresponse and Survey Design: HEPS
We deliberately sought to reduce nonresponse in HEPS. First, we designed questionnaire items to be consistent with local linguistic expressions. Second, to the extent possible, we selected teams of enumerators who were gender balanced, local to the region and who spoke local dialects. Third, enumerators underwent three days of training, which included a pre-test in each province, following best practices.Footnote 18
A common preconception about villagers is that they suffer from suzhi di 素质低, which roughly means “lacking cognitive ability and education overall” and is often indelicately translated as “low quality.” Many of our enumerators were concerned that villagers would not understand or would not have considered the issues in the questionnaire, rendering the data meaningless. This attitude presented two challenges. First, we had to convince the enumerators that this preconception was neither relevant nor accurate, so that enumerators’ biases would not affect how they asked or recorded questions. Second, enumerators would have to actively pre-empt rural respondents’ expectations that villagers were regularly perceived as inferior, having often experienced urban hauteur. Enumerators had to convince respondents that they were trustworthy and that they respected villagers’ contributions while asking them personal and sensitive questions. We worked intensively with enumerators on how to build a rapport with villagers.
Our analysis of the HEPS data demonstrates first, that with careful survey design, NSR need not prevent survey research in an authoritarian regime, and second, that villagers’ individual characteristics can partly explain the likelihood of an NSR but in some unexpected ways. There are two major factors that would lead us to expect a higher rate of NSR among Chinese villagers as compared to respondents in a democratic context. First, interviewees may fear social and political costs, including retaliation from officials, for responses that challenge the status quo of state control. In rural areas, most villagers have never participated in a survey and may not feel confident that their responses will be kept anonymous and confidential, which compounds pre-existing fears of political persecution. The second factor relates to the aforementioned discussion of suzhi di and lower levels of education in the countryside. A low level of education may mean that respondents have limited cognitive resources to process and evaluate the question, which has been established as a source of higher NSRs elsewhere.Footnote 19
Explaining NSR: Hypotheses
Previous research in the US has found that respondents with fewer socio-economic resources are more likely to give a non-substantial response.Footnote 20 Following this research, we hypothesize that villagers will be less likely to give an NSR if they occupy a relatively privileged position in society – that is, if they are male, have a higher level of education, are more cosmopolitan and a Chinese Communist Party (CCP) member. Previous studies of nonresponse in China have found a “gender effect” that leads to higher rates of NSR among women, but the reasons for this effect are unknown.Footnote 21 We hypothesize that:
H1: Villagers who are women are more likely to give a non-substantial response.
Previous research indicates that education is inversely associated with the likelihood of giving an NSR.Footnote 22 Scholars in China typically affirm that this factor is even more salient in the context of rural China because villagers have suzhi di, yielding Hypothesis 2:
H2: Villagers with a lower level of education are more likely to give a non-substantial response.
We hypothesize that CCP members will be less likely to provide an NSR. CCP members are more likely to have interactions with higher-level government officials and attend Party meetings that provide them with broader perspectives. Because the CCP is an elite party (about 6 per cent of the population) and recruitment strategies deliberately select more educated individuals, CCP members tend to be more educated and wealthier than non-members.Footnote 23 In our sample, fewer than 10 per cent of villagers are Party members (see Table A.1). We hypothesize that even when controlling for education, Party membership will be associated with lower rates of NSR because Party members are more cosmopolitan. CCP members may also feel more confident to critique the government as part of the party-state apparatus because their status is more secure and supported by their networks. Or, they may choose to strategically inflate their evaluations of the government, rather than give an NSR.
H3: Villagers who are Party members are less likely to give a non-substantial response.
The Chinese concept of suzhi di encompasses more than an individual's educational attainment; it connotes that an individual is parochial, that is, not exposed to issues beyond a small and limited community. Therefore, we expand on H2 by testing whether villagers who are less parochial – or more cosmopolitan – are also less likely to provide an NSR. We measure a villager's degree of cosmopolitanism through several indicators depending on the variables available in each survey. These include having engaged in migrant labour, having family or close friends in a large city or foreign country, following major foreign events, using the internet at home or at an internet café, frequency of watching news on TV, and frequency of reading the newspaper. Migrants who leave the village to work in a larger city will be exposed to (but excluded from enjoying) higher standards of living. Villagers who have close friends or family in large cities or abroad are more likely to have heard about life beyond the village and to have considered larger questions about politics and society and, therefore, likely to have more cognitive resources to respond to complex survey questions. Similarly, villagers who follow foreign events, use the internet, watch TV news or read the newspaper are likely to be more cosmopolitan. Based on this logic, we propose Hypothesis 4:
H4: Villagers who engage in more cosmopolitan behaviour are less likely to give a non-substantial response.
Explaining NSR: Findings
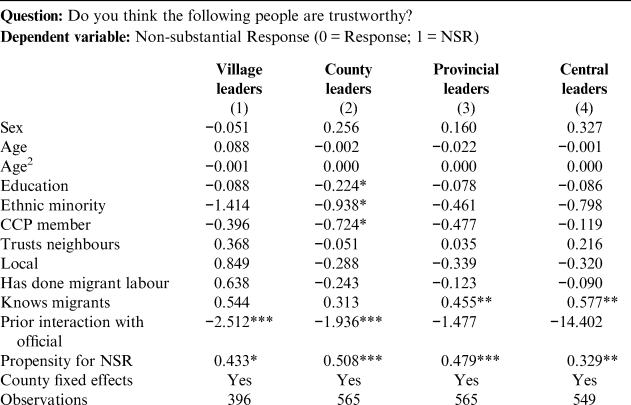
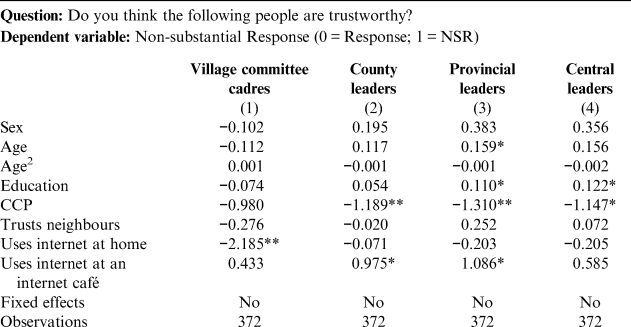
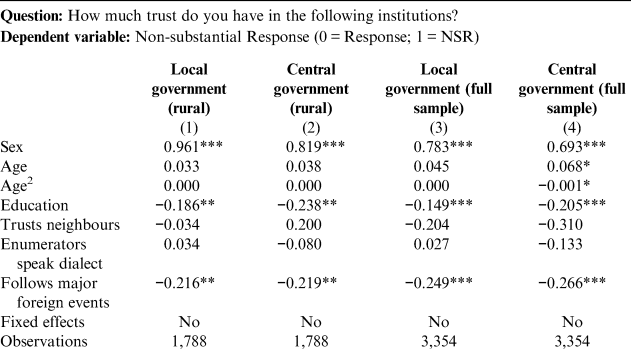
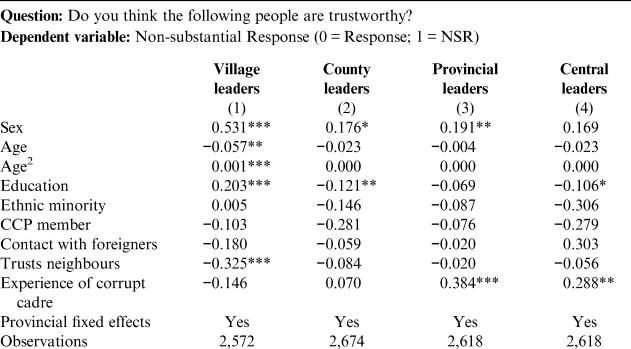
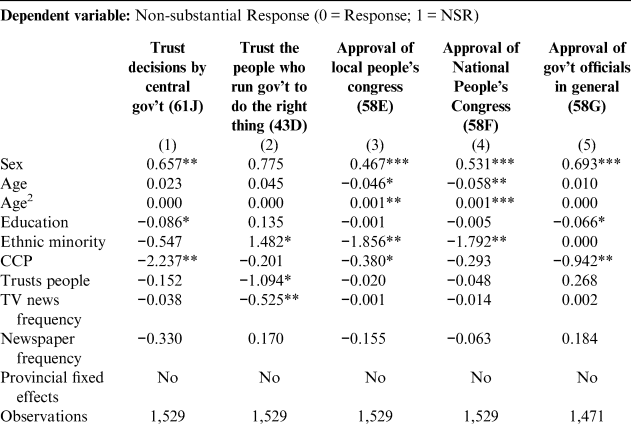
We tested these hypotheses using questions about whether government officials are trustworthy.Footnote 24 We constructed a variable for NSR by coding a substantial response as 0 and an NSR (“do not know,” “refuse to answer,” or missing) as 1. As available for each survey, we included relevant control variables: age, age-squared, whether the respondent belongs to an ethnic minority,Footnote 25 whether the respondent was born in the village (local), how trustworthy the respondent believes other villagers are, whether the respondent had prior interaction with the officials in the question, experience with corrupt officials, and an index to capture innate propensity for an NSR. Where available, we included county or provincial fixed effects to capture unknown factors associated with the locality.Footnote 26 Details regarding the questions and variable measurements for each survey are provided in the online Appendix. Tables 1 through 5 summarize the results of the logistic regressions for each survey.
Logistic Regression of Non-substantial Response in HEPS, 2012

Source:
Authors’ survey of Chinese villagers.
Notes:
*p < 0.10, **p < 0.05, ***p < 0.01.
Logistic Regression of Non-substantial Response in Lianjiang Li's Survey, 2014

Source:
Li Lianjiang's survey. Data are used with permission.
Notes:
This dataset did not provide adequate information to use provincial or county fixed effects. * p < 0.10, ** p < 0.05, *** p < 0.01.
Logistic Regression of Non-substantial Response in the Asian Barometer Survey, 2011

Source:
Asian Barometer Wave 3, www.asianbarometer.org. Data are used with permission.
Notes:
The Asian Barometer does not provide adequate information to use provincial or county fixed effects. *p < 0.10, **p < 0.05, ***p < 0.01.
Logistic Regression of Non-substantial Response in the China Survey, Rural Subset, 2008

Source:
China Survey. Available upon request through Texas A&M University, https://pols.tamu.edu/data-resources/. Data used with permission. The China Survey is a project of the College of Liberal Arts at Texas A&M University, in collaboration with the Research Center for Contemporary China (RCCC) at Peking University.
Notes:
Provincial fixed effects are used rather than county fixed effects because the number of observations for each county would be very small. *p < 0.10, **p < 0.05, ***p < 0.01.
Logistic Regression of Non-substantial Response in the SSMSC, Rural Subset, 1993

Source:
Shi, Tianjian. 1993. “Survey on social mobility and social change,” available at the China Archive at Texas A&M University, http://chinaarchive.tamu.edu/portal/site/chinaarchive/.
Notes:
The dataset does not provide adequate information to use provincial or county fixed effects. *p < 0.10, **p < 0.05, ***p < 0.01.
Overall, our analyses support the argument that marginalized groups are more likely to give an NSR, with some exceptions. Women are more likely to give an NSR in three of the five surveys (Asian Barometer, China Survey, SSMSC), supporting H1.Footnote 27 Education is negatively associated with giving an NSR in four surveys (HEPS, Asian Barometer, China Survey, SSMSC), supporting H2. That said, in the model of trust in village leaders for the China Survey and in two models of Lianjiang Li's survey data, more educated respondents were more likely to give an NSR, suggesting the need for further research on the role of education and survey participation. Party membership is negatively associated with giving an NSR in three surveys (HEPS, Lianjiang Li, SSMSC), supporting H3.Footnote 28
Does this, then, confirm the suspicions of those who claim that villagers have suzhi di? In fact, measures of cosmopolitanism reveal a more complicated relationship. Villagers who followed foreign events regularly were less likely to give an NSR for the Asian Barometer and villagers who watched more TV news were less likely to give an NSR for the SSMSC, suggesting that more cosmopolitan villagers are less likely to give an NSR, as expected. However, other measures indicate that more cosmopolitan villagers are more likely to give an NSR. Villagers who have close friends or relatives in large cities or abroad were more likely to provide an NSR in HEPS. In Lianjiang Li's survey, villagers who used the internet at home were less likely to give an NSR, although villagers who used the internet in an internet café were more likely to give an NSR. Other measures did not have a statistically significant association with NSR, including having undertaken migrant labour (HEPS), contact with foreigners (China Survey) and frequency of reading a newspaper (SSMSC). Thus, these data do not support a clear association between cosmopolitanism and NSR, although this issue merits further study.
Implications for Estimates of Political Trust
We have established that marginalized individuals tend to be underrepresented in surveys in China, but does their absence affect substantive conclusions? We examine the substantive implications of our findings in two ways: first, by examining whether marginalized individuals tend to hold different views as compared to their more privileged counterparts, and second, by comparing estimates of political trust with and without NSR.
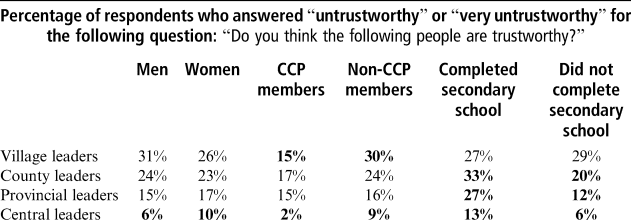
First, if marginalized individuals tend to have systematically different opinions as compared to their more privileged counterparts, then we may misjudge public opinion in China.Footnote 29 We use the HEPS data from those who responded to examine whether marginalized individuals – women, non-Party members and the less educated – hold different opinions regarding the trustworthiness of government officials. Table 6 summarizes these results.
Expression of Distrust in Government Officials in HEPS, 2012

Source:
Authors’ survey of Chinese villagers.
Notes:
Bolded percentages indicate that the difference in the proportions expressing distrust between the two categories is statistically significant at the p < 0.05 level based on a z-test. Percentages calculated based on those who responded to the question. NSRs (“don't know,” refuse to answer, and missing data) are excluded.
Focusing on the statistically significant differences in bold in Table 6, women are more likely to express distrust in the central leaders; non-Party members are more likely to express distrust in village and central leaders; and less educated villagers are less likely to express distrust in government leaders above the village level. Overall, marginalized individuals hold different views as compared to their privileged counterparts. Imputation may reduce the effect of nonresponse bias but we remain concerned that the complexities of respondents’ views on sensitive issues and the possibility of preference falsification could reduce the effectiveness of this technique.
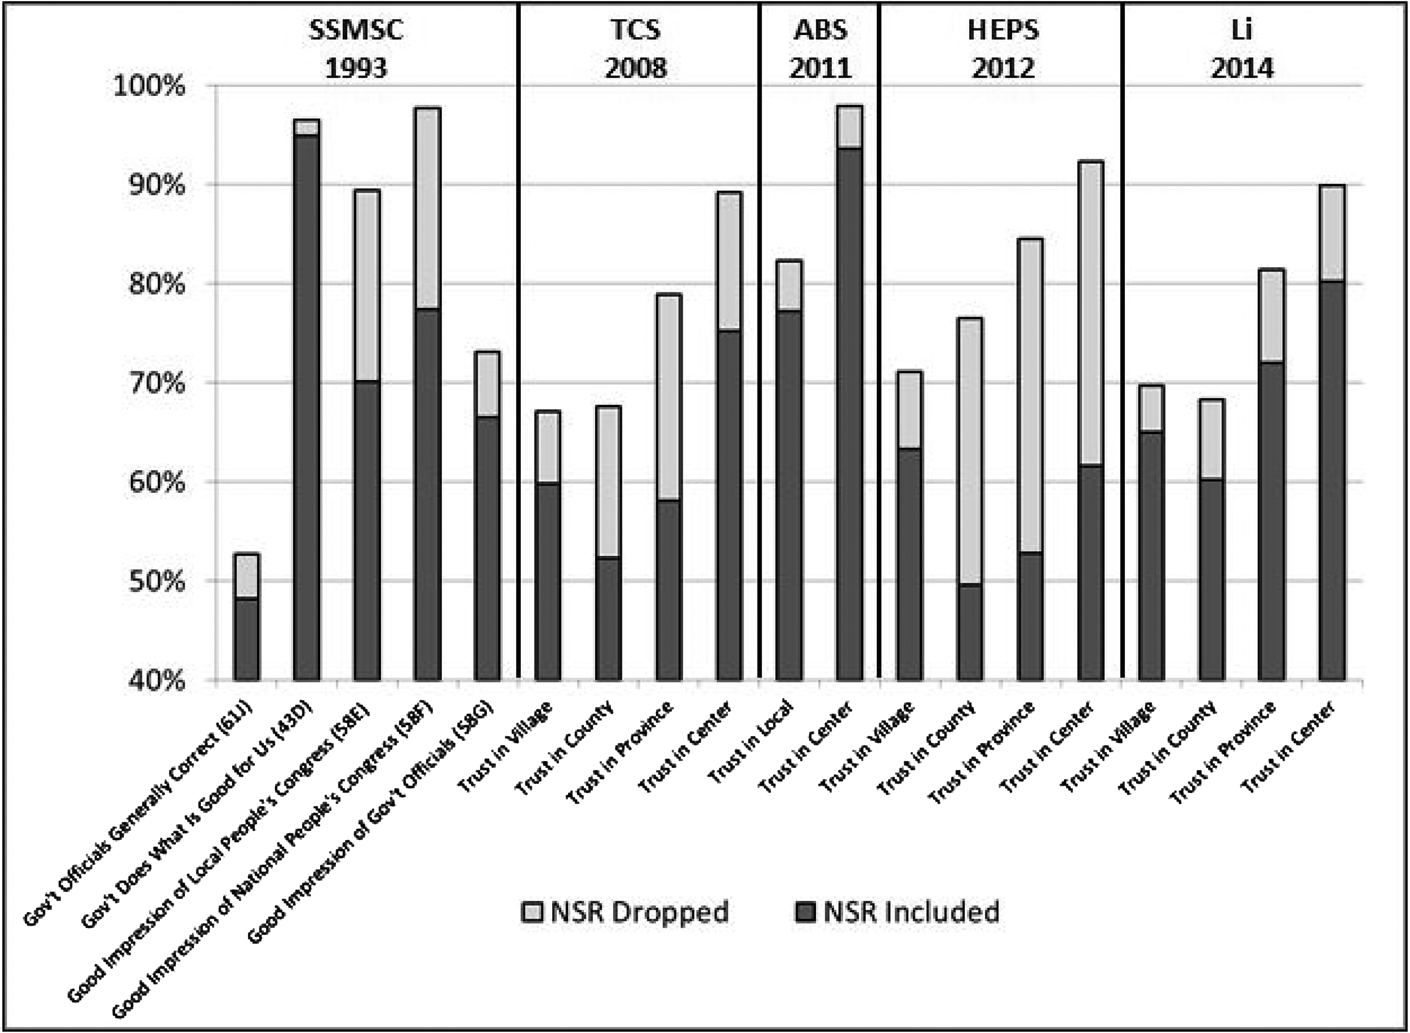
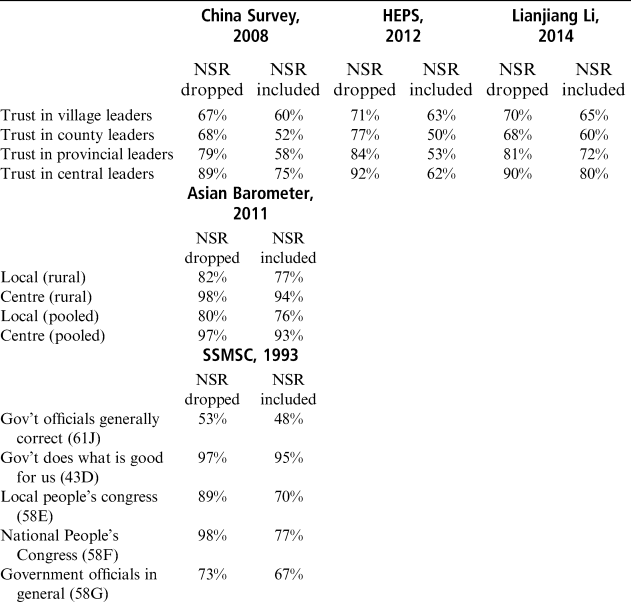
Second, failing to account for NSR may have caused scholars to overestimate political trust and exaggerate the gap in trust between central and local leaders. Table 7 and Figure 3 show the proportion of respondents who replied that they trust or approve of the government, according to each of the questions that we studied in the five surveys (see online Appendix for details). In Figure 3, the dark grey bars show this statistic with NSR included in the calculation, whereas the light grey bars show the resulting higher proportion when NSR is excluded. Once NSR is taken into consideration, trust and approval of government decrease in all the surveys we analysed. Focusing on instances where the estimate dropped by at least 10 per cent, trust in the central government decreased by 14 per cent (China Survey), 31 per cent (HEPS) and 10 per cent (Li) when nonresponse was included in the calculation, with similar reductions in the estimates of trust in the province (HEPS, The China Survey) and county (HEPS, The China Survey). In the SSMSC, the proportion of respondents that indicated a positive impression of the local people's congress and the National People's Congress diminished by 19 per cent and 20 per cent, respectively, when NSR was included.Footnote 30
Trust in and Approval of Government in Rural China, with and without Non-Substantial Response
Sources:
SSMSC; the China Survey; Asia Barometer Survey; HEPS; Li Lianjiang's survey.
Notes:
Figure shows the percentage of respondents who replied that they trust or approve of the government. The dark grey bars show the calculation as a proportion of all respondents, including NSR (don't know, refuse to answer, missing), and the light grey bars show the higher proportion that results if NSR is dropped from the sample.

Trust and Approval of Government with and without NSR

Sources:
The China Survey; HEPS; Lianjiang Li's survey; Asian Barometer Wave 3; SSMSC.
Notes:
For the SSMSC, the percentages indicate the proportion of respondents who agreed with the statement for questions 61J and 43D. For 58E, 58F and 58G, the percentages indicate the proportion of respondents who said that the people's congress or government officials were “good” (see Appendix for further details on these questions).
Political trust in China still appears to be relatively high but these results call into question the received wisdom. Focusing on the China Survey, HEPS and Lianjiang Li's survey, trust in central leaders may range from 62 to 80 per cent, as compared to 89 to 90 per cent if NSR is dropped. Meanwhile, estimates of political trust at the local level are less affected by NSR. Trust in the village leaders may range from 60 to 65 per cent with NSR included, as compared to 67 to 71 per cent with NSR dropped. Averaging the results of these three surveys, without accounting for NSR, we might conclude that 90 per cent of villagers trust central leaders, while only 69 per cent trust village leaders. However, the new estimates with NSR included suggest that only 72 per cent trust central leaders and 63 per cent trust village leaders – a far less dramatic gap. Thus, inattention to nonresponse may have caused scholars to both overestimate political trust and exaggerate the gap in trust between central and local leaders.
Conclusion
Nonresponse to politically sensitive questions continues to complicate inference from survey research in China. First, we find that relatively marginalized respondents – women, less educated individuals, non-CCP members – are more likely to give an NSR, leading to potential bias. These patterns are fairly consistent across the five surveys that we analysed. Cosmopolitanism is sometimes associated with NSR but the direction of the association varies, yielding inconclusive results. As marginalized respondents are likely to hold different opinions from their more privileged counterparts, their absence is palpable. Indeed, our understanding of political trust in China has been compromised by nonresponse, leading to artificially high estimates of trust in the centre and exaggerated accounts of the gap between trust in central and local leaders.
To address this issue, researchers should work to make surveys more inclusive, with attention to the gender disparity, and seek to understand the role of cosmopolitanism in villagers’ willingness to respond to sensitive questions. We offer four specific recommendations for future research. First, preconceived assumptions about what respondents are willing to answer should be carefully evaluated, even in authoritarian countries. There are many methods and opportunities to ascertain the limits of what is politically advisable without endangering enumerators, collaborators or respondents, and all efforts should be made to confirm those limits through preliminary research and pre-tests. Second, NSR can be attenuated through intensive enumerator sensitivity training, careful wording of questions and face-to-face interviews. Third, research in politically restrictive environments can be challenging but can yield useful information, even in the form of non-substantial response patterns. Last, as nonresponse can bias substantive conclusions, researchers should take care to address this issue in their analyses as rigorously and transparently as possible.
Acknowledgements
This research would not have been possible without the generosity of many scholars in sharing their hard-won data. We greatly appreciate Lianjiang Li's willingness to share his data as well as the Asian Barometer Survey and the China Survey for readily providing their data upon request. We also appreciate the late Tianjian Shi for his pioneering work and transparency in making his data publicly available. We are grateful to Meina Cai, Nicholas Horton, Jessica Pearlman and Samantha Vortherms for their feedback and assistance. For research assistance, we are grateful to Hadley Dorn, Richard Figueroa, John Melo and Katherine Pedersen. Many thanks go to Bonnie Lin and Shukry Zablah for careful data wrangling and analysis and to Kelly Dagan for library support. We gratefully acknowledge support from the National Science Foundation IGERT: Training Program on Biodiversity Conservation and Sustainable Development in Southwest China at the University of Wisconsin–Madison (Grant No. DGE-0549369), National Science Foundation Doctoral Dissertation Improvement Grant (No. SES-1023872), a Chiang Ching-kuo Foundation Scholar Grant, the Foreign Policy Institute at the Johns Hopkins School of Advanced International Studies (SAIS) and Amherst College. We are especially thankful for Melanie Manion's invaluable guidance during fieldwork. To the many unnamed colleagues, students and villagers in China who worked with us, we owe a special debt of gratitude. All errors are our own.
Supplementary material
Supplementary material is available online at https://doi.org/10.1017/S0305741019001231.
Conflicts of interest
None.
Biographical notes
Kerry RATIGAN is assistant professor of political science at Amherst College and the fellow for China–Latin America–US Affairs at the Foreign Policy Institute at the Johns Hopkins School of Advanced International Studies (SAIS).
Leah RABIN is an independent scholar whose research focuses on law and politics.