Interactions with the police shape political participation. Recent work has uncovered the way that harsh, personal contact with the criminal justice system is often linked with demobilization, while indirect, proximal contact tends to mobilize political participation (for an overview, see White Reference White2022). While most work has centered on the effects of arrests or incarceration on political participation, the most common form of (involuntary) police contact comes from traffic and pedestrian stops, a much lighter form of contact: In 2015, almost half of all police-initiated contact with citizens could be attributed to routine traffic or pedestrian stops (Davis et al. Reference Davis, Whyde and Langton2018). “Light” police contact is characterized by ending in either no or a minor penalty, like a traffic ticket, minimally stripping individuals of resources, and requiring no or minimal follow-up contact with the criminal justice system. In contrast, being arrested or incarcerated comes with higher penalties, strips resources and freedoms (at least temporarily), and requires ongoing or significant follow-up contact with the criminal justice system.
While we know that harsh interactions with the police and carceral state are deeply political, less is known about how these light interactions may shape participation, despite their greater prevalence. Here, we specifically focus on nonvoting forms of political participation, as political participation can and often does take forms outside the voting booth (Owens and Walker Reference Owens and Walker2018) and less is known about the way contact with the carceral state shapes political participation outside voting (White Reference White2022). To better understand the political consequences of light police contact, we ask: Do routine encounters with the police, such as traffic stops, have consequences for nonvoting forms of political participation? Further, if there are effects, do they vary by the individuals’ perceptions of the police—or by race?
There are three possible answers to this question. First, light contact may produce similar, if more muted, responses by individuals as harsh contact—that is, those experiencing negative contact may be less likely to participate. After all, it is still involuntary contact intended to correct a behavior via punishment. Second, these encounters may be so minor that they do not affect political participation. They are less all-encompassing and less likely to result in a long-term stripping of resources than harsher forms of contact.
Lastly, and as we argue, light contact may increase the likelihood of political participation, especially for those with more positive perceptions of the police—often, White people. Considering that many people never directly interact with any form of government, even these milder interactions with law enforcement, an arm of government, could affect citizens’ willingness to participate politically. Additionally, unlike harsh contact, light contact typically does not substantially strip an individual of resources—thus allowing them a means to participate if they so choose. Further, this negative interaction may upset them in a way that mobilizes political participation. This is especially true for those who may have positive affect toward the police, as this experience runs counter to their prior evaluations. For those with more negative evaluations of the police or those viewing “light” contact as the product of a systematic pattern, light contact may not have any effect on the individual, as it only confirms what they already expect.
To test these expectations, we adopt two approaches. First, we turn to survey data to determine the generalizability of this pattern by analyzing the 2016 and 2018 Cooperative Election Studies (CES) and the 2016 American National Election Study (ANES) pilot study. Each asks about light contact with the police and political participation. We find that respondents who recently experienced light contact were more likely to engage in political action than those who did not.
To supplement this analysis, we fielded an original survey experiment that varies the level of light police contact that a respondent reads about experiencing and then measures their plans for future participation. We find that respondents stopped by the police report higher levels of intended participation. Further, we find that these effects are most pronounced among respondents who reported pretreatment favorable attitudes toward the police—and that they hold for White respondents, but not for Black respondents. In other words, those that are newly exposed to a more punitive side of law enforcement see a positive shift in projected participation—while those respondents who do not expect positive interactions are unfazed.
On the whole, these findings have important implications for our understanding of the political consequences of policing and, more broadly, the implications of government–citizen interactions. We show when and how light contact with the police in the United States meaningfully shapes political participation outside the realm of voting. Further, as the police are an arm of government, these findings have implications for our understanding of the ways in which citizen–government bureaucracies inform participation.
Police contact and political participation
Contact with the criminal justice system and the carceral state can vary widely: it can be personal (i.e., happen to the individual) or proximal (i.e., happen to a loved one) (Walker 2014; Reference Walker2019), and it can range in severity. The form and severity of contact inform the effects on political and civic participation. We first review the literature on harsh contact to develop a framework concerning light contact.
Harsh personal and proximal contact
Recent work on the link between harsh contact with the carceral state and political participation has exploded (for an overview, see: White Reference White2022). Most studies have focused on political participation as voting behavior, with the majority of studies finding descriptively that harsh contact with the criminal justice system is linked with decreased voting (Burch Reference Burch2011; Hjalmarsson and Lopez Reference Hjalmarsson and Lopez2010; Lerman and Weaver Reference Lerman and Weaver2014a; Owens and Walker Reference Owens and Walker2018; Uggen and Manza Reference Uggen and Manza2002; Weaver and Lerman Reference Weaver and Lerman2010; White Reference White2022) and is linked causally with declines in voting in the short term (White Reference White2019b), though others find that contact either has no causal effect on voting (Gerber et al. Reference Gerber, Huber, Meredith, Biggers and Hendry2017) or that there are mixed effects (Burch Reference Burch2011; Laniyonu Reference Laniyonu2019).
Less work has examined nonvoting forms of participation (White Reference White2022), despite the importance of understanding such participation, especially for subjugated groups (Owens and Walker Reference Owens and Walker2018; Soss and Weaver Reference Soss and Weaver2017). Weaver and Lerman (Reference Weaver and Lerman2010) and Lerman and Weaver (Reference Lerman and Weaver2014a) find that harsh, personal contact with the carceral state, such as arrests and incarceration, are linked with reductions in political participation beyond voting. Individuals experiencing harsh forms of contact such as arrest, convictions, or jail time are less likely to participate in political and civic life, and these demobilizing effects are exacerbated as the contact becomes more intrusive (Weaver and Lerman Reference Weaver and Lerman2010). This form of contact with the carceral state results in political alienation, mistrust, stigmatization, and a decline in social, political, and financial resources, which serve as additional barriers to participation (Frymer Reference Frymer2005; Gecas Reference Gecas1982; Lerman and Weaver Reference Lerman and Weaver2014a; Pager Reference Pager2003; Prowse et al. Reference Prowse, Weaver and Meares2020; Uggen et al. Reference Uggen, Manza and Thompson2006; Weaver and Lerman Reference Weaver and Lerman2010; Western Reference Western2006). However, Owens and Walker (Reference Owens and Walker2018) find that this connection can be interrupted when the individual with carceral state contact is part of civil society organizations. Further, Lerman and Weaver (Reference Lerman and Weaver2014b) find that police stops that feature searches or a high degree of force (harsh forms of contact) decrease neighborhood 311 calls (a form of civic engagement), while stops that do not have such features can increase such calls. Other work has found mixed evidence of the effect of policing on a willingness to call 911 (Cohen et al. Reference Cohen, Gunderson, Jackson, Zachary, Clark, Glynn and Owens2019; Desmond et al. Reference Desmond, Papachristos and Kirk2016; Zoorob Reference Zoorob2020).
Not only does harsh, personal contact with the police or carceral state shape political and civic participation, but so too does proximal contact. Proximal contact is contact with the police or carceral state that occurs to a loved one (e.g., a family member) (Walker 2014; Reference Walker2019). While personal, harsh contact leads to a direct stripping of resources and stigmatization, proximal contact may not. Nevertheless, watching a loved one experience such contact is a political learning moment (Lee et al. Reference Lee, Porter and Comfort2014). When people from minoritized groups see proximal contact as part of a larger system of oppression, they are mobilized to action (Walker 2014, 2019, Reference Walker2020). Individuals with proximal contact receive many of the same devaluing messages that those with direct contact do but lack many or all of the material constraints accompanying incarceration.
As such, proximal contact with the carceral state affects an individual’s willingness to participate in politics and the type of political engagement in which they take part. While proximal contact leads to (short term) declines in voter turnout (White Reference White2019a), it leads to increases in other forms of political participation (Anoll and Israel-Trummel Reference Anoll and Israel-Trummel2019; Walker 2014, Reference Walker2019). Further, when individuals with proximal contact view these encounters as a result of systematic discrimination (like racism), they can be politically mobilized in activities outside of voting (Gilmore Reference Gilmore2007; Miller Reference Miller2008; Walker 2014, Reference Walker2019). Walker (2014, 2019, Reference Walker2020) finds that non-Whites in particular can be motivated by proximal contact, as they know that their communities are targeted by police unjustly. Similarly, at the community level, Miller (Reference Miller2008) finds that poorer communities that experience crime (and policing) tend to vote at lower rates but participate more in ways that directly engage their local government. These patterns of nonvoting participation have been more generally documented: marginalized populations do not typically begin participating within the system that subjugates them, but instead, outside of it with protesting and other actions (Gillion Reference Gillion2013).
Light contact
We define “light contact” as interactions with the police that begin with a stop and end with a minor penalty, such as a citation. With this definition, light contact with the police shares elements of both personal and proximal contact. It is personal, in that it is occurring to the individual rather than to someone they know. However, because it is a minor interaction, it shares elements of proximal contact in that it does not strip the individual of significant resources: after receiving a traffic ticket, peoples’ lives are not necessarily upended, as they are when they are incarcerated. Even though police stops too often escalate and become violent or deadly, especially for Black people, our analysis centers on when they do not take this turn.
While much of the research on personal contact and political participation has understandably focused on harsher forms of contact like arrests, some studies incorporate lighter forms of contact in their analyses (Anoll et al. Reference Anoll, Epp and Israel-Trummel2022; Drakulich et al. Reference Drakulich, Hagan, Johnson and Wozniak2017; Walker Reference Walker2014; Weaver and Lerman Reference Weaver and Lerman2010). Weaver and Lerman (Reference Weaver and Lerman2010) find that being questioned by the police (which is the lightest form of contact measured) actually has a positive effect on other forms of political participation and a negative effect on trust in government. This finding runs counter to their theory, and they note that it could be due to a small sample size. Similarly, in a portion of her analysis concerning personal police contact, Walker (Reference Walker2014) uncovers an unexpected mobilizing effect for political participation outside the realm of voting. She suspects that this mobilizing effect could be due to the specific measure of contact that she employs—as it includes lighter contact like being questioned or stopped by the police. Most recently, Anoll et al. (Reference Anoll, Epp and Israel-Trummel2022) find a positive relationship between stop history and political participation, which they also characterize as surprising and counter to their expectations. It is possible that all three of these studies run into issues of measurement and sample size. However, it is also possible that these findings point to the notion that light contact is a substantively different, yet politically important, form of contact with the police. Perhaps at lower levels of contact, a negative interaction with the police, even when it is a personal interaction, can mobilize political participation. This is supported by Drakulich et al. (Reference Drakulich, Hagan, Johnson and Wozniak2017), who find that being stopped by the police can motivate political participation, as a consequence of a broader increase in political engagement, while experiencing incarceration demobilizes participation.
Less intrusive kinds of contact with the police, like receiving a traffic ticket, differ from harsher forms of contact. If we conceive of light contact as a brief, one-time, common interaction, it would likely neither result in the kind of deep political alienation that occurs after harsh contact with the police nor carry the social stigma that harsh contact does. Further, while light contact may have short-term effects on resources (e.g., a fine), it does not strip people of political, social, and financial resources in the same ways that harsh contact does. Ultimately, after receiving something like a traffic ticket, the individual is still free, can still vote, and often only has to pay a one-time fine.
However, contact with the police tends to be more memorable when it is negative (Skogan Reference Skogan2006), which is often the case (Brunson and Weitzer Reference Brunson and Weitzer2009; Voigt et al. Reference Voigt, Camp, Prabhakaran, Hamilton, Hetey, Griffiths, Jurgens, Jurafsky and Eberhardt2017; Weitzer and Tuch Reference Weitzer and Tuch2006; White et al. Reference White, Cox and Basehart1991). Skogan (Reference Skogan2006) finds that police interactions seen as fair often do not affect police evaluations, while those deemed unfair significantly depress evaluations of the police—which is in line with the procedural justice literature that finds the legitimacy of the police is heavily dependent on perceptions of fairness (Belvedere et al. Reference Belvedere, Worrall and Tibbetts2005; Justice and Meares Reference Justice and Meares2014; Meares Reference Meares2015, Reference Meares2016; Snow Reference Snow2019; Sunshine and Tyler Reference Sunshine and Tyler2003; Tyler Reference Tyler2006; Reference Tyler2011; Tyler and Fagan Reference Tyler and Fagan2008; Tyler and Huo Reference Tyler and Huo2002). During focus groups, Snow (Reference Snow2019) found that participants who recently received traffic tickets were unlikely to see their own behavior as problematic—and instead, very likely to see the behavior of the agency issuing the penalty as unjust. Even when participants recognized that they did break the law, it was often considered a “technicality” that did not undermine their law-abiding identity (Snow Reference Snow2019, pp.148–9). A minor, negative interaction with the police, then, may upset individuals without inducing deep alienation or a substantial reduction in resources—thus mobilizing individuals to political action. This leads to the first hypothesis:
Hypothesis 1: People who receive a traffic ticket will participate in more political action.
Sometimes “light” contact may not be seen as unobtrusive, though. When people see this light form of contact as connected to a broader system of oppression that marginalizes them and their racial group, it could produce or reinforce political alienation. Thus, an individual’s reaction to light contact with the police may depend on their previous contact with police, perceptions of the police, and/or expectations for such an encounter.
While encountering information that contradicts prior beliefs is often disregarded, rated as lower quality, or elicits motivated reasoning that results in reinforcing rather than updating prior beliefs (Lodge and Taber Reference Lodge and Taber2013; Lord et al. Reference Lord, Ross and Lepper1979; Taber and Lodge Reference Taber and Lodge2006), there are some circumstances in which individuals can and do update their beliefs—and, more often, their behavior. Circumstances where individuals live through an encounter—or are forced imagine themselves living through an encounter—that runs counter to their expectations may be particularly influential. A key example of this is in reducing prejudice (for an overview, see Paluck et al. Reference Paluck, Porat, Clark and Green2020). In this context, people who have direct interactions with (or who are asked to imagine such interactions with) someone previously seen as “other” (e.g., someone of a different race) come to engage in less prejudiced behavior. In the face of repeated or particularly strong evidence, people can come to update their beliefs and behavior (Garrett Reference Garrett2017; Redlawsk et al. Reference Redlawsk, Civettini and Emmerson2010; Steffens et al. Reference Steffens, Weeks, Davidsson and Isaak2014).
In the context of policing, this means that experiencing an interaction with the police that runs counter to expectations will bring new, experiential information which could lead to behavioral shifts. For people who believe that the police serve and protect them, having a negative interaction, even if minor, may be particularly upsetting. Dissatisfaction from the mismatch between expectations and reality may then mobilize them to take political action. However, for people who do not expect positive interactions with the police, a minor (negative) interaction with the police may be either in line with their expectations or, at times, even a better outcome than they may have expected. Thus, these individuals will not be particularly upset or mobilized. This expectation leads to the next hypothesis:
Hypothesis 2: Individuals with positive perceptions of the police who receive a traffic ticket will participate in more political action than those with negative perceptions of the police.
As the police in the U.S. target Black and racially minoritized populations more than their White counterparts (Gelman et al. Reference Gelman, Fagan and Kiss2007; Mummolo Reference Mummolo2018), including during traffic stops (Baumgartner et al. Reference Baumgartner, Epp and Shoub2018; Christiani Reference Christiani2021; Fagan and Davies Reference Fagan and Davies2000; Fagan et al. Reference Fagan, Geller, Davies and West2010), public perceptions of the police understandably differ wildly by race (Hurwitz and Peffley Reference Hurwitz and Peffley2005; Jefferson et al. Reference Jefferson, Neuner and Pasek2020; Weitzer and Tuch Reference Weitzer and Tuch2004). White people tend to expect that the police will serve and protect, but Black people do not (Brunson Reference Brunson2007; Hurwitz and Peffley Reference Hurwitz and Peffley2005; Jones Reference Jones2014; Weitzer and Tuch Reference Weitzer and Tuch2005). Thus, the fact that these light interactions have political effects that depend on the individual’s perception of the police imply that they will tend to differ by race as well. White people, who tend to expect positive police interactions, may find even a minor negative police interaction bothersome, upsetting, or angering, as it runs counter to their expectations for such interactions (Suhay and Erisen Reference Suhay and Erisen2018) and consequently be mobilized. Black people, who do not have such hopeful expectations, may not feel as conflicted as Whites after experiencing a negative encounter with the police, as the experience does not run counter to their prior expectations. This leads to the final hypothesis:
Hypothesis 3: White people with positive perceptions of the police who receive a traffic ticket will participate in more political action than Black people.
Analytic strategy
To test these hypotheses, we proceed in three steps. First, we test whether people who receive a traffic ticket (a light form of police contact) participate in politics more often using three nationally representative surveys conducted in two different years (Study 1). While this provides generalizability for the first hypothesis, the design of these surveys is insufficient to test the sequencing implied by the second and third hypotheses, centering on evaluations prior to a police interaction. For this, we turn to a unique survey experiment, where respondents read a vignette in second person about a police interaction (Study 2). With this, we test whether light contact is mobilizing (hypothesis 1), whether prior perceptions of the police moderate this effect (hypothesis 2), and for heterogeneity by race (hypothesis 3).
Study 1: Evidence from the CCES and ANES
Few surveys ask respondents about their interactions with the police and the criminal justice system—especially minimally intrusive ones—alongside their civic participation. Three exceptions to this are: the 2016 and 2018 CCES, Footnote 1 which asks respondents whether they recently received a traffic ticket, and the 2016 ANES pilot, Footnote 2 which asks respondents whether they were stopped or questioned by the police. Footnote 3 Note that we follow Drakulich et al. (Reference Drakulich, Hagan, Johnson and Wozniak2017) in using the 2016 ANES pilot, but we expand the types of political participation that we analyze beyond voting. Using these surveys, we can investigate whether there is a statistical link between light contact with the police and political participation in the general population.
The key independent variables are whether a respondent experienced a small, negative interaction with the law. In the CCES, this is measured as receiving a traffic ticket. In both 2016 and 2018, the CCES asked respondents whether they had recently received a traffic ticket or citation. Footnote 4 In the 2016 ANES pilot, half of the respondents were asked whether they had been stopped or questioned by the police in the past 12 months. While there are key differences in these questions—the ANES specifies an individual interacted with an officer and spans a broader range of outcomes—each captures whether individuals had some kind of light police contact.
To measure political and civic participation, we examine whether respondents participated in a range of activities. In the CCES, respondents are asked whether they participated in these activities in the preceding year, which is in line with previous studies (e.g., Walker 2014; Reference Walker2019). Footnote 5 Both the 2016 and 2018 CCES asked whether respondents: (1) attended a local political meeting, (2) put up a political sign, (3) worked for a candidate or campaign, or (4) donated money to a candidate or campaign or political organization. Footnote 6 From these responses, we construct a measure of political participation by counting how many activities the respondent had engaged in: in 2016, there is a mean response of .57, while in 2018, there is a mean response of .60. In the 2016 ANES pilot, respondents were asked about whether they participated in a range of activities over varying timelines, including past and future (planned) participation. Because the independent variable asks about whether respondents were stopped or questioned by the police in the past 12 months, and we expect that police contact precedes political participation, we take advantage of the fact that the pilot asks about plans for future participation. Respondents are asked whether they plan to (1) attend a meeting to talk about political or social concerns, (2) give money to an organization, or (3) distribute information related to a political/social interest group. We combine these items into a scale of political participation by counting the number of activities a respondent is “very likely” or “extremely likely” to participate in, which aligns with our CCES measures.
Analysis
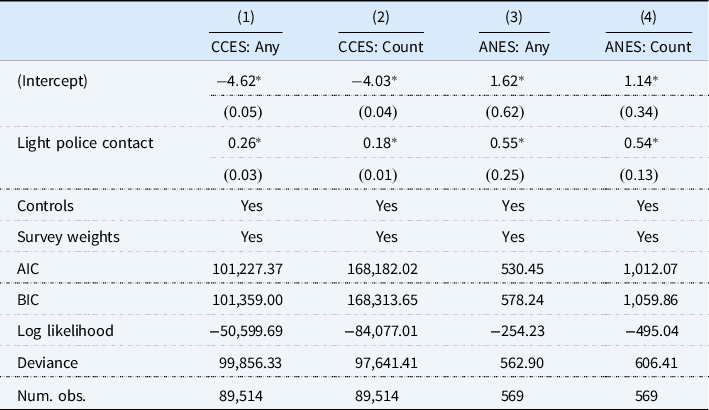
Using these data, we specify models to estimate (1) whether the individual engaged in any action using a logistic regression, and (2) the number of activities in which an individual participated using a Poisson regression. In the CCES models, the data from both surveys is pooled, and a fixed effect for year is included. Table 1 presents the results of these models with key variables; the full models with controls are presented in the appendix.
Explaining political and civic participation

 $^*p \lt 0.05$
. Controls include race, gender, education level, income, party affiliation, political interest, religiosity, and age.
Across all models, there is a positive and statistically significant link between light police contact and political participation. Respondents who received traffic tickets are also more likely to have engaged in activities in the past 12 months (CCES models) and respondents who were stopped or questioned by the police are more likely to engage in activities in the future (ANES models). This relationship holds when the models are disaggregated by year (for the CCES), when individual forms of participation are examined separately, and when the dependent variables for the ANES are left as scales—all analyses are reported in the online appendix.
Additionally, we estimate and examine models with an interaction between light contact and race of the respondent, which are presented in the appendix. On the whole, they do not provide evidence for the hypothesis that light contact mobilizes White people more than Black people, as the interaction term is statistically insignificant. As we theorize that it is the intersection of prior positive evaluations, race, and contact that may produce heterogeneous differences, this does not directly contradict our hypotheses, but it does raise interesting questions for future studies.
These tests reveal a statistical link between light police contact and political mobilization across multiple years. However, there remain questions as to whether this relationship is causal and about the potential mechanism producing this effect. The ANES analysis gets closer to modeling the directional nature of the first hypothesis, as police contact is measured within the last year but political participation is measured as plans for the future, but the CCES measures these simultaneously. Further, these data do not allow for a test of the causal mechanism, as prior evaluations of the police would need to be measured before interaction with the police. To examine these questions, we turn to an original survey experiment.
Study 2: Experimental evidence
To better unpack the relationship between light police contact and participation, we fielded a survey experiment in June 2020 with the survey firm Lucid. Lucid is an online survey aggregator, and its samples have been demonstrated to track well with U.S. national benchmarks and suitable for experimental research (Coppock and McClellan Reference Coppock and McClellan2019). Respondents answered pretreatment items, then read a short vignette, and finally answered dependent variables about their plans to participate. The experiment randomly assigned respondents to one of three conditions. They were told: “Now, we’re going to ask you to participate in an exercise. Imagine you’re experiencing the following scenario. Then, let us know what you think about what happened to you.” The conditions were as follows:
-
Control Condition: You are driving to the grocery store. You look down and notice that you are almost out of gas. The light for “empty” just came on. So, you decide to stop at the gas station. When you get there, you get out of the car and pay to fill up your gas tank. Several minutes pass as you pump the gas. Eventually, when your tank is full, you get your receipt and get back into your car. You turn your car on and notice that the “empty” light is off and now your gas tank is full. You continue driving to the store, where you find most of the things on your list. You check out and head home.
-
Ticket Treatment: You are driving to the grocery store. Behind you, you see flashing red and blue lights. A police officer is pulling you over, so you pull to the side of the road. The police officer in uniform comes up to your car window and asks for your driver’s license and vehicle registration without telling you anything else. You give these to him, and then he returns to his vehicle. Several minutes pass as you wait in your car. Eventually, the officer approaches your car again. He tells you that you were driving 10 miles over the speed limit. Then, he returns your license and registration—and he writes you a $150 ticket for speeding. You continue driving to the store, where you find most of the things on your list. You check out and head home.
-
Search Treatment: You are driving to the grocery store. Behind you, you see flashing red and blue lights. A police officer is pulling you over, so you pull to the side of the road. The police officer in uniform comes up to your car window and asks for your driver’s license and vehicle registration without telling you anything else. You give these to him, and then he returns to his vehicle. Several minutes pass as you wait in your car. Eventually, the officer approaches your car again. He asks you to step out of the car and you agree, getting out of your vehicle. While you are waiting on the side of the road, the officer searches your car—the interior and the trunk. He does not find anything in his search. He tells you that you were driving 10 miles over the speed limit. Then, he returns your license and registration—and he writes you a $150 ticket for speeding. You continue driving to the store, where you find most of the things on your list. You check out and head home.
Both treatments are considered light contact by our technical definition, as the interaction with the police officer ends with a ticket. However, it is clear that the search condition is considerably harsher than the ticket condition. In the search condition, the individual is subject to a search (which could be construed as illegal and/or unfair since we do not specify that the driver gave their consent). Such a procedure is invasive and, especially if it is part of a pattern of police targeting based on the individual’s identity, is likely to be a traumatic experience. Nevertheless, when compared with previous research, this condition is not as harsh as being arrested, spending time in jail, being convicted, or being incarcerated—as a search ending in a ticket does not significantly strip individuals of resources, convey a criminal record, or carry the same level of stigma as harsher forms of contact. So, when compared to types of contact with the carceral state that have often been previously examined, it is not quite as harsh, while we recognize that it may not be uniformly “light,” especially for Black people and others whose communities experience regular police targeting.
Thus, we have three conditions. The ticket condition contains the lightest amount of police contact. The search condition contains harsher contact than the ticket condition, but lighter contact than previous work has typically examined, and a control condition, which mirrors the treatment closely, as the respondent still stops on their way to the store (i.e., an unplanned interruption) but does not include any police contact. Note that both treatments are relatively gentle: they do not use emotional language, the interaction itself is basic and quick, and the officer is not explicitly rude. As a result, detecting a statistically significant relationship may be difficult.
Before the vignette, respondents relayed information on how warmly (or coldly) they felt toward various groups, institutions, and professions, including the police, which allows us to capture the respondent’s general affect toward the police and test whether it conditions the treatment effects. Their rating of the police was randomized among 14 total groups to limit the extent to which respondents were primed to think about the police prior to the experiment. We rescaled this thermometer to run from 0 (very cold) to 1 (very warm). In the sample, the median rating for the police was .61 with a standard deviation of .32.
Following the experimental vignette, respondents indicated how likely (or unlikely) they are to participate in a range of political activities in the future—in other words, their intention to participate, which is part of the behavioral chain (Bagozzi et al. Reference Bagozzi, Baumgartner and Yi1989; Kim and Hunter Reference Kim and Hunter1993a, Reference Kim and Hunter1993b; Randall and Wolff Reference Randall and Wolff1994). We count the number of political activities the respondent says they are likely or very likely to do, following Walker (2014, Reference Walker2019). To make this study comparable to the CCES analysis, we focus on the same four activities: sign a petition online, donate money, attend a (virtual) town hall or meeting, and work for a candidate or campaign. Footnote 7 Five hundred and fifty-three respondents (about 56%) said that they intended to participate in at least one activity.
At its close, 1,058 participants fully completed the survey. Of those, 984 participants completed the survey within a reasonable time span and provided quality responses. Footnote 8 Because Black people are treated more harshly by the police than White people on average, we designed the sample to be approximately evenly split between Black and White respondents (441 and 543, respectively) and—within each group—to match national distributions on age and gender. The full set of descriptive statistics can be found in the appendix.
Analysis
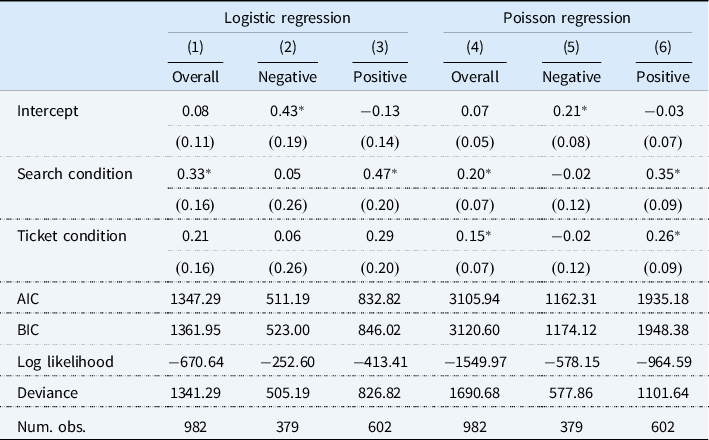
We again specify two models: (1) a logistic regression predicting any form of intended participation and (2) a Poisson regression predicting the number of intended participatory activities. These models are specified for the whole sample and by the respondent’s evaluation of the police. Respondents with evaluations of the police of .5 (on the 0–1 thermometer scale) or lower are coded as having negative views, while those with evaluations of .51 or higher are coded as rating the police positively. The results are reported in Table 2.
Average treatment effects on intended political participation

 $^*p \lt 0.05$
. Activities include sign a petition, work for candidate, donate to a campaign, and attend a meeting.
Models 1 and 4 in Table 2 report the effects of the treatment on intended participation in the entire sample. Those exposed to the search condition were more likely to report planning to participate (
 $\beta $
= .33 and
 $\beta $
= .20, respectively). Model 4 shows that people in the ticket condition have higher levels of participation as well (
 $\beta $
= .15), lending support for the first hypothesis. The ticket condition is not statistically significant in the logistic regression predicting whether respondents will participate, though the coefficient is in the expected direction.
The other models split the sample by pretreatment evaluations of the police. Respondents with positive prior evaluations of the police are clearly driving the overall effects detected in Models 1 and 4. In the logistic regression, the coefficient for the search condition is larger in magnitude for those who had positive evaluations of the police (
 $\beta $
= .47) than in the overall models, while the relationship is statistically insignificant for those with negative prior evaluations of the police. In the Poisson regressions, the effects are again isolated to those respondents with positive prior evaluations of the police, and, again, the effect for those with positive prior evaluations is larger than the effect detected in the overall sample (
 $\beta $
= .35 for the search condition and
 $\beta $
= .26 for the ticket condition), which is evidence for the second hypothesis.
The findings from the Lucid sample corroborate those detected in the CCES and ANES samples. Further, they provide support for our second hypothesis that those who have positive evaluations of the police likely do not expect negative interactions, like those with more negative evaluations do. This disconnect from their prior evaluations appears to be one mechanism by which light contact mobilizes political participation for some.
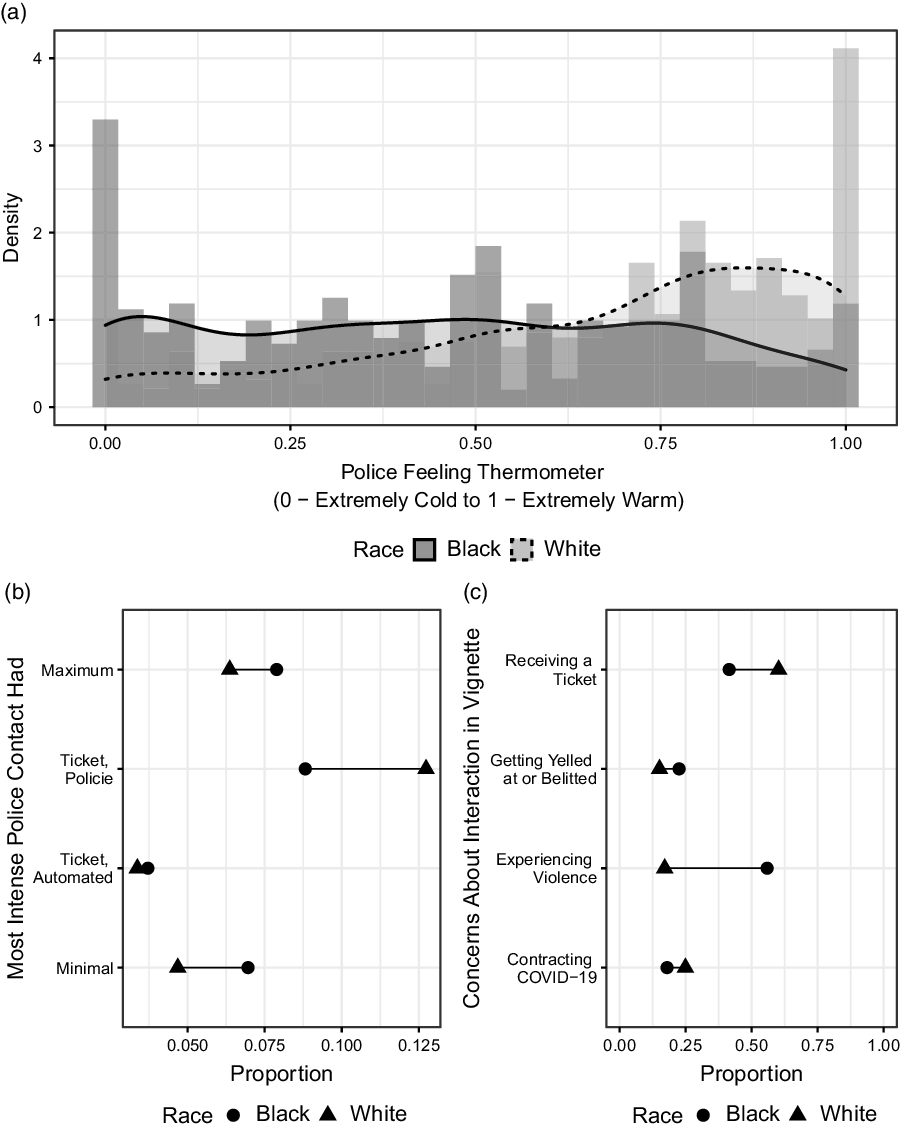
The third hypothesis posed that prior evaluations of the police will have stronger effects on motivating political participation among White respondents, compared with Black respondents—as we expect that White and Black respondents have different prior experiences with and expectations for the police. Before testing for heterogeneity in treatment effects, we descriptively explore differences in attitudes about the police, rates of police contact, and concerns following the hypothetical police interaction by respondent race. Figure 1(a) plots the distribution of feeling thermometer scores toward the police among White and Black respondents. On average, White respondents rate the police much more warmly (mean = .66) than Black respondents (mean = .45), but there is significant within-race variation, especially among Black respondents, in evaluations of the police.
Differences in attitudes about the police, rates of police contact, and concerns during a (hypothetical) police interaction by respondent race
Note: Subfigure a is a density plot of responses to the police feeling thermometer by respondent race. Subfigure b shows the proportion White and Black respondents that have ever had direct contact with the police or prison system by the most intensive form of contact reported. Maximum contact is defined as being searched, arrested, or incarcerated. Minimal contact is defined as being pulled over (but not ticketed) or questioned by the police. Subgfiure c shows the proportion of White and Black respondents from either treatment group that said they were “concerned about during [their] interaction with the officer.”

Further, there are differences in actual police contact and concerns about the police interaction from the vignette (Figures 1(b) and (c) respectively). Prior research shows that Black people tend to have more negative experiences with the police than White people—and this is evident in the Lucid survey as well. We asked respondents if they had ever had direct contact with the police or prison system, and about their most recent form of contact. Using information from both responses, we calculate the proportion of respondents who came into contact with the police in the last year conditioned by their most intense form of police contact had, shown in Figure 1(b). White respondents only report greater contact with respect to ticketing done by police officers, while Black respondents report greater rates of police contact of all other forms, such as being arrested (i.e., maximally intensive contact)—corroborating previous findings (Baumgartner et al. Reference Baumgartner, Epp and Shoub2018; Epp et al. Reference Epp, Maynard-Moody and Haider-Markel2014). This shows that Black respondents in our sample have had more negative past experiences with the police.
Finally, we have suggested that White and Black people hold drastically different expectations for interactions with the police. To examine this, we asked respondents what they were concerned about during their interaction with the officer, if anything: contracting COVID-19 (the corona virus); receiving a ticket; experiencing violence from the police officer; getting yelled at or belittled by the police officer; or nothing. Figure 1(c) plots the differences in proportion, by race, for each concern. Again, we observe expected differences in respondent concerns: White respondents were more concerned about receiving a ticket, while Black respondents were concerned about much more dire outcomes—getting yelled at, belittled, or experiencing violence. These descriptive patterns match prior research and the what we have contended in this article: White and Black people have vastly different outlooks on and experiences with the police.
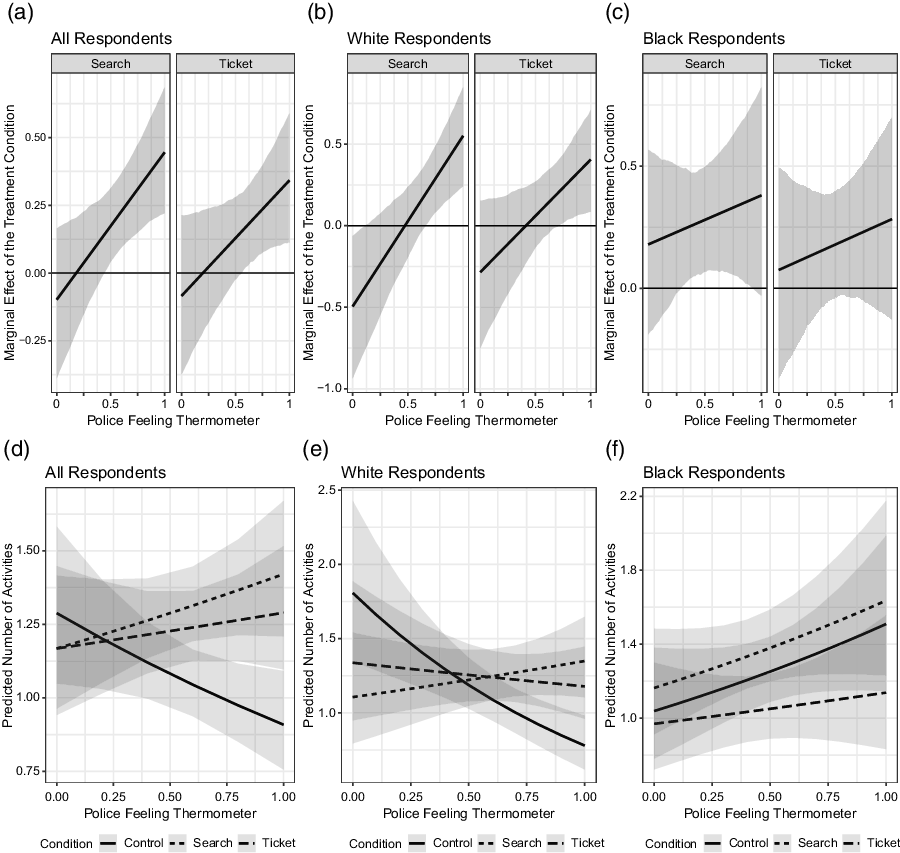
To formally test the third hypothesis, we interact the treatment condition indicators with feelings about the police and fit separate regressions by respondent race. As the key relationship of interest is an interaction, we present our findings as a series of figures rather than as a regression table (Figure 2; see the online appendix for the regression tables). We plot the marginal effect of the treatment, across the full range of pretreatment feeling thermometer scores toward the police, on the top row (Figure 2(a), (b), and (c)). The bottom row plots the predicted number of activities a respondent planned to engage in, by treatment condition and police feeling thermometer (Figure 2(d), (e), and (f)).
Examining the moderation of treatment effects by warmth of feelings toward the police and by race
Note: Results in each subfigure come from three Poisson regression models, each explaining the number of activities a respondent intends to engage in in the coming year and includes an interaction between a feelings toward the police (0—cool to 1—warm) and treatment. The first model includes all respondents, the second includes White respondents only, and the third includes Black respondents only. These regressions are shown in the appendix. Subfigures a, b, and c show the marginal effect of the given treatment (compared with the control condition), with 95% confidence intervals represented in gray, on the number of activities. Subfigures d, e, and f show the predicted number of activities on average based on the treatment or control condition and across the range of the police feeling thermometer.

Figure 2 shows that, while feelings about the police moderate the effect of light police contact, this relationship is actually contained to White respondents—lending evidence for the third hypothesis. When decomposed by race, this effect is not statistically significantly different from zero at the 95% confidence level for Black respondents. For White respondents, prior positive affect toward the police sees light contact inducing intention to participate.
Further, subfigures 2(e) and (f) show that the treatment reverses the relationship between police affect and political participation for White—but not Black—respondents. For White respondents in the control condition, more positive feelings toward the police are linked with less political participation. When these White respondents hypothetically experience light, negative contact from the police, positive feelings about the police are linked to a modest but detectable increase in political participation. For Black respondents, affect toward the police is always positively linked with participation, regardless of the treatment condition.
One concern with this experiment—especially with respect to reactions by White respondents—is that the timing of the survey may have biased our results, as it was fielded in June 2020, during the racial justice protests in response to the police killing of George Floyd. To this end, we test whether attitudes about other prominent figures (i.e., then-President Donald Trump), societal groups (i.e., Black Americans), or the George Floyd protests moderate the observed relationship, as one might suspect that feelings toward the police are simply part of a broader change in political attitudes rather than specific attitudes truly about the police. We find no evidence for the effect of these moderators, which indicates that we are detecting something distinct (see online appendix for analysis).
Further, we consider whether if one interacts with a group that they have a positive affinity toward, here the police, which are an arm of government, then they are primed to think better of or produce a positive affect toward the government more broadly. In turn, this may motivate greater participation—especially during a period where they may feel that an institution or group they approve of is under attack as they may have during the period this survey was fielded. This stands in contrast to our proposed pathway linking light contact with political participation as a result of becoming upset (but not entirely alienated). We find no evidence that the treatment affected attitudes about trust in government more broadly. All additional analyses are reported in the appendix. Together, these results provide additional evidence that our main results are linked to feelings about the police rather than motivated by key pieces of the surrounding context (e.g., BLM, Trump, etc.), and that our experiment did not appear to activate a broader rallying effect for government.
In sum, perceptions of the police can moderate the effect of light contact on political participation—especially, for White respondents. White people do not experience police targeting based on their race and have more positive affect toward the police. Usually, this leads to less participation—but in the face of light, negative, police encounters, it can mobilize action.
Discussion
Light contact is different from harsh personal contact as it does not significantly strip the individual of social or political resources. However, that does not mean that light contact with the police does not have important implications for political behavior outside the realm of voting. Instead, these light encounters can have effects on nonvoting forms of participation. The way that those effects are born out, especially by race, illuminates the role and expectations that different groups of people have for the police.
From three sets of data, we see evidence that light contact with the police does have political consequences. Analyses of observational survey data form the CCES (2016 and 2018) and ANES (2016) showed that light contact with the police is linked with increased political participation. A survey experiment replicated these findings and demonstrated one mechanism at work: prior evaluations of the police. Reading about receiving a ticket has mobilizing effects on intended participation, especially for those who previously felt warmly toward the police. It also demonstrated that there was no equivalent effect for respondents with a more negative affect toward police. These effects were most pronounced for White respondents than Black respondents. Finally, it demonstrated that the form of contact mattered in that the search condition tended to produce stronger increases in participation than the ticket condition. This could be due to the nature of the experimental context, where the search vignette was likely stronger in grabbing respondents’ attention and producing differences in their planned behavior—but it may point to participatory differences that emerge more strongly for fruitless searches than for tickets. Future work should continue to examine these differences.
While this analysis uncovered one mechanism driving these effects, more work could be done in the future to unpack other potential drivers of this relationship. For example, it could also be that when people feel that their government will be responsive to them, they are more likely to participate following a negative encounter with one arm of government (law enforcement). This mechanism is not divorced from the one we test here, but this kind of political efficacy may be an alternate route through which light police contact can also mobilize action.
Our findings have implications for a number of literatures. First, this study contributes to the growing literature on policing and politics in the United States. Previously, this work has often focused on the harshest forms of contact—for understandable reasons, as these forms of contact are the most troubling and influential (Anoll and Israel-Trummel Reference Anoll and Israel-Trummel2019; Lerman and Weaver Reference Lerman and Weaver2014a; Walker 2014, Reference Walker2019; Weaver and Lerman Reference Weaver and Lerman2010; White Reference White2019a). Here, we look at lighter, more common experiences to explore the way that everyday interactions with the police may affect individuals. In doing so, we speak to the political consequences of everyday interactions and uncover the ways that such effects depend on prior evaluations of the police. However, these results also raise a number questions for this space, such as at what point and under what conditions does contact shift from mobilizing to demobilizing (i.e., what is the “tipping point”?), and how different forms of contact relate to each other and participation. That is, it could be that there are different consequences on participation that result from contact depending on the entity (e.g., police, court system, type of court, etc.).
Similarly, as the police are one type of bureaucracy that regularly interacts with the public, these findings contribute to our broader understanding of how interaction with government shapes future political and civic participation. Individuals take lessons from their interactions with the government. As most people do not have regular contact with the federal government, they learn about government more broadly from the local functions, policies, and agencies that they do interact with (Lawless and Fox Reference Lawless and Fox2001; Mettler et al. Reference Mettler2005; Schneider and Ingram Reference Schneider and Ingram1997; Schneider and Ingram Reference Schneider and Ingram1993; Soss Reference Soss1999a; Watson Reference Watson2015). Certain policies send the message to citizens that they are deserving and that their voice is valued, while others reinforce marginality (Mettler et al. Reference Mettler2005; Schneider and Ingram Reference Schneider and Ingram1997; Schneider and Ingram Reference Schneider and Ingram1993; Soss Reference Soss1999a, Reference Soss1999b)—and such messages have implications for political efficacy and participation (Mettler and Stonecash Reference Mettler and Stonecash2008; Meyer Reference Meyer1996; Orloff Reference Orloff1993; Skocpol Reference Skocpol1991; Watson Reference Watson2015). While this study clarifies one way in which bureaucratic contact can mobilize participation, it raises new questions for this space, such whether the entity initiating contact (i.e., the citizen or bureaucrat) alters the relationship between contact and participation and engagement.
Finally, this piece contributes to the robust literature on race, ethnicity, and politics by adding to our understanding of how racial hierarchies and individuals’ own positionalities within that hierarchy shapes perceptions, interactions, and participation in fundamental ways (e.g., Bonilla-Silva Reference Bonilla-Silva1997; Crenshaw Reference Crenshaw1989; Kim Reference Kim2000; Omi and Winant Reference Omi and Winant2014). Interactions with the police do not occur in a vacuum, divorced from these forces (Epp et al. Reference Epp, Maynard-Moody and Haider-Markel2014; Lerman and Weaver Reference Lerman and Weaver2014a; Weaver and Lerman Reference Weaver and Lerman2010). Instead, the social construction of race, racialized experiences, power, and privilege shape every interaction. These findings dovetail with recent work that has illustrated, in part, the way that anger can mobilize individuals in privileged positions to a larger degree than those in marginalized groups (Phoenix Reference Phoenix2019; Phoenix and Arora Reference Phoenix and Arora2018), and underscores the need for additional work to be done to understand what else may moderate the connection between contact and participation, such as one’s perceptions of their own law abidance and their previous contacts with the criminal justice system.
Routine but involuntary interactions with the police occur daily with about one-fifth of the U.S. population over the age of 16 having received at least 1 traffic ticket in the last 5 years. Footnote 9 Understanding the political implications of these common forms of interaction with the government is crucial. As a final note: while traffic stops are often routine and relatively unobtrusive interactions, we also must acknowledge and hold space for when minor stops turn deadly. Sandra Bland, Philando Castile, and Walter Scott are three prominent examples of Black people who died as a result of police interactions that began with a minor traffic stop. While these encounters are often routine and unobtrusive, there are times, for Black people, when they are not.
Supplementary material
To view supplementary material for this article, please visit https://doi.org/10.1017/rep.2022.18