





1. The Gaia mission: products and caveats
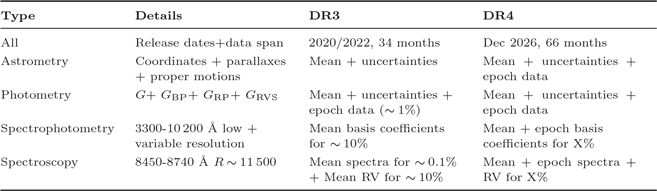
The Gaia mission (Prusti et al. Reference Prusti2016) took data for ten and a half years from 24 July 2014 to 15 January 2025, yielding the most complete ever high-dynamic-range, astrometric+photometric+spectroscopic survey of the whole sky. The third data release (DR3) took place in two phases in 2020 and 2022 (Brown et al. Reference Brown2021; Vallenari et al. Reference Vallenari2023) and the next and fourth one (DR4) is expected to take place in December 2026Footnote 1. Table 1 summarizes the different data products available in DR3 and DR4. In this section we describe the characteristics and caveats of the different types.
Summary of Gaia data products for DR3 and DR4.

Table 1 Long description
A table comparing Gaia data products for DR3 and DR4. The table has 5 rows and 4 columns. Column headers are Type, Details, DR3, and DR4. Row 1: Type, Details, DR3, DR4. Row 2: All, Release dates+data span, 2020/2022, 34 months, Dec 2026, 66 months. Row 3: Astrometry, Coordinates + parallaxes + proper motions, Mean + uncertainties, Mean + uncertainties + epoch data. Row 4: Photometry, G+ G_BP+ G_RP+ G_RVS, Mean + uncertainties + epoch data (~1 percent), Mean + uncertainties + epoch data. Row 5: Spectrophotometry, 3300-10200 Å low + variable resolution, Mean basis coefficients for ~10 percent, Mean + epoch basis coefficients for X percent. Row 6: Spectroscopy, 8450-8740 Å R ~ 11500, Mean spectra for ~0.1 percent + Mean RV for ~10 percent, Mean + epoch spectra + RV for X percent.
1.1. Astrometry
Gaia DR3 astrometry is described in Lindegren et al. (Reference Lindegren2021b); Lindegren et al. (Reference Lindegren2021a) as part of the “official” early-DR3 (EDR3) papers from DPAC (Gaia Data Processing and Analysis ConsortiumFootnote 2). Further contributions from Cantat-Gaudin & Brandt (Reference Cantat-Gaudin and Brandt2021); Maíz Apellániz et al. (Reference Maíz Apellániz2021); Maíz Apellániz (Reference Maíz Apellániz2022) have expanded and refined that analysis. The most important points that need to be considered for DR3 astrometry are:
-
• Distances depend on the chosen prior (Maíz Apellániz Reference Maíz Apellániz2005; Luri et al. Reference Luri2018). The commonly used Bailer-Jones et al. (Reference Bailer-Jones2021) distances assume an underlying spatial distribution for low- and intermediate-mass stars. Pantaleoni González et al. (Reference Pantaleoni González2025) instead assumes a spatial distribution for Galactic OB stars (Maíz Apellániz Reference Maíz Apellániz2001; Maíz Apellániz et al. Reference Maíz Apellániz2008).
-
• Catalog parallaxes require a zero point correction (Lindegren et al. Reference Lindegren2021a; Maíz Apellániz Reference Maíz Apellániz2022). Cantat-Gaudin & Brandt (Reference Cantat-Gaudin and Brandt2021) derive a similar correction for proper motions.
-
• Catalog (or internal) parallax uncertainties are underestimated by up to a factor of three (Fabricius et al. Reference Fabricius2021; Maíz Apellániz Reference Maíz Apellániz2022, see also https://www.cosmos.esa.int/documents/29201/1770596/Lindegren_GaiaDR2_Astrometry_extended.pdf).
-
• There is a residual systematic uncertainty (
 $\sigma_{\rm s} = 10.3\;\mu$as) that yields a minimum uncertainty for distances of $\approx d\%$, where d is the distance in kpc (Maíz Apellániz et al. Reference Maíz Apellániz2021).
-
• The residual systematic uncertainty has an angular correlation (Lindegren et al. Reference Lindegren2018; Maíz Apellániz et al. Reference Maíz Apellániz2021).
-
• Poor-quality data (RUWE
$\gt$ 1.4 or six-parameter solutions) can still be used with a larger uncertainty (Maíz Apellániz Reference Maíz Apellániz2022).


1.2. Photometry
Gaia DR3 photometry is described in Riello et al. (Reference Riello2021) as part of the DPAC papers. In Maíz Apellániz & Weiler (Reference Maíz Apellániz and Weiler2025) we reanalyse it and provide a model to use it when comparing to synthetic photometry:
• Gaia optical photometry is unparalleled in coverage, dynamic range and uniformity but the passbands have evolved with each data release (from DR1 to DR3 and likely DR4, see Maíz Apellániz Reference Maíz Apellániz2017; Maíz Apellániz & Weiler Reference Maíz Apellániz and Weiler2018) likely as a result of water deposition in optical surfaces at the beginning of the mission (Prusti et al. Reference Prusti2016) and differences in processing between data releases.
-
• G catalog magnitudes require a correction.
-
• G magnitudes in DR2 and DR3 require two different passbands with a cutoff at
${G} = 13.0$ and $G_{\rm BP}$ and $G_{\rm RP}$ magnitudes require two different passbands in DR2 with a cutoff at ${G} = 10.87$. This is likely a result of the electronic gate-based data processing (Prusti et al. Reference Prusti2016). -
• If the Maíz Apellániz & Weiler (Reference Maíz Apellániz and Weiler2025) procedure is followed it is possible to attain an absolute calibration between 3.4 and 5.7 mmag for Gaia DR3 photometry.


1.3. Spectrophotometry
Gaia spectrophotometry results from combining BP and RP prism data to cover the 3300-10 200 Å range. The combination of low and variable resolution complicates the interpretation of the results. The output is given as a series of coefficients of an expansion in basis functions, but the choice of basis functions partially determines the derived  $f_\lambda(\lambda)$ and possibly introduces artifacts if the real
 $f_\lambda(\lambda)$ cannot be realistically expressed as a combination of the basis functions (Weiler et al. Reference Weiler2020). This is especially true for extinguished OB stars. Under those conditions, synthetic photometry and line measurements are not straightforward (Weiler et al. Reference Weiler2023). The reader is encouraged to read those papers before using the data.
1.4. Spectroscopy
Data from the Gaia Radial Velocity Spectrometer (RVS) has a resolution of 11 500 and covers the Calcium triplet window, where few lines exist for OB stars other than the broad Paschen lines. Furthermore, very few spectra of massive stars were published in DR3 and the papers on “hot stars” in DR3 refers to mostly intermediate- and low-mass stars (Blomme et al. Reference Blomme2023; Frémat et al. Reference Frémat2023). Hopefully in DR4 there will more RVS data for massive stars.
1.5. Multi-origin processed data products
Gaia also provides a number of processed products obtained by combining different data types. An example is the Gaia astrophysical parameters inference system (Apsis, Bailer-Jones et al. Reference Bailer-Jones2013), for which the results for OB stars in DR3 are described below.
2. Parameter determination
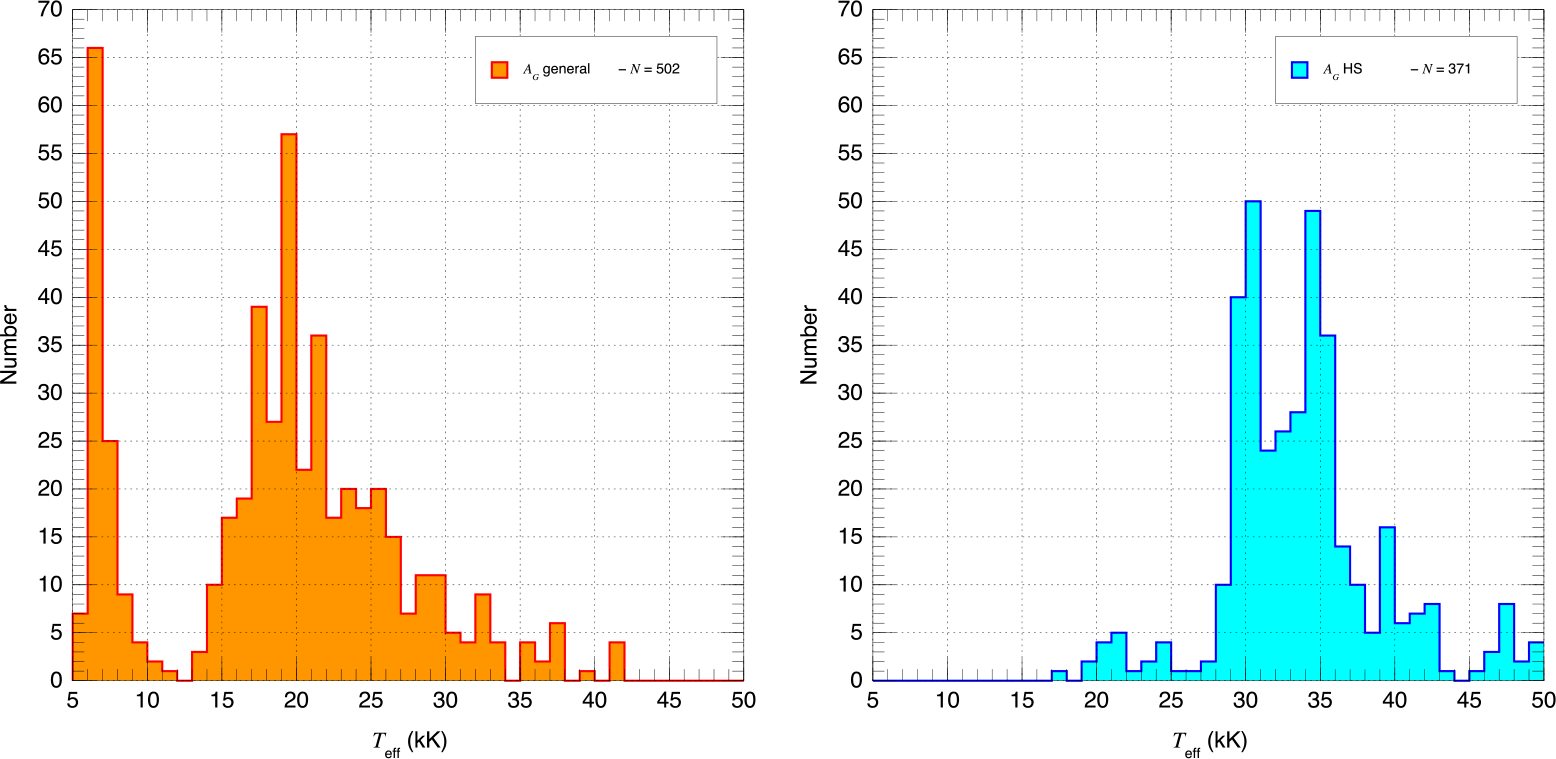
The DR3 DPAC determination of stellar parameters using Apsis is described in Creevey et al. (Reference Creevey2023); Fouesneau et al. (Reference Fouesneau2023) and the specific case of “hot stars” (defined as those with  ${T_{\rm eff}} \gt 7.5$ kK) is discussed in Frémat (Reference Frémat2024). There are different pipelines involved in Apsis, including a general one called GSP-Phot and another one for hot stars called ESP-HS. Frémat (Reference Frémat2024) shows poor results in the confusion matrix that compares the spectral types predicted by ESP-HS and the ones from Simbad (which have their own problems, see Maíz Apellániz et al. Reference Maíz Apellániz2016), with a large fraction of misclassified O and B stars, including a majority of O stars. I did a similar study (compatible with the Frémat Reference Frémat2024 results), partially presented as Maíz Apellániz (Reference Maíz Apellániz2024) comparing the DR3 Apsis
 $T_{\rm eff}$ values with O stars with accurate GOSSS spectral types (Maíz Apellániz et al. Reference Maíz Apellániz2011). Figure 1 shows how GSP-Phot only correctly identifies a few O stars as such, with a significant fraction being assigned
 ${T_{\rm eff}} \lt 10$ kK. ESP-HS does a much better job but still underestimates
 $T_{\rm eff}$ for most O stars.
Values for  $T_{\rm eff}$ determined by Apsis for 947 O stars with accurate GOSSS spectral classifications (Maíz Apellániz et al. Reference Maíz Apellániz2011) using GSP-Phot (left) and ESP-HS (right).

Therefore, at least for DR3, Apsis does a poor job at determining the properties for OB stars but why? There are at least two reasons:
[1] Apsis (and Gaia in general) was designed mostly with cool stars in mind. To determine the properties of hot stars (a) the blue-violet range is much better that the Calcium triplet window of RVS and (b) the Balmer jump is difficult to measure with BP spectrophotometry because it is located close to its wavelength edge and also likely because the predetermined basis functions do not work well with extinguished OB stars.
[2] Apsis uses the Fitzpatrick (Reference Fitzpatrick1999) family of extinction laws instead of other existing better choices and, more importantly, fixes the value of R to 3.1, which only works properly for a minority of OB stars (Maíz Apellániz et al. Reference Maíz Apellániz2014; Maíz Apellániz & Barbá Reference Maíz Apellániz and Barbá2018). As a consequence, the determined extinguished SED is inconsistent with the same Gaia spectrophotometry used to establish it (see Fig. 9 in Maíz Apellániz Reference Maíz Apellániz2024). The incorrectly determined extinction quite likely interferes with an accurate  $T_{\rm eff}$ determination.
3. Binaries
The largest DR3-based study of binaries is Mowlavi et al. (Reference Mowlavi2023), who analysed over 2 million eclipsing binaries from the Rimoldini et al. (Reference Rimoldini2023) sample, see below. Gaia DR3 typically included 50 photometric epochs (the exact number depends primarily on sky position) and the high photometric accuracy, spatial resolution, and stability of Gaia photometry is a good complement to other surveys such as TESS, which has a much better sampling but poorer spatial resolution and long-term photometric accuracy. See Holgado et al. (Reference Holgado2025) for an example of how to combine the best of both worlds to study massive eclipsing binaries. DR4 will provide  $\sim 100$ photometric epochs for a much larger sample and should allow the discovery and study of even more eclipsing binaries (massive and non-massive).
Of course, the most interesting massive binaries are those that are expected to be discovered through the combination of epoch astrometry and radial velocities, especially those with a BH or NS component where the motion of the photocentre is most prominent (Andrews et al. Reference Andrews2019; Janssens et al. Reference Janssens2022). However, as Gaia DR3 published very limited epoch data, only two systems with BHs were discovered there (El-Badry et al. Reference El-Badry2023a; El-Badry et al. Reference El-Badry2023b). A third one was discovered using pre-release DR4 astrometry (Panuzzo et al. Reference Panuzzo2024). DR4 is expected to yield a large number of systems with dark companions and a review similar to this one in the next beach meeting will likely be very different.
4. Photometric variability
Gaia DR3 contained epoch photometry for only  $\sim 1\%$ of the sample, with the targets selected on the basis of their (suspected) variability. That epoch photometry is the basis for the classification of 12.4 million photometric variables by Rimoldini et al. (Reference Rimoldini2023), which included classes (mostly) specific to massive stars such as
 $\alpha$ Cyg,
 $\beta$ Cep, and Be (+ other emission line stars) and other more generic ones such as eclipsing binaries (see above) and long-period variables that included some massive stars. A comparison with TESS data reveals that Gaia photometry is highly useful for the classification of variable stars (Hey & Aerts Reference Hey and Aerts2024).
One problem with using the Rimoldini et al. (Reference Rimoldini2023) results is that their sample is heavily biased by design towards highly variable stars, leaving no variability data for most stars and without the possibility of doing global mean-variability studies for most regions of the CMD, at least until DR4 becomes available. To address those issues, Maíz Apellániz et al. (Reference Maíz Apellániz2023) devised a method to obtain the photometric dispersion (or variabilty amplitude) in the three G+ $G_{\rm BP}$+
 $G_{\rm RP}$ bands for the sample of Gaia stars with
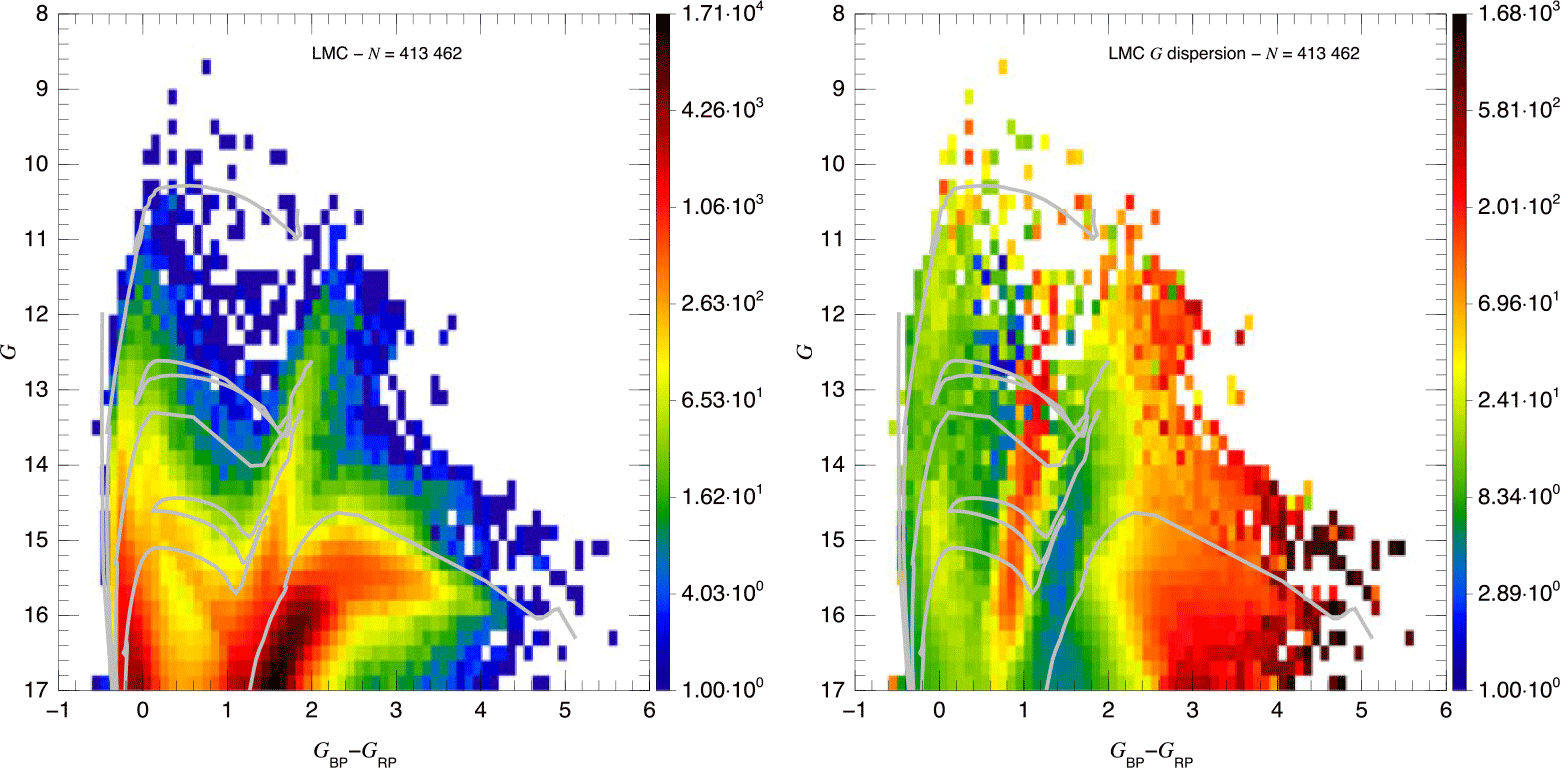
 ${G} \gt 17$ mag and five-parameter astrometric solutions (the majority of them). An example of their results is shown in Fig. 2, where the mean G photometric dispersion for 413 462 bright LMC stars is shown, allowing for the identification of variable and non-variable stars alike. As a comparison, less than 13% of those stars are in Rimoldini et al. (Reference Rimoldini2023).
(left) CMD and (right) mean G-band photometric dispersion in mmag for the LMC Gaia DR3 sample of Maíz Apellániz et al. (Reference Maíz Apellániz2023). The most prominent variability regions correspond (in increasing  $G_{\rm BP}-G_{\rm RP}$) to Be stars, cepheids, and long-period variables, respectively.

Figure 2 Long description
Panel A: A scatter plot displays the color-magnitude diagram (CMD) for the Large Magellanic Cloud (LMC) using Gaia DR3 data. The x-axis represents the color index G_BP - G_RP, and the y-axis represents the G magnitude. The plot uses a color gradient to indicate data density, with blue representing lower density and red representing higher density. White contour lines highlight regions of interest. Panel B: Another scatter plot shows the mean G-band photometric dispersion in millimagnitudes for the same LMC sample. The x-axis is the same color index G_BP - G_RP, and the y-axis is the G magnitude. The color gradient here also indicates data density, with blue for lower density and red for higher density. White contour lines are again used to highlight specific regions. The most prominent variability regions correspond to Be stars, cepheids, and long-period variables, respectively.
5. Stellar groups
Gaia has had a tremendous impact on the study of stellar groups (clusters and associations). One important area has been the census of open clusters and the determination of their characteristics (Cantat-Gaudin et al. Reference Cantat-Gaudin2018; Castro-Ginard et al. Reference Castro-Ginard2020; Castro-Ginard et al. Reference Castro-Ginard2022; Hunt & Reffert Reference Hunt and Reffert2023, to name some of the relevant studies). Another one has been the determination of the internal kinematics of stellar groups, with the evidence piling up against a monolithic model of star formation of clusters followed by a posterior dispersion and in favour of a hierarchical model with stars being born both in clusters of different sizes and in looser associations (Carraro Reference Carraro2020; Wright Reference Wright2020; Ward et al. Reference Ward2020; Quintana & Wright Reference Quintana and Wright2022; Vaher et al. Reference Vaher2023).
Specifically regarding stellar groups with massive stars, the Villafranca project (Maíz Apellániz et al. Reference Maíz Apellániz2020; Maíz Apellániz et al. Reference Maíz Apellániz2022b; Maíz Apellániz et al. Reference Maíz Apellániz2025) is obtaining the membership of the most relevant targets with OB stars and properly deriving their distances using the calibration described in subsection 1.1. One of its most significant results is the discovery that the Bermuda cluster, the origin of the ionising stars of the North America and Pelican nebulae, is dissolving not because of the loss of its gas but because of three different dynamical events that ejected its most massive stars, leaving behind a expanding orphan cluster (Maíz Apellániz et al. Reference Maíz Apellániz2022a).
6. Sample and spatial distribution
Up to DR3, the most important contribution of Gaia to massive-star research has been the calculation of accurate and precise distances to stars in the solar neighborhood. This in turn has led to studies of their spatial distribution and of their sample, as it is now possible to build relatively accurate color-absolute magnitude diagrams (CAMDs) and from there to identify new massive stars to some degree. At the same time, an increased confusion in terminology has appeared. Traditionally, mostFootnote 3 massive stars were identified as OB stars, meaning O-B2 dwarfs, O-B5 giants, and O-B8 supergiants, leaving the much more numerous mid- and late-B dwarfs out, as they are for the most part of intermediate mass (Maíz Apellániz et al. Reference Maíz Apellániz2026). However, Gaia has prompted a number of searches for stars in the upper left part of the CAMD (Chen et al. Reference Chen2019; Liu et al. Reference Liu2019; Liu et al. Reference Liu2024; Poggio et al. Reference Poggio2021; Xu et al. Reference Xu2021; Zari et al. Reference Zari2021; Li & Binney Reference Li and Binney2022; Xiang et al. Reference Xiang2022; Khalatyan et al. Reference Khalatyan2024; Quintana et al. Reference Quintana2025) under names such as “Upper Main Sequence stars”, “OBA stars”, “B-type candidates”, and even as “OB stars” when most of their sample is actually made out of late B dwarfs. The reader is referred to ALS III (Pantaleoni González et al. Reference Pantaleoni González2025), where we have compared those studies, indicating which ones are aware of that distinction and/or try to eliminate non-massive stars from the sample (with spectroscopy or otherwise) and which ones are/do not.
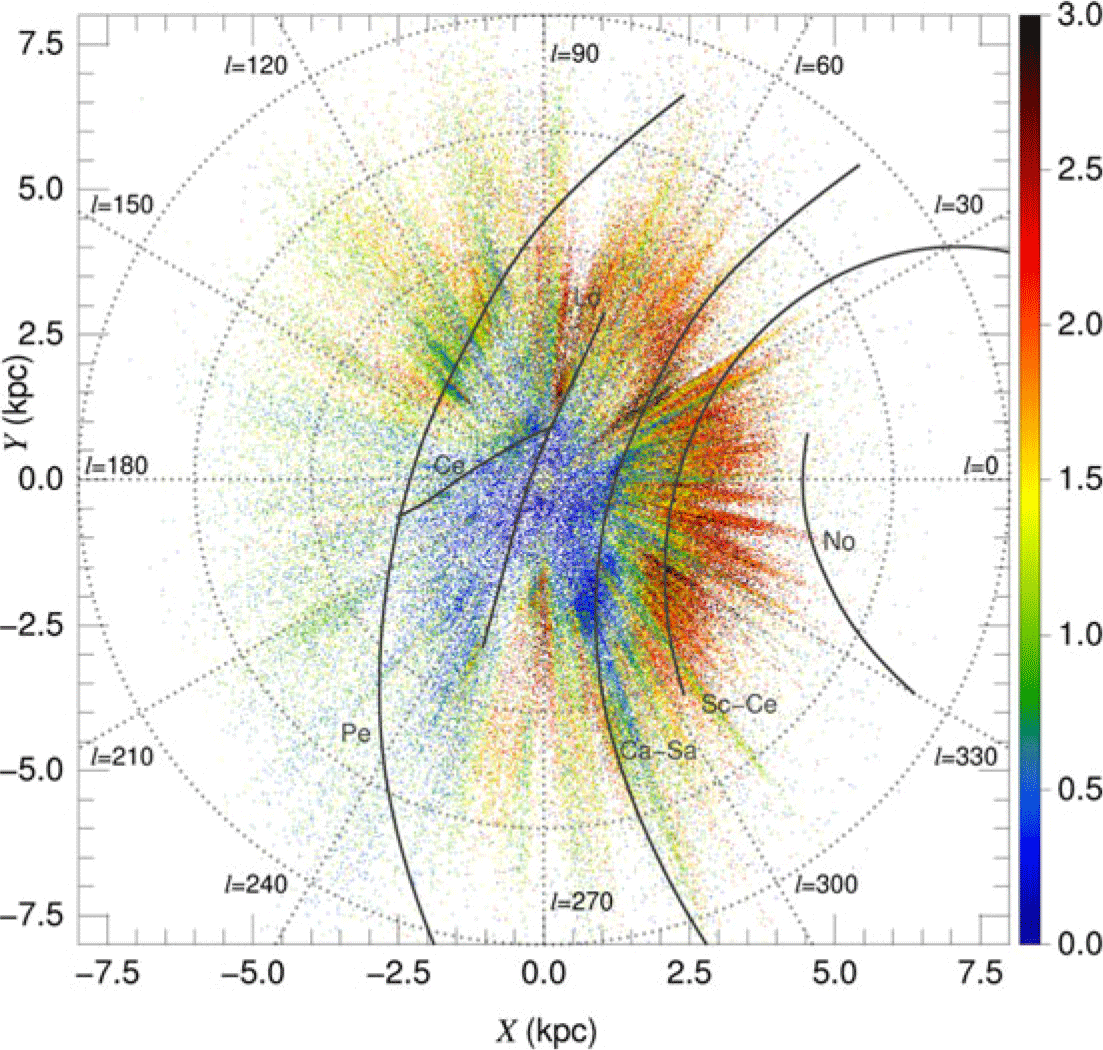
Most of the studies mentioned above easily detect the Carina-Sagittarius, Local, and Perseus spiral arms (the latter, only clearly seen for  $l \lt 140^{\rm o}$, Negueruela & Marco Reference Negueruela and Marco2008). The Poggio et al. (Reference Poggio2021) and Zari et al. (Reference Zari2021) samples, though dominated by intermediate-mass stars, also detect the Scutum-Centaurus spiral arm. Pantaleoni González et al. (Reference Pantaleoni González2021) discovered the Cepheus arm as an interarm structure elevated over the Galactic plane. Kuhn et al. (Reference Kuhn2021) detected a similar but shorter high-pitch angle structure in the Carina-Sagittarius arm.
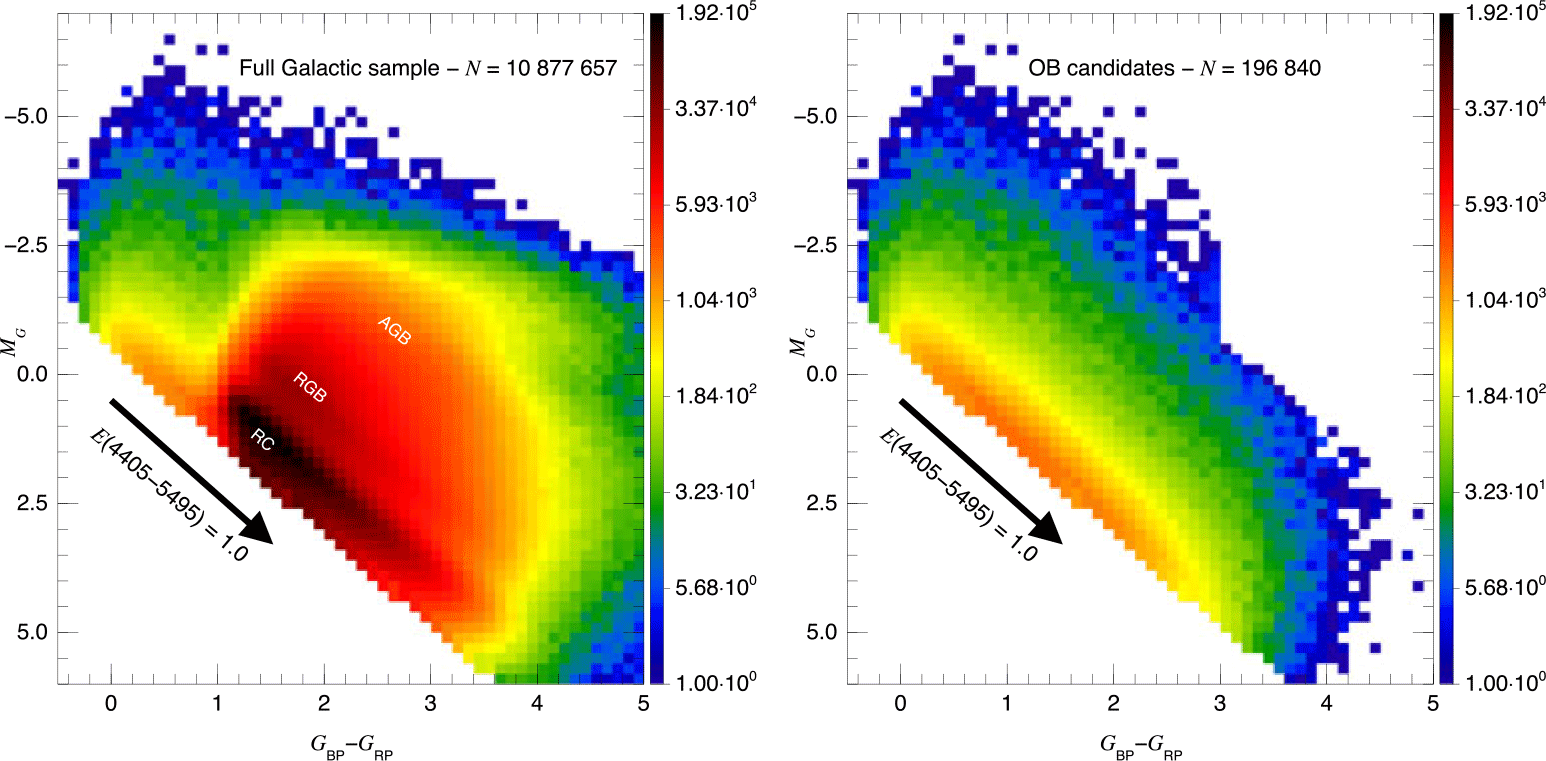
ALS III lists 15 648 high-probability Galactic massive stars. Other studies that rely as ours on filtering with spectroscopy or other methods (Chen et al. Reference Chen2019; Xu et al. Reference Xu2021) reach similar or lower numbers. Others that are more lax on their selection criteria can reach values more than an order of magnitude higherFootnote 4 (see Table I in ALS III). The question is that, given that the Galactic massive-star population is expected to be about two orders of magnitude higher than that, how can we use Gaia to significantly increase the known sample? One answer (Maíz Apellániz in prep.) is to combine Gaia photometry and astrometry with 2MASS photometry to filter out the low+intermediate mass evolved population that dominates the upper right part of the Galactic CAMD in the form of red clump (RC), red giant branch (RGB), and asymptotic giant branch (AGB) stars. The effect of such a filter is seen by comparing the two panels in Fig. 3: after applying the filters we are left with the expected distribution of a population of OB stars first extinguished and then limited in magnitude as we move towards redder colours. Even if the contamination from intermediate-mass stars is of the order of 50%, the filtering process yields  $\sim 10^5$ stars. Figure 4 plots the filtered population projected onto the Galactic Plane, colour-coded by
 $G_{\rm BP}-G_{\rm RP}$, where the increase in extinction at the location of the Scutum-Centurus arm is easily visible. With the better quality of DR4 data, the number of stars filtered by this method is expected to be several times higher, thus increasing the number of known Galactic massive stars by an order of magnitude from the current number.
(left) CAMD for Galactic stars with good-quality Gaia DR3 + 2MASS data located above the 20kK ZAMS extinction track with  ${R_{5495}}=3.1$. The arrow marks the extinction direction for
 ${E(4405-5495)} = 1.0$ mag and the labels indicate the location of the RC, RGB, and AGB stars, as smeared by extinction, (right) Same CAMD after applying Gaia + 2MASS filters to eliminate non-OB stars.

Spatial distribution of the sample in the right panel of Fig. 3 colour-coded by  $G_{\rm BP}-G_{\rm RP}$ as a proxy for extinction.

7. Summary
I have reviewed the previous and future contributions of Gaia to the study of massive stars: parameter determination, binaries, photometric variability, stellar groups, and sample and spatial distribution. Of the previous ones, likely the most important one has been the ability to derive for the first time precise and accurate distances to massive stars within several kpc of the Sun, thus eliminating many uncertainties in their properties. Of the ones expected for DR4, two stand out: the likely discovery of a significant number of NS and BH companions and the increase of the sample of known Galactic massive stars by an order of magnitude.
 Teff
 GBP−GRP
 R5495=3.1
 E(4405−5495)=1.0
 GBP−GRP

 Open access

