Introduction
The rapid current warming in the Arctic and sub-Arctic (ACIA 2005; IPCC 2007) is likely to create many changes in the social, economic and cultural behaviour of the populations of these regions. Few of the expected changes are considered to be positive. Among the expected benefits of a warmer climate, the development of agriculture in sub-Arctic areas may be seen as an opportunity for self-sufficiency and, in the case of Greenland, support for independence (see the Greenland Self-Government Act). However, the development of agriculture in pristine landscapes is not without possible consequences for soil erosion, ecosystem stability and therefore, in the long term, human populations. In this context, looking at the past provides the opportunity to explore the complex relationship between climate and human societies, and may provide insights for the future.
This article focuses on the historical development of agriculture on the southwestern coast of Greenland as an exceptional study model to examine the transition from a pristine to an anthropogenic landscape. During the last millennium, climate warming events allowed two phases of agricultural expansion in that area. The first phase occurs with the medieval Norse colonisation between the end of the tenth century and the mid-fifteenth century; the second corresponds to the modern reestablishment of Danish farmers since 1920 after the end of the Little Ice Age (LIA; circa 1350–1850ad). Before and after the Norse colonisation, this land was used exclusively by native hunters.
The ULTIMAGRI project aims to assess climate and anthropogenic changes during the last millennium along the western coast of Greenland using lake sedimentary records. A dozen lakes were cored from 61°N to 65°N to document the history and impacts of farming activities on the local environment in the main agricultural zone of southwestern Greenland. Among these lakes, Lake Igaliku appears to be an excellent, sensitive recorder of environmental changes. A multi-proxy study was successfully conducted on sediments and results were diversely published (Gauthier and others Reference Gauthier, Bichet, Massa, Petit, Vannière and Richard2010; Massa and others Reference Massa, Bichet, Gauthier, Perren, Mathieu, Petit, Monna, Giraudeau, Losno and Richard2012a; Massa and others Reference Massa, Perren, Gauthier, Bichet, Petit and Richard2012b; Perren and others Reference Perren, Massa, Bichet, Gauthier, Mathieu, Petit and Richard2012). This article attempts a synthesis of these various approaches.
The historical setting of southwestern Greenlandic agriculture
According to historians (Krogh Reference Krogh1982; Jones Reference Jones1986), the colonisation of Greenland began around 985ad. Taking advantage of the warm medieval climate, Erıkur Rauðe Þorvaldsson (Erik the Red) led a group of Icelandic farmers to southwest Greenland. The first and most important Norse settlement (the so-called ‘eastern settlement’) is situated around 61°N, at the head of fjords of the Narsaq district (Fig. 1). The second one (the ‘western settlement’) is located at 65°N, near the modern city of Nuuk.
Map of the Norse eastern settlement showing the location of Igaliku/Garðar, Norse ruin groups (black dots), modern farms (black triangles) and the main localities of the area.

Recent interdisciplinary archaeological research has provided detailed information on the eastern settlement: location and description of individual sites (Guldager and others Reference Guldager, Stummann and Gleie2002; Algreen-Møller and Madsen Reference Algreen-Møller and Madsen2006; Heide and Madsen Reference Heide and Madsen2011), demography (McGovern Reference McGovern1991; Lynnerup Reference Lynnerup1996, Reference Lynnerup, Fitzhugh and Ward2000) and agro-pastoral practices (Arneborg Reference Arneborg2005; Dugmore and others Reference Dugmore, Church, Buckland, Edwards, Lawson, McGovern, Panagiotakopulu, Simpson, Skidmore and Sveinbjarnardóttir2005; Commisso and Nelson Reference Commisso and Nelson2008; Buckland and others Reference Buckland, Edwards, Panagiotakopulu and Schofield2009). At the peak of the colony, Norse settlers numbered 2000 to 3000 in approximately 500 farms (eastern and western settlement). They developed an agro-pastoral economy which was supplemented with additional fishing and hunting activities (Barlow and others Reference Barlow, Sadler, Ogilvie, Buckland, Amorosi, Ingimundarson, Skidmore, Dugmore and McGovern1997; Arneborg and others Reference Arneborg, Heinemeier, Lynnerup, Nielsen, Rud and Sveinbjörnsdóttir1999; Dugmore and others Reference Dugmore, Church, Buckland, Edwards, Lawson, McGovern, Panagiotakopulu, Simpson, Skidmore and Sveinbjarnardóttir2005). Norse farmers raised livestock: some cattle and horses but mainly sheep and goats that were more adapted to harsh climatic conditions and a short growing season (Dugmore and others Reference Dugmore, Church, Buckland, Edwards, Lawson, McGovern, Panagiotakopulu, Simpson, Skidmore and Sveinbjarnardóttir2005). Extended grazing activities were supplemented through hay field management (Fredskild Reference Fredskild1992; Schofield and others Reference Schofield, K.J. and McMullen2007), irrigation (Arneborg Reference Arneborg2005; Adderley and Simpson Reference Adderley and Simpson2006) and manure fertilisation (Commisso and Nelson Reference Commisso and Nelson2007, Reference Commisso and Nelson2008; Ross and Zutter Reference Ross and Zutter2007; Buckland and others Reference Buckland, Edwards, Panagiotakopulu and Schofield2009). Pollen studies also indicate attempts at cereal cropping (Schofield and others Reference Schofield, K.J. and McMullen2007; Edwards and others Reference Edwards, Schofield and Mauquoy2008; Buckland and others Reference Buckland, Edwards, Panagiotakopulu and Schofield2009).
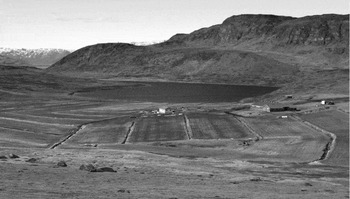
During the medieval period, the village of Igaliku (the medieval Garðar in the eastern settlement) was one of the most prosperous of the colony, settled at the beginning of the Norse landnám (‘land-take’, Old Norse). Archaeological studies record 52 Norse archaeological structures, including large byre-barn complexes, animal pens and enclosures, sheep/goat houses and an irrigation system for fodder production (Nørlund Reference Nørlund and Roussell1929; Arneborg Reference Arneborg2007). Garðar became the episcopal residence, with the first Greenlander bishop in 1126ad, as well as the Þing (political assembly) for the eastern settlement. Due to the topographical situation of the Igaliku area (Fig. 2) between mountains (over 300m asl to the south and north) and fjords (Igalikup Kangerlua/Igaliku Fjord to the east and Tunulliarfik/Erik's Fjord to the west), all the low slopes around Lake Igaliku were probably subject to grazing pressure.
View of Lake Igaliku and farmed surroundings (view towards the north).

Many explanations have been proposed for the demise of the Greenland Norse in the fifteenth century: the LIA climate reversal is probably the main cause (Dansgaard and others Reference Dansgaard, Johnsen, Reeh, Gundestrup, Clausen and Hammer1975; Berglund Reference Berglund1986; Barlow and others Reference Barlow, Sadler, Ogilvie, Buckland, Amorosi, Ingimundarson, Skidmore, Dugmore and McGovern1997; Dugmore and others Reference Dugmore, Borthwick, Church, Dawson, Edwards, Keller, Mayewski, McGovern, Mairs and Sveinbjarnardóttir2007), but economic and social factors have also been proposed (McGovern Reference McGovern, Fitzhugh and Ward2000; Diamond Reference Diamond2005), as has the role of overgrazing (Fredskild Reference Fredskild1992; Schofield and Edwards Reference Edwards, Schofield, Kirby and Cook2011).
In this context, many palaeoenvironmental studies have recently been undertaken in the eastern settlement to assess human impacts during the medieval period (Schofield and others Reference Schofield, Edwards, Mighall, Martínez Cortizas, Rodríguez-Racedo and Cook2010; Edwards and others Reference Edwards, Schofield and Mauquoy2008, Reference Edwards, Schofield and Arneborg2010, Reference Edwards, Schofield, Kirby and Cook2011; Buckland and others Reference Buckland, Edwards, Panagiotakopulu and Schofield2008, Reference Buckland, Edwards, Panagiotakopulu and Schofield2009). These studies on peat bog deposits, soil sections or archaeological trenches suggest an increase of soil erosion due to Norse activities. However, discontinuities in the records or dating problems hamper the palaeoenvironmental evaluation of these sites.
The Norse colonisation took place in a pristine landscape probably visited occasionally by native hunters. After the demise, the Igaliku area was partially reoccupied by Inuits, then by European immigrants shortly after the beginning of the eighteenth century (Keller Reference Keller1990; Hamilton and others Reference Hamilton, Lyster and Otterstad2000). Mainly used by Europeans as small hunting and fishing settlement, Igaliku became a new agricultural zone in the 1920s, when the climate reached its first maximum after the LIA (Box and others Reference Box, Yang, Bromwhich and Bai2009). Modern agriculture is based on sheep breeding. Livestock in southwestern Greenland was developed under the impetus of the Danish government; in the 1960s there were as many as 48,000 sheep (House of Agriculture, Qaqortoq). After several severe winters in the 1960s and 1970s, which decimated two-thirds of the sheep population, an agricultural reform (Egede Reference Egede1982) was carried out in the late 1970s: sheep that grazed freely throughout the year were stabled during winter, thus requiring an intensive summer hay production for winter fodder.
Current sheep farming in the Lake Igaliku catchment corresponds to two main farms, established in the early 1960s and modernised in the 1980s. The two farms have large barns for wintering about 1000 sheep (Miki Egede, personal communication) and summer hay production takes place on a 30ha field by the shore of the lake (Fig. 2).
Materials and methods
Cores and chronology
In order to obtain a continuous high-resolution environmental archive, the deepest part of Lake Igaliku (N61°00′24″, W45°26′30″, 15m asl; see Fig. 2) was cored from a floating platform, using piston and gravity corers. A four-metre sandy silt Holocene composite sequence was collected, with the upper 80cm spanning the last 1500 years.
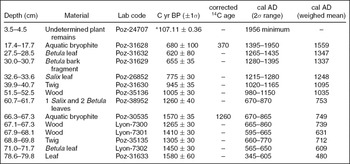
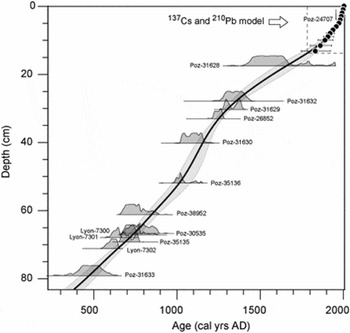
For this period, the chronology (Fig. 3 and Table 1) is based on 14 accelerator mass spectrometry (AMS) radiocarbon dates (Table 1) on terrestrial plant macrofossils (12 twigs and leaves) and aquatic bryophytes (two samples) corrected for reservoir effect (Massa and others Reference Massa, Bichet, Gauthier, Perren, Mathieu, Petit, Monna, Giraudeau, Losno and Richard2012a). In addition, the last two centuries (the upper 15cm) are dated by 210Pb and 137Cs using α-spectroscopy and the constant rate supply (CRS) method (Appleby and Olfield Reference Appleby and Oldfield1978). Radiocarbon calibration and age–depth modelling were done with a Monte Carlo method (Blaauw Reference Blaauw2010), which allows for the robust estimation of the related uncertainty and takes into account the entire probability distribution of calibrated 14C dates.
Radiocarbon dates from the sediment archive of Lake Igaliku. The post-bomb radiocarbon activity (marked *) is expressed as a percentage of modern carbon (pmC)

Age–depth model of the Lake Igaliku core for the upper 80cm. The probability distributions of calibrated radiocarbon dates are displayed with laboratory reference number. Chronology of the upper 15cm used 210Pb and 137Cs activity measurements.

Sampling and sediment analyses
This research is based on a multidisciplinary approach using indicators that track catchment dynamics (vegetation (Gauthier and others Reference Gauthier, Bichet, Massa, Petit, Vannière and Richard2010) and sediment (Massa and others Reference Massa, Bichet, Gauthier, Perren, Mathieu, Petit, Monna, Giraudeau, Losno and Richard2012a) yield) and the lake's trophic changes (organic geochemistry, and diatoms (Perren and others Reference Perren, Massa, Bichet, Gauthier, Mathieu, Petit and Richard2012)). A suite of geophysical (γ-density and magnetic susceptibility with a Geotek Multi-Sensor Core Logger), geochemical (Avaatech XRF Core Scanner, inductively coupled plasma atomic emission spectroscopy (ICP-AES), Corg, Ntot, δ15N, δ13C) and biological (pollen, non-pollen palynomorph (NPP) and diatoms) proxies were analysed. Here, proxies that assess catchment dynamics are synthesised, highlighting the impacts of farming activities during the medieval and modern periods.
The sediment core was contiguously sampled. The top 10cm were sampled in 0.5cm slices and below 10cm, sampling intervals (approximately 1cm) were chosen by using X-ray imaging to ensure homogenous samples according to the varying lithology. Sampling resolution is between two and 32 years per sample for geochemical proxies and diatoms, and between 25 and 80 years for pollen and NPP.
Pollen and NPP
Sediment samples were processed for pollen and NPP analysis using standard techniques (Moore and others Reference Moore, Webb and Collinson1991). A minimum of 400 pollen grains of terrestrial plants were counted in each sample to ensure statistical significance. Cyperaceae, hygrophilous plants such as Menyanthes trifoliata and Equisetum, and aquatic taxa, exotic taxa, spores and NPPs were excluded from the pollen sum.
Pollen grains were identified with the aid of a reference collection of Greenlandic modern pollen types, keys (Fægri and Iversen Reference Fægri and Iversen1989; Moore and others Reference Moore, Webb and Collinson1991) and photographs (Reille Reference Reille1992; Beug Reference Beug2004). In accordance with Fredskild (Reference Fredskild1973), Betula grains larger than 20μm were assigned to B. pubescens and the remainder assigned to B. glandulosa. Pollen zones (IGA 1-4) were delimited with CONISS to provide constrained incremental sums of squares cluster analysis (Grimm Reference Grimm1987).
NPPs were identified using published references (Bell Reference Bell1983; van Geel Reference Van Geel1978, Reference Van Geel, Smol, Birks and Last2001; van Geel and others Reference Van Geel, Buurman, Brinkkemper, Schelvis, Aptroot, van Reenena and Hakbijl2003; van Geel and Aptroot Reference Van Geel and Aptroot2006), and percentages were calculated on the basis of the same pollen sum used for the pollen diagram.
Terrigenous fluxes
Derived from the analysis of sedimentological proxies, lake mass accumulation rates of minerogenic matter (MARmin) reflect the terrigenous fluxes, produced from the catchment and transported to the lake. MARmin were calculated according to Enters and others (Reference Enters, Dorfler and Zolitschka2008), using wet bulk density, water content, minerogenic matter content deduced from organic carbon measurement, and sediment accumulation rate derived from the age–depth model. Details are in Massa and others (Reference Massa, Bichet, Gauthier, Perren, Mathieu, Petit, Monna, Giraudeau, Losno and Richard2012a).
Nitrogen stable isotopes
Stable isotopic composition of total nitrogen was determined on dried sediment samples with an elemental analyser (Carlo-Erba NA 1500 NCS, Haake Buchler Instruments) coupled to a ratio mass spectrometer (VG Isochron, Micromass). Results are expressed in standard delta notation.
Diatoms
Diatoms (and chrysophytes) were prepared from wet sediments using a standard protocol for large sample numbers (Renberg Reference Renberg1990; Battarbee and Kneen Reference Battarbee and Kneen1992). Using a microscope, at least 350 diatom valves were identified and enumerated from the slides. Identification of diatoms was aided by reference literature from Greenland (Foged Reference Foged1953, Reference Foged1972, Reference Foged1977) and Labrador (Fallu and others Reference Fallu, Allaire and Pienitz2000). Details are in Perren and others (Reference Perren, Massa, Bichet, Gauthier, Mathieu, Petit and Richard2012).
Results
Pollen and NPP
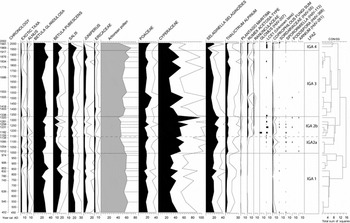
A preliminary pollen and NPP diagram of the Lake Igaliku sequence was published, showing vegetation changes in the catchment for the last 1300 years (Gauthier and others Reference Gauthier, Bichet, Massa, Petit, Vannière and Richard2010). This first published study is supplemented here by further analysis and radiocarbon dates, producing an extended and accurate model until 1500 years ago (Fig. 4).
Simplified pollen and NPP diagram for the last 1500 years based on a relative percentage calculation. Exaggeration curves x 2. Exotic taxa suggesting long-distance pollen air transport from Europe and America: Abies, Picea, Pinus, Carpinus, Corylus, Fagus, Fraxinus, Quercus, Ulmus, Ambrosia and Artemisia. On the left, the age is given with the total standard deviation for each sample in year calibrated AD.

Changes from the base to the top can be divided into four main local palynological zones (LPAZ) with sub-divisions. In LPAZ 1, corresponding to the second half of the first millennium, the spectrum of arboreal pollen indicates low arctic tundra vegetation, dominated by Betula glandulosa (birch, 20–30%), Betula pubescens (tree birch, 10–20%), Salix (willow, 10–15%) and Juniperus (juniper, 5–8%). Ericaceous dwarf shrubs (mainly Empetrum-type) appear in low percentage (<5%) but are certainly under-represented in the assemblage (Schofield and others Reference Schofield, K.J. and McMullen2007). Arboreal pollen account for ~60% of the pollen sum. Grasses, herbs and mosses are also present (Poaceae 15–20%; Cyperaceae 25–40%; Selaginella selaginoïdes 10–20%). Thalictrum accounted for 5% and Rumex acetosa-type appears in this first zone with very low percentages. Rumex acetosa pollen type includes Rumex acetosa, R. acetosella and Oxyria digyna pollen grains (Beug Reference Beug2004). R. acetosa and R. acetosella are, according to Fredskild (Reference Fredskild1973), Norse apophytes, unlike Oxyria dygina, which is native to Greenland. So it is not surprising to find few occurrences of the pollen type before the Norse period. However, a strong increase in Rumex acetosa-type is usually related to the introduction of Rumex acetosa and Rumex acetosella (Fredskild Reference Fredskild1973; Schofield and others Reference Schofield, K.J. and McMullen2007; Edwards and others Reference Edwards, Schofield and Mauquoy2008; Schofield and others Reference Schofield and Edwards2011). Among the NPPs, occurrences of coprophilous fungi, which grow indiscriminately on herbivore dung (Bell Reference Bell2005) and indicate the presence of herbivores around the lake (van Geel and Aproot Reference Van Geel and Aptroot2006), are scarce. A few fungal spores of Sodaria, Sporormiella and Podospora were counted; Arnium and LCE1, an unknown NPP type, are exceedingly rare.
The vegetation changes in LPAZ 2, which starts a little before 1000ad. The progressive decrease in Betula pubescens (from 20% to 10%) and Juniperus (from 10% to 5%) resulted in an overall decrease in the sum of arboreal pollen (from 60% to 45%). At the same time, the rising values of clubmoss Selaginella selaginoïdes (25%), heliophilous Thalictrum (5%) and sedges Cyperaceae (50–60%) in LPAZ 2 suggest a more open ground cover. Pollen evidence of moderate grazing pressure is recorded here, probably coupled with an increase in effective moisture. The decline of Juniperus may be related to herbivores: Greenlandic sheep often browse this prostrate shrub, which usually grows in places with a slight snow-cover (Fredskild Reference Fredskild1973; Thomas and others Reference Thomas, El-Barghathi and Polwart2007). Decline in Juniperus is linked to a clear increase in spores of coprophilous fungi and weeds associated with grazing, especially Plantago maritima, Rumex acetosa-type and Ranunculus acris-type. A peak of Glomus chlamydospores around 1200cal.ad reaches 8% of the NPP total. Glomus, which is frequently present on microrrhyzal association of a variety of host plants, including Betula (van Geel Reference Van Geel, Smol, Birks and Last2001), could indicate soil erosion and a degradation of shrubs and tree roots. At the same time, LCE1 increases.
LPAZ 3 documents the steady decrease of all the indicators of grazing pressure. After circa 1330ad, tree and shrub values increase (arboreal pollen 60%), as grass and herb values decrease. Coprophilous fungi appear in very low percentages. These changes probably constitute a response to reduced grazing intensity. Coprophilous fungi disappear almost completely around 1450ad and the tundra vegetation returns to almost pristine conditions. However, non-indigenous taxa and apophytes (such as Rumex acetosa-type and Plantago maritima), previously favoured by grazing, remain present.
For almost five centuries, the situation remains stable. After circa 1960ad (LPAZ 4), trees and shrubs decrease; and weeds, apophytes and coprophilous fungi increase, probably in response to a new phase of grazing pressure. The arboreal pollen rate reaches its minimum at 40% of the pollen sum and may indicate a greater pressure on trees than during the medieval period.
Terrigenous fluxes
Sedimentary terrigenous fluxes, which reflect catchment dynamics in response to climate and land-use evolution, have been estimated by MARmin (Fig. 5). In the acidic context of the catchment (crystalline granite overlain partly by arkosic sandstones and basalts), minerogenic matter is dominated by the silicate minerals which are correlated with terrigenous elements, such as the titanium content (Massa and others Reference Massa, Bichet, Gauthier, Perren, Mathieu, Petit, Monna, Giraudeau, Losno and Richard2012a).
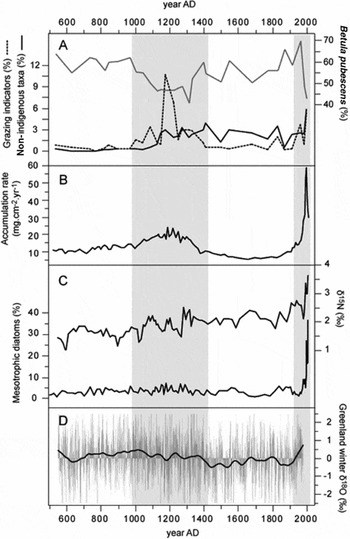
Comparison of environmental changes recorded by the Igaliku lake system during the last 1500 years. A: pollen of Betula pubescens, grazing indicators (sum of coprophilous and mycorrhizal fungi) and norse apophytes (for example, Rumex acetosa-type and Ranunculus acris-type); B: Lake mass accumulation rate of minerogenic matter (MARmin); C: δ15N and mesotrophic diatoms (for example, Fragilaria tenera); D: South Greenland Dye 3 winter δ18O (from Vinther and others Reference Vinther, Dahl-Jensen, Johnsen, Jones, Briffa, Clausen and Andersen2010). The shaded areas highlight the periods of Norse and modern farming.

As for pollen, two main phases of changes are shown in terrigenous fluxes. From 500ad until the end of the tenth century, MARmin values are relatively stable (average value around 12.7mg.cm−2.yr−1). Sediment flux increases after 1010cal.ad, synchronously with vegetation changes, until it reaches its maximum circa 1180cal.ad, at more than twice the baseline value. During the following period, after 1335cal.ad, MARmin decreases until it reaches the pre-Norse values. For the next five centuries, the sediment yield remains at a low level, corresponding to the lowest sediment yield of the last 1500 years.
At the top of the core, substantial changes are recorded in the twentieth century. The mass accumulation rate increases a little in the 1920s with a more significant increase since the 1960s. The MARmin increased sharply after 1988 and reached unprecedented values up to 60mg.cm−2.yr−1, about five times the pre-anthropogenic levels and more than twice the Norse maximum. The values of the last 10 years return to close to the medieval level.
Trophic changes in the lake: diatoms and nitrogen isotopes
Changes in diatoms and chrysophytes in the Lake Igaliku record are detailed in Perren and others (Reference Perren, Massa, Bichet, Gauthier, Mathieu, Petit and Richard2012). The diatom assemblages are stable over the last 1500 years, except in the period since 1975, when Fragilaria tenera, a tychoplanktonic taxon, which occurs in only the most nutrient-enriched west Greenland lakes (Perren and others Reference Perren, Massa, Bichet, Gauthier, Mathieu, Petit and Richard2012), increases dramatically (Fig. 5c). Its increase probably marks a shift towards nutrient enrichment within the last 30 years, and an increase of lake water nutrient level.
The δ15N record (Fig. 5c) shows a first phase with an average value around 1.5‰ until circa 1000ad. This value increases synchronously with the Norse landnám circa 1000ad and reaches 2.5‰ around 1300ad. During the next six centuries, until the first part of the twentieth century, δ15N remains relatively stable with an average around 2‰. A huge increase appears during the last 30 years and the highest values recorded, close to 4‰, occur in the last 10 years. This enrichment of δ15N is the inverse of recent trends observed in Greenland ice sheet snow and in Arctic lake sediments, where δ15N values have declined since 1950ad due to the widespread atmospheric deposition of N from anthropogenic sources (Wolfe and others Reference Wolfe, Cooke and Hobbs2006; Hastings and others Reference Hastings, Jarvis and Steig2009; Holtgrieve and others Reference Holtgrieve, Schindler, Hobbs, Leavitt, Ward, Bunting, Chen, Finney, Gregory-Eaves, Holmgren, Lisac, Lisi, Nydick, Rogers, Saros, Selbie, Shapley, Walsh and Wolfe2011). The rise in δ15N in Igaliku sediments could be attributed to an increase of lake organic primary production enhanced by excessive external nitrogen input due to manure, barn sewage and use of industrial fertilisers (Teranes and Bernasconi Reference Teranes and Bernasconi2000; Massa and others Reference Massa, Bichet, Gauthier, Perren, Mathieu, Petit, Monna, Giraudeau, Losno and Richard2012a).
Discussion
Patterns, timing and forcing of the main environmental changes
The robust age–depth model built for the Igaliku core and the multi-proxy approach allow for a compelling reconstruction of environmental changes through the last 1500 years. Over this period, the vegetation of the catchment shows subtle changes in trees and shrubs. In this open sub-Arctic tundra, the main taxa sensitive to changes are Betula pubescens (tree birch) (Fig. 5a) and Juniperus (juniper), which record two phases of clearance and/or grazing pressure: from circa 1000ad to circa 1330ad and later, after 1960ad. The first one, also documented elsewhere (Fredskild Reference Fredskild1973, Reference Fredskild1978; Edwards and others Reference Edwards, Schofield and Mauquoy2008; Schofield and others Reference Schofield, Edwards and Christensen2008), began during the medieval thermal maximum (Vinther and others Reference Vinther, Dahl-Jensen, Johnsen, Jones, Briffa, Clausen and Andersen2010) (Fig. 5d) and the second is synchronous to the post-1920 warming (Box and others Reference Box, Yang, Bromwhich and Bai2009). However, neither is related to a warmer climate as they coincide with medieval and modern farming periods. The decrease of Betula pubescens is inconsistent with a warming climate because warmer conditions are, on the contrary, favourable to its development (Fréchette and de Vernal Reference Fréchette and de Vernal2009). The decrease in Betula could be related to human domestic use (tree birch is the only ‘tree’ in southwestern Greenland and could be used for cooking and heating) and grazing pressure (it could have been browsed by domestic herbivores). The decrease of Juniperus and the synchronous occurrence in coprophilous fungi are probably a response to grazing pressure (Fredskild Reference Fredskild1973; Davis and Schafer Reference Davis and Shafer2006). Although Juniperus is not very palatable, many large mammals have been observed grazing on it, including deer, moose, cattle, horses and sheep (Thomas and others Reference Thomas, El-Barghathi and Polwart2007). The opening of the shrub vegetation indicates an anthropogenic impact due to agro-pastoral activities. A curve for grazing indicators (Fig. 5a), corresponding to the sum of coprophilous and mycorrhizal fungi (for example, Glomus), gives a clear view of the timing and variability of the two phases of Greenland agro-pastoralism.
Changes shown by the terrigenous mass accumulation rate into the lake (Fig. 5b), dominated by minerogenic yield from the catchment, follow the trends and the timing of the vegetation changes. During the pre-Norse period, from the thermal minimum of the Dark Ages (circa 600ad) to the medieval thermal maximum (circa 1000ad) (Fig. 5d), the mass accumulation rate remains relatively stable. It begins to increase synchronously with the arrival of the Norse, circa 1000ad, and returns to natural values close to the end of the colony. The pattern of MARmin during this period (increasing since ~1000ad with peak value at 1180ad, then decreasing after 1335ad), does not appear to be linked to temperature. After the demise of the Norse and during the LIA, the mass accumulation rate remained at its lowest stable value, probably in response to both the disappearance of grazing pressure and the LIA cooling that limits runoff erosion processes.
The intensification of modern agriculture after 1988ad is marked by a drastic increase in sediment accumulation rate. Mesotrophic diatoms and nitrogen isotopes (Fig. 5c), related to fluxes transferred from the catchment and an increase in the lake's trophic status, show a pattern unprecedented in the last 1500 years. The δ15N record shows a shift from its baseline during the Norse period. However, the main lake ecosystem response is recorded after 1980 when mesotrophic diatoms (such as Fragilaria tenera, Fig. 5c) increase sharply in concert with nitrogen isotopes. The change in diatom assemblages probably records the effect of both recent climate warming and the fertilisation of the catchment. Even if climate change over the last 1500 years has probably been the main control on agricultural development and abandonment, its direct effects on the catchment and lake have been dwarfed by human impacts.
Norse agriculture: history and impacts
According to the chronology of the landnám, the age–depth model of the core shows the first environmental disturbance due to Norse agriculture circa 1000ad, close to the foundation of Garðar (Krogh Reference Krogh1982; Jones Reference Jones1986). Until circa 1180ad, sedimentary parameters suggest a progressive increase of agro-pastoralism (mass accumulation rate, pollen and NPP) which probably track the development of the settlement. The sedimentary response to anthropogenic forcing reaches its maximum circa 1180ad and stays at a high level until circa 1335ad. This is consistent with historical archives which indicate that Garðar became the episcopal seat of Greenland in 1124ad (Krogh Reference Krogh1967), and the seat of the political assembly of the eastern settlement during the twefth century (Sanmark Reference Sanmark2009). During that time, even if grazing activities supplemented with manure fertilisation increased nutrient production (Commisso and Nelson Reference Commisso and Nelson2007, Reference Commisso and Nelson2008; Ross and Zutter Reference Ross and Zutter2007; Buckland and others Reference Buckland, Edwards, Panagiotakopulu and Schofield2009), the diatom assemblages were undisturbed and the lake remained at a low trophic level.
After circa 1335ad, Lake Igaliku records almost one hundred years of declining impacts from farming. Compared to Dye 3 winter δ18O (Fig. 5d), the closest ice core record, declining human impacts are coeval with a cooling episode which probably reduced the farm's productivity and the standing livestock. The decline in agricultural productivity was probably offset by seal hunting and fishing, as is indicated by the carbon isotope shifts in excavated Norse bones from the region (Arneborg and others Reference Arneborg, Heinemeier, Lynnerup, Nielsen, Rud and Sveinbjörnsdóttir1999). The decline of farming activities could also have been linked to a demographic decrease (the last bishop known to have resided at Garðar died in 1378 (Arneborg Reference Arneborg2007)), suggesting a long and forced adaptation of the Norse to the climate reversal rather than a sharp collapse (Diamond Reference Diamond2005).
After the final failure and abandonment of the Norse colony in Greenland, circa 1450ad, terrigenous fluxes returned to baseline values and the low percentages of grazing indicators, such as coprophilous fungi, declined to zero. However, the continuation of weeds and apophytes favoured by human activities (such as Rumex acetosa-type) (Fig. 5a) suggests that the landscape did not completely return to a pre-disturbance state.
Overall, impacts on the landscape due to the Norse farming activities appear subtle. Although these farming activities had minimal effects on the lake ecology, they are still clearly recorded in the lake sediments, especially by grazing indicators. Clearance of the vegetation and variable grazing pressure were probably the leading cause of the registered soil erosion. However, during the Norse period, in the catchment of Lake Igaliku, erosion probably never reached intolerable levels (Montgomery Reference Montgomery2007; Massa and others Reference Massa, Bichet, Gauthier, Perren, Mathieu, Petit, Monna, Giraudeau, Losno and Richard2012a), which contradicts the hypothesis of overgrazing (Fredskild Reference Fredskild1992).
Impacts of modern agriculture
After the cooling of the LIA, the climate of southwestern Greenland returned to warmer conditions circa 1920ad (Box and others Reference Box, Yang, Bromwhich and Bai2009; Vinther and others Reference Vinther, Dahl-Jensen, Johnsen, Jones, Briffa, Clausen and Andersen2010) and the reestablishment of sheep grazing in the catchment of Lake Igaliku is perceptible in the lake sediments. Sediments record the reestablishment of grazing pressure and soil erosion. From the 1920s to the 1980s, sheep farming in southwestern Greenland used methods not entirely dissimilar from Norse methods. Sheep were left to graze freely during winters and minimal amounts of fodder were produced.
At the end of the 1970s and the beginning of the 1980s, following the climate crisis of the winters 1966/67–1971/72 and the resulting loss of sheep, a new management arrangement was implemented in Greenland and the Lake Igaliku catchment (Egede Reference Egede1982). The method of farming shifted towards winter stall feeding, summer fodder production and higher yields at slaughter. Two modern farms with barns and sheep stables were built close to the lake and 30ha of hay fields were established on its shore. Earth working and tillage of the fields, supplemented with deep drainage ditches, induced a high sediment yield during the 1980s and 1990s. Soil erosion during the field development period is 2.5 times greater than the Norse maximum. However, erosion levels in the last 10 years, corresponding to the field exploitation, returned to close to the 1960s values.
The most spectacular impact of modern farming practices is the large ecological response by the diatom community reflecting the lake's trophic status linked to nutrient inputs. Around 200–250kg/ha−1/yr−1 of N are deployed for hay-field production around Lake Igaliku (Miki Egede, personal communication) and effluent from sheep stables is currently drained into the lake. Nutrient impacts have outpaced the geochemical and biological resilience of the lake, which is becoming mesotrophic like its European counterparts.
Conclusion
This study of Lake Igaliku allows for a long-term insight into anthropogenic impacts from the Norse colonisation and medieval agro-pastoralism to the modern farming activities. These catchment dynamics, emblematic of agricultural environments of southwestern Greenland, provide a high-resolution archive which confirms that the processes and the chronology of the Norse were controlled, to a large extent, by climatic variability. The establishment of the Norse occurred during the medieval thermal maximum, but was followed shortly after by a climatic reversal. Weather extremes similar to those of the 1960s–1970s may have occurred around 1300–1350ad (Vinther and others Reference Vinther, Dahl-Jensen, Johnsen, Jones, Briffa, Clausen and Andersen2010), and precipitated the collapse of agriculture and crippled the Norse colony.
The environmental footprint of the Norse is subtle. Vegetation was only slightly affected and the diatom flora suggest that the lake's trophic status was not modified. Soil erosion was the main impact of medieval agro-pastoralism. However, even if the sediment yield increased during the Norse period, our data do not support the hypothesis of overgrazing for the Greenland Norse collapse. This scenario is contradicted by the comparison with the high sediment yield, and the productivity, of the modern agriculture. By modern environmental standards, Norse agricultural impacts could be considered sustainable, though unsuited to the climatic conditions of the sub-Arctic if attempting to develop an economy mainly based on agricultural production.
Modern agriculture in Greenland aims to be productive and reduce sensitivity to short-lived climate crises. Recent climate warming is a potential asset but future crises cannot be ruled out. To reduce the risk, Greenlandic agriculture has entered into a new mechanised and chemical era, with farmers building large barns, tilling fodder fields and using industrial fertilisers. The huge environmental footprint of modern agricultural practices is undeniable. For the first time in 1500 years, lake ecosystems are clearly affected.
Does that mean that modern farming is unsustainable? Not yet. But anthropogenic changes are underway and lake ecosystems, as environmental sentinels, must be monitored to evaluate the environmental impacts and control agricultural practices in the future. Lake sediments provide good models for pairing archaeological and palaeoclimatic studies, but also for helping to parameterise issues for future society in Greenland.
Acknowledgements
The authors are grateful to M. Campy, H. Grisey and B. Vannière, for technical help during the coring campaign in Greenland. This research is supported by the University of Franche-Comté, the University of Burgundy, the Burgundy Regional Council, the French Polar Institute (IPEV) and the Agence nationale de la recherche: Changements environnementaux planétaires et sociétés (ANR CEPS) ‘Green Greenland’ project. Thanks to the reviewers, whose comments and suggestions have improved the manuscript.