Introduction
Most of the northeast farmlands are classified as small farms. Rapid urbanization and continued land development on the east-coast US have put pressure on profitability in agricultural production. Referring to New Jersey in this context, between 1987 and 1997 there was a 6.9% drop in the total farmland acreageReference Tubene1. This puts New Jersey farmers at a competitive disadvantage against larger commodity growers from other states where production costs are comparatively lower. There is a need to look for alternative and high-valued or specialty/ethnic crops with competitive advantages. Specialty and ethnic vegetables are defined as vegetables and/or herbs that are not traditionally grown in the US but are imported to the US and are currently grown on a limited scale in the US (e.g., Chili Jalapeno, Tomatillo, Calabacita, Aji Dulce and Batata).
According to the Census Bureau of the United States, the Hispanic population mushroomed by 58% from 1990 to 2000, making it the fastest-growing minority group in the US. The Hispanic or Latino population grew from about 9% of the country's population in 1990 to 13% in 2000, with 35 million people (Census 19902 and 20003). It is projected that the Hispanic population will make up 30% of the US population in 2050 (US Census Bureau4). Therefore, it is important to explore the potential market opportunities for local producers of ethnic products in targeting Hispanic consumers. This information would prove useful for not only east-coast producers, but also producers in other states and regions experiencing rapid growth in minority populations, especially Hispanics. The growth of Hispanics is largely being fueled by immigration. The growing immigrant population also brings about a niche market demand for familiar foods of their homelandsReference Ariyawardana, Govindasamy and Puduri5, Reference Govindasamy and Puduri6. This creates a market for such produce fueled by the increasing number of consumers eager to purchase them. The increasing immigrant population has also led to an increase in the number of produce stores that cater to the ethnic population in the region. Studies conducted throughout the region have shown that growing demand for ethnic produce provides a potential opportunity for farmers in the regionReference Tubene1, Reference Govindasamy, Nemana, Puduri and Pappas7–Reference Sciarappa10.
In recent years, consumers have been showing much interest in locally grown produce. There are several reasons to buy locally grown produce items. The consumption of locally grown produce not only supports local farms but also provides fresh produce to consumers within hours after harvest. The local produce is fresh and much tastier than produce sold in a traditional grocery storeReference La Trobe11. Consumers are gradually becoming aware of the flavor, freshness and quality of locally grown produce items, and learning about the nutritional value of foods. Local foods are generally healthier, because they are not extensively processed with preservatives and chemicals. Normally, small-scale farmers do not use chemicals and preservatives, because they are more concerned with quality rather than quantity of the foods they produceReference Holmes12. The survival of industrial agriculture largely depends on the low-energy prices and cannot continue for ever. The term ‘food miles’ refers to the distance food travels in order to reach the ultimate consumer. According to HendricksonReference Hendrickson13, the average fresh food travels 1500 miles to reach consumers. The transportation of fresh produce uses a substantial amount of non-renewable energy resourcesReference Nestle14. Most of the fresh produce is transported by truck and the transportation cost of produce is making the US increasingly dependent on foreign oil resources. The US food system accounts for about 16% of the total US energy consumptionReference Canning, Charles, Huang, Polenske and Waters15, Reference Heller and Keoleian16, and much of this energy is derived from burning fossil fuels that release carbon dioxide and other greenhouse gases. The sale of local produce at local markets reduces the usage of transport fuel and protects biodiversity.
Farmers' markets have been playing an important role in selling locally grown foods. Consumer awareness and interest in local foods indicate the continued growth of the number of farmers' markets, which increased from 1775 in 1994 to 5274 in 200917. This trend makes grocery chains sell locally grown products18, 19.
In addition, all the state's agricultural departments in the US increased participation in promoting locally grown foods to support local agriculture. Previous research suggested that at least some of these state-sponsored programs have been successful. In the case of New Jersey, the Jersey Fresh program showed a $32 return for produce growers for every dollar invested in the programReference Govindasamy, Schilling, Sullivan, Turvey, Brown and Puduri20. The small farmers and the local economy have been receiving greater benefits by selling local foods. The Northeast Ohio Foodshed Network estimates that for every dollar spent on local food purchases, $1.94 to $3.98 additional dollars flow into the local economyReference Holmes12.
The above-mentioned reasons influence the consumer's overall purchasing decisions. Most consumers look for attributes such as buying locally, promoting good health, protecting the environment and supporting the local economy. Since no information has been documented about the exact magnitude and drivers of Hispanic consumer preferences toward locally grown products, this study cited general consumers' preferences. A survey conducted in Iowa, Missouri, Nebraska and Wisconsin shows that consumers were interested in buying locally grown produce21. The Jersey Fresh program is one of the leading examples of state-sponsored agricultural promotion to encourage locally grown produce. According to the survey results of New Jersey, respondents had a preference for Jersey Fresh produce and indicated that they believed it to be better than other produce in terms of quality and freshnessReference Govindasamy, Pingali, Italia and Thatch22. The objective of this study is to identify and estimate the influence of Hispanic ethnic consumers' socio-economic and value attributes on their behavior and perceptions toward produce grown on local farms.
Conceptual Framework
Hispanic ethnic consumers face a choice between willingness (W) and indifference (D) to buy locally grown fruits and vegetables. Utilities derived from buying local are given by U W and U D, respectively, which are not observable. The observable variables are process attributes a (a=W, D) and a vector of consumer characteristics (x). The utility of consumer i is postulated as follows:

where Uai is the latent, unobserved utility for choice alternative a, Vai is the explainable part of the latent utility that depends on the chosen process with attributes a and personal characteristics of consumer i, and εai is the random or ‘unexplainable’ component of the latent utility associated with the choice of product attribute a and consumer i.
Consumer i's choice ordering between willingness and indifference towards locally grown fruits and vegetables (i.e., between attributes W and D, respectively) is modeled in the following way: consumer i ranks local produce in one of the three categories based on the indicator function:

where Zi can be interpreted as the additional utility derived by ith consumer by choosing to buy locally grown produce over indifference. A consumer expresses his/her willingness to buy locally grown produce if Zi is below some threshold value (e.g., μ1), shows indifference if Zi is above μ1 but below another threshold value μ2 and reveals willingness to buy produce if Zi is above μ2. Formally, consumer i's choice ordering (denoted by Yi, where Y=1 implies willing to buy produce, Y=2 implies indifference and Y=3 implies less willing to buy produce) can be expressed as follows:

Since part of the utility is random in nature, a researcher cannot perfectly predict the choice of a consumer. From the researchers' perspective, the problem is inherently stochastic, which naturally leads to formulating the ith consumer's choice problem in probability terms:

Under the assumption that the random term (εwi−εDi) follows the standard normal distribution, the above probabilistic model is the well-known ordered probit model.
In an empirical estimation, the indicator Zi for the ith consumer is modeled as a function of his/her socio-economic and value attributes and can be expressed as

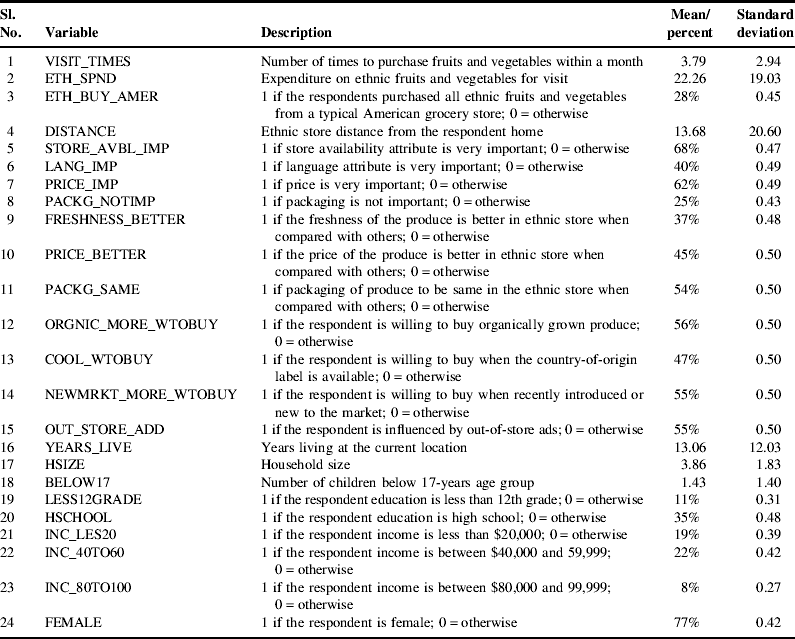
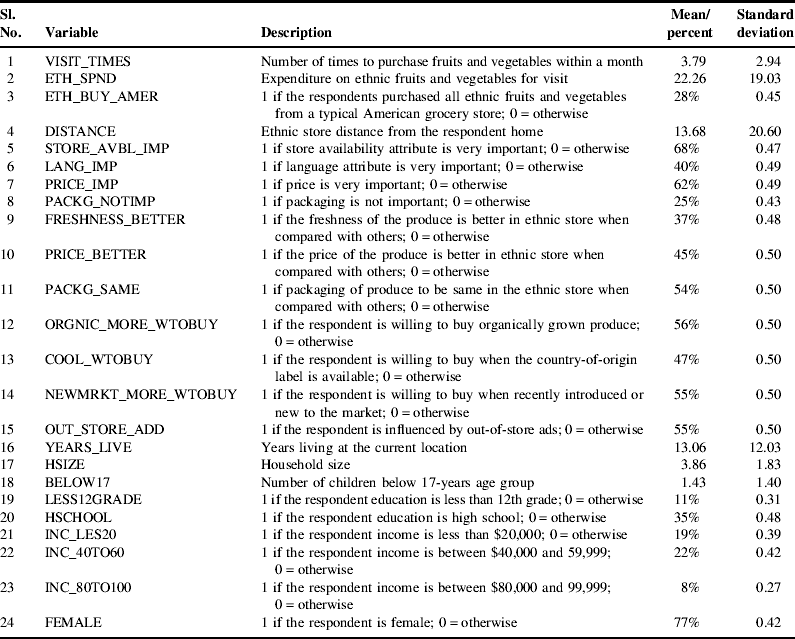
where xij is the jth attribute of the ith respondent, β=(β0, β1, …, βk) is the parameter vector to be estimated and ν is the random error or disturbance term. The model explanatory variables are explained in Table 1. In this setting, the probabilities of choice for Yi=1, 2 and 3 are given by
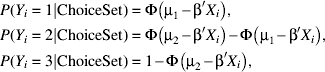
where Φ is the cumulative function of a standard normal distribution. In the above model, the μ's are unknown threshold parameters that separate the adjacent rankings or categories. In the empirical estimation stage, both the β-vector and the μ's are estimated jointly using the maximum likelihood (ML) procedureReference Greene23.
Description of explanatory variables.
The estimated β-coefficients of equation (5) does not directly represent the marginal effects of the independent variables on the probabilities of choice. The marginal effects are given by the following expression (assuming continuous explanatory variables):

where φ is the density function of the standard normal variable. In the case where the explanatory variable is discrete or categorical in nature, the marginal effect of such a variable is obtained by evaluating the probabilities at alternative values of xij. The coefficient estimates are not equal to the marginal effects of the explanatory variables x on the probabilities. The marginal effects of the explanatory variables are calculated in the following manner:

where f(.) is the standard normal density. The marginal effects of the dummy variables are calculated as the difference between two resulting probabilities when the dummy variable equals its two values 0 and 1 (Nayga et al.Reference Nayga, Poghosyan and Nichols24).
The following empirical model is used to estimate the relation between the probability of consumer perception toward willingness to buy produce grown on local farms and his/her personal attributes:

where Yi=0 if the respondent is willing to buy locally grown produce, Yi=1 if the respondent is indifferent to buying locally grown produce and Yi=2 if the respondent is less willing to buy locally grown produce.
The vector of explanatory variables in equation (5) included socio-economic and demographic characteristics of the Hispanic consumer as well as variables related to consumers' perceptions and motivation. The socio-demographic characteristics of Hispanic consumers included in equation (5) were expected to be similar to those influencing consumer expenditures on fruits and vegetables in general (e.g., NaygaReference Nayga25) and those included in other analyses of consumer preferences for local products (e.g., Jekanowski et al.Reference Jekanowski, Williams and Schiek26). In addition, consumer perceptions and motivations toward locally grown Hispanic ethnic produce items were also hypothesized to influence their choice.
Data Description
The data were collected from an ethnic produce survey prepared for Hispanic ethnic group including Mexicans and Puerto Ricans. Sixteen states (Connecticut, Delaware, Florida, Georgia, Massachusetts, Maryland, Maine, North Carolina, New Hampshire, New Jersey, New York, Pennsylvania, Rhode Island, South Carolina, Vermont and Virginia) and Washington DC were selected from east-coast US and based on random sampling, 541 respondents were interviewed by a private company to collect data using a computer-assisted telephone survey in 2006. In addition to consumer-valued attributes and attitudes, respondents were asked about perceptions pertaining to willingness to buy produce grown on local farms. Residents in the household who were primarily responsible for produce purchasing decisions were interviewed.
Summary Statistics
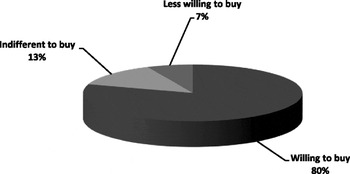
According to the survey results, overall, 80% of the respondents were willing to buy locally grown produce, 13% of them were indifferent to buying locally grown produce and only 7% of them were less willing to buy locally grown produce (Fig. 1).
Hispanic ethnic respondents' intensity of willingness to buy locally grown produce.

The mean values mentioned in this paper were based on the available observations after deleting the missing values from the dependent variable (Table 1). On an average, each respondent visited ethnic stores 3.8 times per month to purchase produce (VISIT_TIMES). Each Hispanic respondent spent about US$22.26 per visit on produce (ETH_SPEND). The average distance from residence to grocery store (DISTANCE) was about 13.68 miles. About 28% of the respondents purchased ethnic produce from typical American grocery stores (ETH_BUY_AMER). About 68% of the respondents reported that the store availability (STORE_AVBL_IMP) is very important to them and 40% of them felt that the language attribute (LANG_IMP) is very important when they visit the store.
Furthermore, 62% of them preferred price (PRICE_IMP), 25% of them preferred ethnic stores for packaging (PACKG_NOTIMP) and 37% for freshness (FRESHNESS_BETTER). When the respondents were asked whether they find the Hispanic ethnic outlets to be better than the conventional stores in terms of fruits and vegetables, approximately 45% of them felt that price is better (PRICE_BETTER). While, in the case of packing (PACKG_SAME), 54% of the respondents felt that the packaging of produce was the same in ethnic stores when compared with other conventional stores. In terms of willingness to buy, 56% of the survey respondents were willing to buy organic produce (ORGNIC_MORE_WTB), 47% of them were willing to buy country-of-origin-labeled produce if available (COOL_MOREWTB) and 55% of the respondents were willing to buy recently introduced produce or new to the market (NEWMRKT _WTB). In terms of influence of the promotional materials, 55% of the respondents were influenced by out-of-store advertisements (OUT_STORE_ADD). The respondents' average years of living at the current location (YEARS_LIVE) was about 13 years. The average number of people per household from survey (HSIZE) was 3.86 persons, whereas the average was 3.5 persons in the 2000 US Census, compared to national average (3) during the same period27. The average number of children below the age of 17 years (BELOW17) was 1.43 persons in a family, whereas the census average was about 1.78 children below the age of 18 years in 2000, which consists of one-third of the total US Hispanic population. About 11% of the respondents had education less than 12th grade and 35% of them had high-school education (HSCHOOL). In terms of income, 19% of the survey respondents had income less than $20,000 (INC_LES20), 22% had income between $40,000 and $59,999 (INC_40TO80) and only 8% of them had income between $80,000 and $99,999 (INC_80TO100). No prior assumption was made about the effect of income on an individual consumer's willingness to buy locally grown produce. About 76% of the respondents were female (FEMALES). No prior assumption was made regarding the effect of gender variation on the dependent variables.
Model Estimation Results
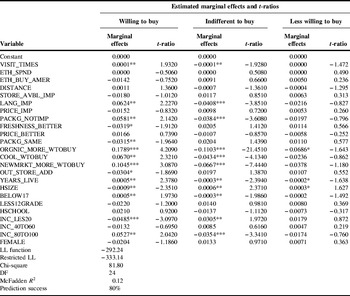
Table 2 shows the estimated model marginal effects of the explanatory variables along with their estimated t-ratios. The table also shows the estimated values of unrestricted (i.e., full model) and restricted (i.e., slope coefficients are zero) log-likelihood function, Chi-square statistics of model significance, McFadden's R 2 and the model prediction success rate. The Chi-square statistic of overall model significance is 81.80, which is clearly greater than the 95% critical value for this test. Therefore, the model has significant explanatory power. The McFadden's R 2 is 0.12 with 80% prediction of success and the overall model is highly significant (at 0.00). The ordered probit model results in terms of marginal effects and explains the direction of willingness to buy locally grown produce.
Willingness to buy locally grown fruits and vegetables: ordered probit model estimates.

* α=0.10, ** α=0.05, *** α=0.01.
According to the model estimation, those who visited an ethnic store more frequently (VISIT_TIMES), those who felt ethnic language attribute (LANG_IMP) is very important at the store to make a purchasing decision, those who viewed packaging as not important (PACKG_NOTIMP), those who were willing to buy organic produce (ORGNCI_MORE_WTOBUY) and country-of-origin-labeled (COOL_WTOBUY) produce, those who were willing to buy produce when recently introduced or new to market (NEWMRKT_MORE_WTOBUY), those who had lived longer at the current location (YEARS_LIVE), those with more children below the 17-year age group (BELOW17) and those with income between $80,000 and $99,000 (INC_80TO100) were more likely/willing to buy locally grown produce. Furthermore, those who thought that the freshness of produce is better in ethnic stores when compared with other conventional stores (FRESHNESS_BETTER), those who viewed packaging of produce to be the same in ethnic stores when compared with other conventional stores (PACKG_SAME), those who were influenced by out-of-store advertisements (OUT_STORE_ADD) and those with bigger household size (HSIZE), and those with income less than $20,000 (INC_LESS20) were less likely to be associated with willingness to buy locally grown produce. However, the model also indicates that variables, such as ethnic produce expenditure, respondents who buy all ethnic produce from typical American grocery stores, ethnic store distance, store availability, price, education, income of US$40,000–60,000 and gender do not have any significant impact on the willingness to buy locally grown ethnic produce.
The marginal effects in Table 2 show how an increase of one unit of the independent variable changes the probability of willingness to buy locally grown ethnic produce when the independent variable is continuous. In case of a binary variable, the marginal effect shows how the probability of willingness to buy locally grown ethnic produce changes if the binary variable switches. For instance, the marginal effect of ORGANIC_MORE_WTOBUY at willingness to buy locally grown produce value Y 1 is 0.1789 (18%), which means that if ORGANIC_MORE_WTOBUY switches to the one who is willing to buy organic produce when compared with those who are not willing to buy, the probability of willing to buy locally grown ethnic produce will change by about 18%. The signs of the marginal effects are potentially ambiguous, except when Yi=0 or 2, which are unambiguous and opposite to each other (e.g., GreeneReference Greene28; Powers and XieReference Powers and Xie29). Taking into account this constraint when discussing the results, the pattern of signs of marginal effects over the willingness to buy locally grown ethnic produce is discussed below.
The marginal effect shows that those who spend more on ethnic fruits and vegetables (ETH_SPEND) are more likely/willing to buy locally grown ethnic produce. Since the magnitude of the marginal effect is not sizeable, the impact of ethnic expenditure is very limited on willingness to buy locally grown produce. Those who think that the language attribute is very important (LANG_IMP) are more likely/willing to buy locally grown produce than those who think otherwise. This is possibly because majority of Hispanics in America are immigrants and/or have spent a relatively short time in America and use English as a second language. Perhaps they prefer produce labels, customer service and advertisements in their native language. Those who think that packaging is not important (PACKG_NOTIMP) are more likely/willing to buy locally grown ethnic produce compared to those who have preference for packaging. Those who prefer organic produce (ORGNCI_MORE_WTOBUY) are more likely/willing to buy locally grown ethnic produce compared to those who think otherwise. Those who are willing to buy country-of-origin-labeled (COOL_WTOBUY) produce are more likely to buy locally grown ethnic produce than those who are not willing to buy COOL products. Those who are willing to buy a recently introduced product (NEWMRKT_WTB) are more likely to buy locally grown ethnic produce than those who are not willing to buy recently introduced products. Those who have lived longer at the current location (YEARS_LIVE) are more likely/willing to buy locally grown ethnic produce compared to those who did not. Those with more children below the 17-years age group (BELOW17) in a household are more likely/willing to buy locally grown ethnic produce compared to those who have fewer children below that age group. Those with an income between $80,000 and $99,000 (INC_80TO100) are more likely/willing to buy locally grown produce compared to those who have an income over $100,000.
The subsequent consumer attributes have a negative impact on willingness to buy locally grown ethnic produce items. The marginal impact shows that those who think that the freshness of produce is better in ethnic stores when compared with other conventional stores (FRESHNESS_BETTER) are less likely/willing to buy locally grown ethnic produce items compare to those who think otherwise. Those who consider packaging of produce to be the same in ethnic stores when compared with other conventional stores (PACKG_SAME) are less likely/willing to buy locally grown ethnic produce items when compared with those who think otherwise. Those who are influenced by out-of-store advertisements (OUT_STORE_ADD) are less likely/willing to buy locally grown ethnic produce items when compared with those who are not influenced by out-of-store advertisements. Those who have a bigger household size (HSIZE) are less likely/willing to buy locally grown ethnic produce items when compared with those who have a smaller family size. Those who have an income less than $20,000 (INC_LESS20) were less likely to be associated with willingness to buy locally grown produce when compared with those who have an income higher than $100,000.
Summary
According to the survey results, overall, 80% of the respondents were willing to buy locally grown produce, 13% of them were indifferent to buy locally grown produce and only 7% of them were less willing to buy locally grown produce. The high positive percentage indicates the intensity of consumers' interest toward buying locally grown produce. As the model results indicate, those who prefer ethnic language at a store were positively associated with willingness to buy locally grown produce. The results also indicated that those who felt that packaging is not important were positively related with willingness to buy locally grown produce. Those who were willing to buy organic produce were positively associated with willingness to buy locally grown produce. As the results indicate, those who prefer to buy when country of origin is labeled were positively associated with willingness to buy locally grown produce. Respondents who were willing to buy produce when recently introduced or new to market and those with income of between $80,000 and $99,000 were also positively associated with willingness to buy locally grown produce.
Acknowledgements
This project was supported by the National Research Initiative of the National Institute of Food and Agriculture, USDA, Grant No. 2005-35618-15735. The authors would also like to extend their thanks to anonymous reviewers for thoughtful comments and recommendations that improved the quality of this article.