Conventional linear paradigm in acoustical diagnostics
Vibro-acoustic and ultrasonic methods have found numerous applications in nondestructive testing (NDT) and materials characterization.Reference Cawley1 The sizes and scales of vibro-acoustically probed volumes range over orders of magnitude from fractions of a millimeter in acoustic microscopy to 102–103 m in engineering vibro-acoustic applications, and even greater scales in seismoacoustic sounding. These methods open the possibility to detect and evaluate individual or spatially averaged parameters of such structural heterogeneities as voids (pores), cracks, and delaminations. Their characterization is important since such structural features often strongly weaken the material strength, but yet, before the onset of fracture, they may noticeably affect elastic-wave velocities and absorption, shift resonant frequencies, and cause ultrasound scattering, all of which can be used for nondestructive detection/evaluation of the heterogeneities.
Resolution of acoustic methods (defined by the ability to distinguish neighboring structural features) may range from the entire size of samples tested by observing damage-induced changes in their resonance frequencies (such samples may be rather big for low-frequency vibro-acoustic measurements) down to essentially submicrometer scales for acoustic microscopy operating at frequencies of ∼102 MHz. However, even for waves with much lower frequencies and greater wavelengths, vibro-acoustically detectable boundaries and especially discontinuities (such as cracks and delaminations) may have a thickness much smaller than the wavelength (even submicrometer openings). If their lateral size is not too small compared to the acoustic wavelength, the echo-signals from such thin defects may be easily measurable. However, distinguishing signals from a thin crack and similar-in-size cylindrical/spherodical holes/cavities may be challenging.
The most widely used acoustic NDT method is the pulse-echo ultrasonic detectionReference Cawley1 of macroscopic cracks and voids. Acoustic microscopy uses the same pulse-echo principle, only downscaled in the probing-wavelength to explore structural features down to the micrometer scale. In some special cases, however, even essentially subwavelength heterogeneities (e.g., gas bubbles in liquids) may produce rather strong scattering and, thus, can be readily detected acoustically. In recent years, this effect has become widely used in medical ultrasound for improving blood-vessel imagingReference Rudenko2 by injecting micrometer-sized artificial encapsulated “bubbles” in blood that produce strong scattering of waves at ∼100× greater wavelengths ranging from ∼150–300 μm.
The acoustic effects previously mentioned, conventionally exploited in acoustic diagnostics, are linear. They obey the superposition principle—they can be described within the paradigm implying that two superposed acoustic perturbations do not affect propagation/scattering conditions for each other. Correspondingly, for this description, the stress–strain relationship for the medium is approximated by the linear Hooke’s Law (see the beginning of the thick solid curve in Figure 1a), which is a natural approximation given that “typical” acoustic strains in solids usually do not exceed 10–6 even for fairly intense perturbations.
(a) “Typical” stress–strain curve for a solid with initially linear Hookean behavior, with nonlinear-elastic deviation from Hooke’s Law, followed by the strength threshold and fracture (characteristic strain ranges are indicative and may significantly differ for various materials). Dashed arrows illustrate local enhancement of strain at highly compliant inclusions. (b) Rheological model of a heterogeneous material with a small concentration  $\upsilon \siml/L < < 1$ of soft inclusions at which deviations from the linear Hooke’s Law as well as dissipation are mostly localized due to strongly increased strain; relative compliance of a defect is characterized by small parameter
 $\varsigma < < 1$, so that the local modulus of the soft defects/inclusion is
 ${E_{def}} = \varsigmaE < < E$(where
 $E$ is the modulus of surrounding matrix);
 ${\varepsilon _1}$ is the local strain; nth order local nonlinearity parameters of the defects are
 $\beta _n^{def}$, so that by analogy with Equation 1, the lowest-order local nonlinear correction to Hooke’s Law is
 $F({\varepsilon _1}) = {E_{def}}\beta _2^{def}\varepsilon _1^2$. (c) Relative complementary variations in the linear elastic modulus
 ${E_{eff}}$ and quadratic nonlinear parameter
 $\beta _2^{eff}$ of the heterogeneous material as a function of concentration,
 $\upsilon$. Notice the region of concentrations marked by the dashed-line rectangle,
 $\upsilon < \varsigma$, where nonlinearity already strongly increases, whereas the linear elastic modulus
 ${E_{eff}}$ still remains close to modulus
 $E$ of intact homogeneous matrix.

This linearized description of acoustic perturbations does not contradict the results of characterization of materials strength, for which 2–4 orders of magnitude greater strains are used in standard quasistatic loading tests (e.g., tensile or three-point loading). At the higher strain range, the stress–strain relationship already demonstrates appreciable deviation from the linear Hookean behavior, initially in the form of reversible elastic nonlinearity (roughly up to strains of ∼10–4–10–3). For even larger strains, the material approaches the damage threshold with the appearance of a descending branch in the stress–strain dependence (see thick solid curve in Figure 1a). The actual strain range for this transition from the nonlinear-elastic behavior to the onset of fracture may noticeably vary for different solids, from ∼10–3 to 10–2 for brittle solids such as glasses or rocks to ∼10–1 for metals allowing noticeable plastic deformation. From a microscopic viewpoint, the initial (yet reversible) macroscopically observed deviation of the stress–strain curve from linear behavior is clearly related to the deviation of the interatomic interaction potential from nearly ideal parabolic form around the equilibrium position.
At this initial stage, the nonlinear stress–strain curve, σ(ε), can be approximated by a power expansion, that in the simplest one-dimensional representation has the form:
 $$\sigma = E(\varepsilon + {\beta _2}{\varepsilon ^2} + {\beta _3}{\varepsilon ^3} + ...).$$(1)
Here,  $E$ is the elastic modulus, and dimensionless quantities β2 and β3 are quadratic and cubic dimensionless parameters of nonlinearity, respectively. Particular values of these nonlinearity coefficients typically are on the order of several units (i.e., fall into the range 100–101) and do not strongly depend on the details of the interatomic potential.
This means that for typical acoustic strains of ε ∼ 10−7−10−6, the nonlinearity-related corrections in the stress–strain relationships are expected to be many orders of magnitude smaller than the main linear term and are often considered negligibly small. However, actual manifestations of these nonlinear corrections are well known even in everyday life—the quadratic nonlinearity parameter β2 is responsible for thermal expansion (the latter can be viewed as rectification of thermal lattice oscillations); the cubic parameter β3 similarly determines the temperature dependence of the elastic-wave velocities.Reference Kittel3 Typical experimentally observed magnitudes of these temperature-dependent effects agree fairly well with the expectation that β2 and β3 are on the order of several units, as adopted in classical theories of nonlinear elasticity based on power-law nonlinear corrections to the linear Hooke’s Law.Reference Landau and Lifshitz4
It is also known that under appropriate conditions (e.g., for a nondispersive intense acoustic wave propagating along a sufficiently long path), nonlinear distortions of a wave profile may accumulate up to the formation of a shock wave even for nonlinearity parameters on the order of several units.Reference Rudenko and Soluyan5,Reference Naugolnykh and Ostrovsky6 This concept of weak nonlinearity in acoustics, which has been consistently supported by both acoustic data and temperature-dependent effects, is reflected in many textbooks and reviews.Reference Zarembo and Krasilnikov7 However, a critical mass of experimental facts that demonstrated drastic inconsistency with such apparently well-justified representations had been gradually accumulating from the 1970s to the 1990s.
Emergence of strong nonlinearity paradigm: Why is “structural sensitivity” of acoustic nonlinearity so high?
The first direct experimental demonstrations of acoustic second-harmonic generation in solids appeared in the 1960s to the 1970s. These observations qualitativelyReference Breazeale and Thompson8 and even quantitativelyReference Gedroits and Krasilnikov9 supported the power-law representation of the weak atomic nonlinearity previously outlined. However, other cases demonstrated clear inconsistenciesReference Gedroits, Zarembo and Krasil’nikov10–Reference Morris, Buck and Inman13 with this paradigm of weak atomic nonlinearity. The acoustic nonlinearity appeared to be extremely high, even though the linear elastic properties remained “normal.”
Gradually, it became clear that the paradigm of weak nonlinearity is mostly applicable to ideal crystals, homogeneous amorphous and “tight” (i.e., without weak defects) polycrystalline solids. In contrast, a large number of other solids, such as almost all rocks and various construction materials (e.g., concrete, metals with fatigue damage, and composites with delaminations) with heterogeneous structures and/or faults, demonstrate much higher nonlinearity even for moderate range of strains ∼ ${10^{ - 6}}-{10^{ - 5}}$ and even lower (typical of acoustic perturbations), in other words, strains that are yet several orders of magnitude below the damage threshold. These data lead to the conclusion that for heterogeneous solids, the nonlinear acoustic parameters β2 and β3 may demonstrate orders of magnitude higher levels than just several units, even for minor concentrations of certain types of structural defects and heterogeneities. Such defects (cracks, grain boundaries, and contacts/delaminations) have sizes much smaller than the sample size and acoustic probing wavelength. Furthermore, besides a quantitative increase, the functional (qualitative) character of such microstructure-induced nonlinearity often demonstrates strong deviation from the conventional power-law dependence given by Equation 1. To emphasize its peculiarities, such nonlinearity is often called “nonclassical”Reference Guyer and Johnson14 or nonanalytical. In particular cases, the nonlinearity of such solids may be hysteretic or demonstrate a “clapping” nonanalytic character, or can be essentially dissipative, as discussed in what follows.
It is important to emphasize that in contrast to cracks, contacts, delaminations, and other “weak” structural features, the presence of designed technological holes, tight undamaged connections (such as high-quality welding or gluing) or other geometrical features unrelated to the weakening of the material microstructure and strength, does not affect nonlinear properties of the sample. However, such features may produce acoustic scattering much stronger than the previously mentioned “weak” defects. Therefore, observation of strongly increased and qualitatively “nonclassical” nonlinearity opens the possibility for highly sensitive and highly selective detection of cracks and other defects that are considered deleterious from the viewpoint of material strength.
Although many observations of nonclassical nonlinearity were reported in the 1990s and 2000s, the nonlinear trend in the development of vibro-acoustic diagnostic methods is still emerging. However, it is attracting the attention of an ever-increasing number of researchers and engineers, especially for NDT applications. High “structural sensitivity” of nonlinear acoustic methods is now supported by numerous demonstrations, so that almost every pertinent publication contains a claim similar to the following:Reference Johnson15 “Linear methods in acoustical nondestructive testing rely on either reflected wave energy from a crack, wave speed changes and/or amplitude changes. None of these linear wave characteristics is as sensitive as the nonlinear response of the material.”
However, despite numerous experimental studies, numerical simulations of acoustic-wave interactions with cracks of ever-increasing complexity,Reference Rjelka, Köhler and Mayer16 and numerous theoretical discussions,Reference Rudenko2,Reference Nagy17–Reference Marcantonio, Monarca, Colantoni and Cecchini19 the reasons for the drastic difference in “structural sensitivity” between the linear and nonlinear acoustic effects often remains insufficiently addressed. In what follows, we focus on this important, but rarely discussed in the literature question and point out the main trends in the nonlinear-acoustic (NA) diagnostic methods that look most promising for various applications.
Putting aside technical details for a while, it can be said that the presence of a small amount (a clearer definition of “small” is given next) of highly compliant (soft) subwavelength structural features/inclusions is responsible for the strong increase in nonlinearity of heterogeneous materials. Typical examples of such features/inclusions are cracks/delaminations and contacts that may occur inside cracks or at interfaces between grains in materials with a granular structure. In contrast, inclusions with an effective stiffness greater (or comparable to) than that of the homogeneous matrix material (including manufactured holes or spheroidal voids with deformability close to that of the matrix) practically do not affect material nonlinearity. A special case is that of “nearly incompressible” materials with the Poisson’s ratio close to 0.5, in which even “equant” (i.e., spheroidal and cylindrical) pores are also soft and may strongly enhance the material’s nonlinearity.Reference Ostrovsky20
It is also sometimes stated that the previously mentioned nonlinearity enhancement is due to the “own high nonlinearity” of soft inclusions. However, it is a bit paradoxical that this formulation is not correct in its direct meaning. Actually, even soft inclusions/defects do not exhibit high nonlinearity in terms of their local stress–strain relationship, written in a form similar to Equation 1,  $\sigma = {E^{def}}({\varepsilon _1} + \beta _2^{def}\varepsilon _1^2...)$, where
 ${E^{def}}$,
 ${\varepsilon _1}$, and
 $\beta _2^{def}$ are the local elastic modulus of the soft defects, its local strain, and its own (local) parameter of quadratic nonlinearity, respectively. It should be emphasized that the local nonlinearity parameters of nth order,
 $\beta _n^{def}$, remain normal in magnitude, approximately several units. An especially clear illustration of this is provided by a heterogeneous material such as water (as a limiting case of materials with the Possion’s ratio approaching 0.5) containing highly compressible air bubbles. Water with bubbles exhibits high acoustic nonlinearity,Reference Rudenko and Soluyan5 although both components—pure water and air—have normal and rather low nonlinearity with the quadratic nonlinear parameter β2 having values of approximately several units.
A key point for nonlinearity enhancement is that soft inclusions should be embedded in a much stiffer matrix and subjected to straining with a characteristic spatial scale greater than inclusion sizes. Even if the average strain in such a material is fairly small (e.g., those that fall into acoustic strain range < ${10^{ - 6}}-{10^{ - 5}}$), the embedded soft inclusions may be deformed more strongly by orders of magnitude. For example, in the case of water and air bubbles with a compressibility of
 $\sim{10^3}-{10^4}$ times greater than for water alone, the deformation of bubbles correspondingly is
 $\sim{10^3}-{10^4}$ times higher than the average. Similarly, high contrast between the average and local strains often occurs near the tips of loose contacts and thin cracks in rocks. Simply put, in terms of the nonlinear stress–strain diagram in Figure 1a, it can be said that due to high contrast in compliance between the matrix material and soft inclusions, the local strains of the latter are strongly transformed from the linear region corresponding to average small strain toward the highly nonlinear region (in some cases, up to complete local rupture). This local strain enhancement may potentially lead to a strong increase in the average nonlinearity of the material.
To understand and quantify the difference in the complementary variations in the macroscopic nonlinear and linear parameters, a simple rheological model (shown in Figure 1b) may be useful. Although various models with elastic elements and viscous/frictional dashpots are widely known (e.g., the famous Maxwell body and Kelvin–Voight body),Reference Kolsky21 the principal feature of the model in Figure 1b is that it directly accounts for the material heterogeneity. The majority of elastic elements corresponding to the matrix material are relatively stiff (and can be considered fairly linear with the elastic modulus E), whereas soft inclusions with relative content υ << 1 (volumetric or linear as in Figure 1b) have a much smaller elastic modulus ζ*E<<E (characterized by compliance parameter ς << 1). Consequently, for soft inclusions, their local strains are ς–1>> 1 times greater, so that deviations from Hooke’s Law, as well as viscous/frictional losses, are mostly localized at these soft structural features (which in real materials may correspond to inclusions such as bubbles, or defects such as cracks and delaminations as discussed next in particular examples). This simple model allows one to obtain useful, nontrivial predictions concerning complementary variations in the linear and nonlinear properties of heterogeneous materials.Reference Zaitsev22,Reference Belyaeva and Zaitsev23
For example, in the low-frequency limit (i.e., neglecting losses), it is especially simple to write the elastic energy accumulated in the heterogeneous system shown in Figure 1b. By differentiating it with respect to strain, one obtains the complementary variations in the elastic moduli of various orders that exhibit different dependences on the concentration, υ, of the defects and their compliance parameter ς:
 $${E_{{\rm{eff}}}}/E = 1/(1 - \upsilon + \upsilon /\varsigma )\,{\rm{and}}\,\beta _n^{eff}/\beta _n^{{\rm{def}}} = {{\left( {1 - \upsilon + \upsilon /{\varsigma ^n}} \right)} / {{{\left( {1 - \upsilon + \upsilon /\varsigma } \right)}^n}}}$$.
Here, subscript “eff” denotes parameters of the heterogeneous medium;  $E$ is the elastic modulus of the homogeneous matrix for which nonlinearity can be neglected;
 $\beta _n^{def}\sim{10^0}$ is the defect’s own nth order nonlinearity parameter (defined via local defect strain). The linear modulus E eff exhibits monotonic fairly slow dependence on concentration υ. In contrast, nonlinear parameters
 $\beta _n^{eff}$ demonstrate a strong maximum on the order ∼ς–(n–1) >>1 for very small concentrations υ << 1. For example, the quadratic parameter
 $\beta _2^{eff}$ reaches maximum
 $\beta _2^{eff} = 1/4\varsigma &gt; &gt; 1$ for small optimal concentration υ(opt) = ς as shown in Figure 1c. For diagnostic applications, it is important to emphasize that there is a range of even smaller concentrations, υ < ς << 1, where the linear modulus remains almost unperturbed (
 ${E_{eff}}/E \approx 1$, whereas the nonlinear parameter
 $\beta _2^{eff}$ (and, moreover, higher-order ones) may already exhibit a strong increase. Thus, the simple rheological modelReference Zaitsev22,Reference Belyaeva and Zaitsev23 provides clear (and quantifiable) insight into the difference between the “structural sensitivity” of linear and nonlinear elastic properties. For particular types of defects (such as bubbles, thin cracks, contacts, or their combinations), the parameter of compliance ς and concentration υ can readily be related to specific physical characteristics, and the ultimate nonlinearity level for a particular defect type can be estimated (e.g., for cracks).Reference Belyaeva and Zaitsev24
It is also important to emphasize that retaining non-instantaneous relaxation of defects (depicted as the strain-rate-dependent dashpot in Figure 1b), opens the possibility to analyze interesting frequency-dependent propertiesReference Zaitsev, Nazarov and Belyaeva25,Reference Nazarov, Zaitsev and Belyaeva26 that are intrinsic to microstructure-induced nonlinearity, in contrast to frequency-independent atomic nonlinearity. Furthermore, the rheological model in Figure 1b also describes strong dependence of acoustic dissipation on the material strain in micro-inhomogeneous solids, even if the dissipation at the high-compliance defects is linear in origin.Reference Zaitsev and Matveev27
These rheology-based predictions concerning amplitude-dependent acoustic dissipation are consistent with physical models of thermoelastic losses in solids containing cracks and contacts.Reference Fillinger, Zaitsev, Gusev and Castagnède28,Reference Zaitsev, Gusev and Castagnede29 Further, the nature of hysteretic nonlinearity and so-called slow dynamics in acoustically activated micro-inhomogeneous solids, experimentally observed for a broad class of heterogeneous solids,Reference Guyer and Johnson14,Reference Nazarov, Ostrovsky, Soustova and Sutin30–Reference Johnson and Sutin32 can readily be explained by accounting for bistable behavior of the soft defects. This bistability generically resembles that of atomic-force microscopy (AFM) tapping tips (with nanometer-scale radius), for which the bistable behavior is due to the interplay between the force attracting the AFM tip to the surface and equilibrating elastic force from a sufficiently soft supporting cantilever.Reference Dedkov33 However, for somewhat larger contacts present at crack surfaces or internal interfaces in materials with granular structure, the role of the soft cantilever is played by the material surrounding the contact point, so that transitions between the bistable equilibriums may be caused by acoustic (mechanical) oscillations and even thermal fluctuations.Reference Zaitsev, Gusev, Tournat and Richard34 Correspondingly, manifestations of such bistable contacts may look like either “instantaneous” hysteretic acoustic nonlinearity, or the slow destruction/restoration of ensembles of bistable bonds caused by fairly weak seismo-acoustic excitations and even thermal fluctuations. Such low-energy effects are actively discussed in seismo-acoustics both in the context of spontaneous healingReference Gassenmeier, Sens-Schönfelder, Eulenfeld, Bartsch, Victor, Tilmann and Korn35,Reference Snieder, Sens-Schönfelder and Wu36 and accumulation of damage up to the initiation of seismic events.Reference Johnson and Jia37
How to observe manifestations of microstructure-induced acoustic nonlinearity for NDT and material characterization
From the previous discussion, it is clear that observations of nonlinear acoustic effects can be used for selective and sensitive detection of highly compliant microstructural features that cause a strong increase in material nonlinearity, for which the simplest power-law forms are used in Equations 1 and 2. However, it should be understood that although the microstructure-induced variability of nonlinearity parameters (e.g.,  $\beta _n^{eff}$ in Equation 2) may be large, the nonlinear corrections
 $\beta _n^{eff}{\varepsilon ^n}$ to the stress–strain relationships also comprise higher orders of average strain,
 ${\varepsilon ^n}$. Since ε << 1 even for fairly intense acoustic waves, nonlinear corrections are usually small compared to linear terms:
 $\beta _n^{eff}{\left| \varepsilon \right|^n} &lt; &lt; \left| \varepsilon \right|$ (see Equation 1). Thus, even for
 $\beta _n^{eff} &gt; &gt; 1$, special measures are usually required to facilitate detection and evaluation of nonlinear terms variability caused by microstructure modifications.
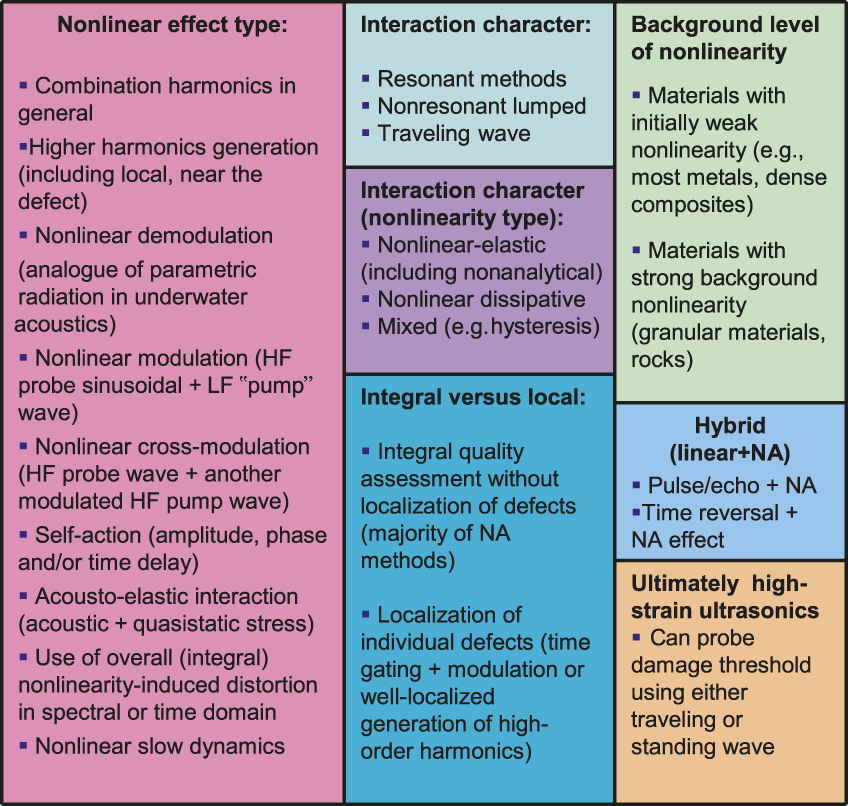
In a broad sense, nonlinearity of any system manifests itself through the violation of the superposition principle. Particular forms of this violation correspond to a rich variety of nonlinear acoustic effects. In many cases, this violation is convenient to observe in the spectral domain, where spectral components initially absent in the input signal spectrum are singled out. As schematically shown in Figure 2, nonlinear acoustic diagnostic methods can be subdivided into several groups according to various criteria (such as nonlinear effect type, ability to locate heterogeneities, or performing detection without location). These groups may partially overlap. In what follows, the main features of these groups are briefly discussed.
Classification of nonlinear acoustic (NA) methods (groups corresponding to different criteria may partially overlap). Note: LF, low frequency; HF, high frequency.

Concerning the ability of NA methods to perform integral versus local assessment of the examined sample, a general statement can be made that the overwhelming majority of nonlinear acoustic methods perform an integral nonlinearity estimation over the entire studied sample (which is often sufficient for product quality check or characterization of a material sample). Localization of areas with increased nonlinearity is a challenging problem, although a few demonstrations of local characterization with NA methods are known.
First, a hybrid nonlinear/pulse-echo approach can be considered, in which conventional pulse-echo sounding is combined with an additional “pump” excitation to cause crack “breathing” (i.e., modulation of its equilibrium opening). This modulates the scattering strength of the crack and results in modulation of the sequence of scattered pulses.Reference Kazakov, Sutin and Johnson38,Reference Kazakov39 The main advantage of this approach is that in addition to the detection of the defect location by using delays of the pulses, the appearance of their modulation allows one to distinguish soft “breathing” defects (cracks and fissures) from acoustically undeformable, linearly scattering objects (such as manufactured holes).
Another principle of local characterization of nonlinearity, especially interesting for inspecting composite plates with strong ultrasound absorption, is observation of local generation of high-order sinusoidal harmonics (up to orders of 5–7). Such harmonics may be efficiently and locally generated under sufficiently intense excitation at clapping surfaces of cracks/delaminations in strongly absorbing samples. In the clapping regime, nonlinearity becomes nonanalytical (non-power law), leading to the generation of higher harmonics with amplitudes slowly decreasing as a function of harmonic order. In samples with strong dissipation (e.g., composite plates), such high-order ultrasonic harmonics poorly propagate and remain strongly localized near the harmonic-generating defect. Thus, spatial mapping of high-order harmonic intensity using scanning optical vibrometers allows for the simultaneous detection and location of the defect (see examples in References Reference Rudenko2, Reference Krohn, Pfleiderer, Solodov and Busse40, and Reference Krohn, Pfleiderer, Solodov, Busse, Rudenko and Sapozhnikov41).
A more exotic variant discussed in the literature is the use of time-reversal (TR) techniques that allow retro-radiation of received signals back to the source.Reference Fink, Cassereau, Derode, Prada, Roux, Tanter, Thomas and Wu42 Encouraging demonstrations of retro-radiation toward cracks demonstrate the utility of this approach for enhancing the nonlinear response even without knowing the position of the crack.Reference Le Bas, Ulrich, Anderson, Guyer and Johnson43 However, true TR-based location of nonlinearity sources remains challenging.
An overwhelming majority of other NA-based methods do not perform localization and are intended for high-sensitivity detection of either individual cracks or characterization of spatially distributed ensembles of compliant defects of any origin. In these methods, the interaction character may be different. In some cases, traveling waves may be used (e.g., in observation of amplitude self-action of seismo-acoustic wavesReference Zaitsev, Nazarov and Talanov44). In finite-sized samples, their resonant properties are often exploited, which helps to enhance the amplitude of the primary excitation, although resonance conditions for nonlinearly generated signal components may also be used.Reference Naugolnykh and Ostrovsky6,Reference Guyer and Johnson14,Reference Nazarov, Ostrovsky, Soustova and Sutin30
In terms of the nonlinear effect type, numerous variants of NA methods are possible, an overwhelming majority of which use signal analysis in the spectral domain to single out spectral components that are absent in the primary signal and should not appear in a linear sample.
Simple second-harmonic generation (first discussed in the 1960s)Reference Breazeale and Thompson8,Reference Gedroits and Krasilnikov9 can also be used,Reference Nagy17 but this variant is prone to masking technical nonlinearities (e.g., those of transducers and amplifiers), especially when using sufficiently intense primary waves. In certain variants, such signal distortions of technical origin are less critical or may be effectively reduced by using separated sources to ensure nonlinear mixing of acoustical/mechanical excitations in the material itself.
In the simplest case of two harmonic waves  ${\omega _{1,2}}$, combination frequencies
 $|{\omega _1} \pm {\omega _2}|$ can be observed. An especially interesting case is the asymmetrical case of
 $\omega /\Omega &gt; &gt; 1$, where
 $\omega = {\omega _1}$ and
 $\Omega = {\omega _2}$. In this case, combination frequencies
 $(\omega \pm \Omega )$ appear as modulation sidelobes around frequency
 $\omega$ of the primary probe wave. This has been a popular method since the mid-1990s,Reference Korotkov and Sutin45 convenient for integral evaluation of the sample state (intact/damaged) without the necessity to localize the defect. This variant is often called “nonlinear-wave modulation spectroscopy” (NWMS),Reference Van Den Abeele, Johnson and Sutin46 and the low-frequency intense excitation is often called “pump” (by analogy with nonlinear optics). The probe-wave frequencies are usually swept to ensure nonlinear interaction in the sample independent of the defect position (otherwise, for a defect occasionally coinciding with the acoustic-stress node, nonlinear-acoustic interaction may be strongly suppressed).
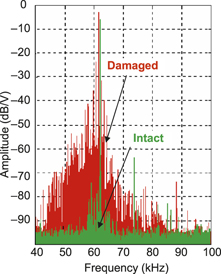
In samples with pronounced resonance properties, vibrations at eigenfrequencies excited by impact can be efficiently used as a pump. An impact-excited spectrum comprises a large number of resonant modes with different frequencies  ${\Omega _j}$ and spatial structures, which helps to ensure highly sensitive detection of a crack weakly dependent on its position. Figure 3 shows an example of large contrast between an impact-produced modulation spectrum for an intact railway-wheel axle and another one with a single hair-like crack <10 mm in size.Reference Zaitsev, Nazarov and Talanov47
Strongly increased modulation level for a railway axle with a single hair-like crack in comparison with an intact axle.Reference Zaitsev, Nazarov and Talanov47 The modulation is produced by a large number of axle eigenmodes excited by an impact.

Despite enhanced nonlinear interaction at cracks, the masking role of weak atomic nonlinearity should not be underestimated. Indeed, due to the much greater interaction volume for the spatially distributed atomic nonlinearity, the masking contribution of the latter may be significant. This means that the ultimate detection sensitivity is determined by the relative sample size with respect to the crack size, rather than directly by the crack size itself. Discussion of the ultimate sensitivity of resonant NWMS is presented in Reference Reference Zaitsev, Matveev and Matveyev48. In principle, the ultimate sensitivity can be additionally enhanced through reduction of the background modulation components  $(\omega \pm \Omega )$ by choosing special (orthogonal) structures of interacting modes for which the interaction at the masking distributed atomic nonlinearity of the undamaged material of the sample is suppressed. In contrast, for localized nonlinearity of individual cracks, the interaction of such modes may still be quite efficient.
The choice of orthogonal modes requires detailed analysis of the sample’s mode structure and can be rather problematic. An alternative to observation of the lowest-order modulation components  $(\omega \pm \Omega )$ can be the utilization of higher-order nonlinear interactions of three waves with different frequencies (a high-frequency wave with frequency
 $\omega$ and two low-frequency waves with frequencies
 ${\Omega _{i,j}}$) producing components
 $(\omega \pm {\Omega _i} \pm {\Omega _j})$. Such higher-order interactions may be fairly intense for nonanalytical nonlinearity of cracks, but for the masking power-law atomic nonlinearity, the contribution of higher-order interactions can be significantly reduced, so that the contrast between intact and damaged samples can be improved.Reference Zaitsev, Matveev and Matveyev49 Actually, in Figure 3, both lowest-order modulation sidelobes
 $(\omega \pm {\Omega _i})$ and higher-order ones
 $(\omega \pm {\Omega _j} \pm {\Omega _k})$ are present, which additionally enhances the contrast between the intact and damaged samples. Another possibility to utilize higher-order modulation phenomena may be the use of the cross-modulation interaction by applying a slowly modulated high-frequency pump wave.Reference Zaitsev, Nazarov, Gusev and Castagnede50 This modulation-type interaction is an acoustic analogue of the Luxemburg–Gorky effectReference Zaitsev, Gusev and Castagnede29 known since the 1930s for electromagnetic waves interacting in the ionosphere.
For studying nonlinear properties of samples with both localized and nonlocalized microstructure-induced nonlinearity, observation of amplitude-dependences for resonant nonlinear effects can be convenient. These effects may be rather diverse, with the simplest variants being the observation of the resonant frequency and quality-factor dependence on the excitation amplitude in rod-shaped resonators.Reference Nazarov, Ostrovsky, Soustova and Sutin30 Such observations revealed strong inconsistencies in the observed functional dependences in many rocks and metals from power-law atomic nonlinearity given by Equation 1. Indeed, the latter predicts that the amplitude-dependent elastic modulus dσ/dε  $d\sigma /d\varepsilon$ is given by:
 $$d\sigma /d\varepsilon = E(1 + 2{\beta _2}\varepsilon + 3{\beta _3}{\varepsilon ^2} + ...)$$.
Therefore, for oscillating sinusoidal strain  $\varepsilon = S\cos (\omega t)$, the period-averaged
 $\left\langle \varepsilon \right\rangle = 0$, so that quadratic nonlinearity does not yield averaged effects, whereas the cubic nonlinearity gives a correction to the elastic modulus
 $\propto \left\langle {\varepsilon ^2} \right\rangle \propto {S^2}$ (i.e., quadratic in amplitude; S = strain amplitude).
However, for almost all rocks and many metals with a damaged structure, the situation is different—the elastic modulus and the decrement (inverse Q-factor) demonstrate amplitude-dependent corrections,  $\propto {S^1}$. Furthermore, the second harmonic is hardly visible, whereas the third harmonic is
 $\propto {S^2}$. These observations are also inconsistent with power-law nonlinearity in Equation 1, according to which, under sinusoidal excitation, the second harmonic should be
 $\propto {S^2}$ and the third harmonic
 $\propto {S^3}$. These inconsistencies with Equation 1 are well described by a piece-wise quadratic, odd-type hysteretic stress–strain relationship.Reference Nazarov, Ostrovsky, Soustova and Sutin30 In terms of Figure 1a, the appearance of such hysteretic effects means that the applied strain produces local and reversible rupture/restoration of internal bonds at high-compliant defects. Measuring functional dependences in resonant samples is a convenient tool for reconstructing parameters of properly chosen nonlinear stress–stress relationships.
Similarly, the effects of acoustically induced slow dynamics can be conveniently studied in resonant samples by observing slow time-evolution of eigenfrequencies at low-level (e.g., for  $\varepsilon \sim{10^{ - 8}}$) excitations after preliminary fairly intense (
 $\varepsilon \sim{10^{ - 6}}{..10^{ - 5}}$) acoustic activation of the sample.Reference Johnson and Sutin32 Such phenomena are attributed to the gradual restoration of numerous acoustically broken weak internal bonds (for which energies of thermal fluctuations and weak probe wave appear to be sufficient).Reference Zaitsev, Gusev, Tournat and Richard34,Reference Ten Cate, Smith and Guyer51
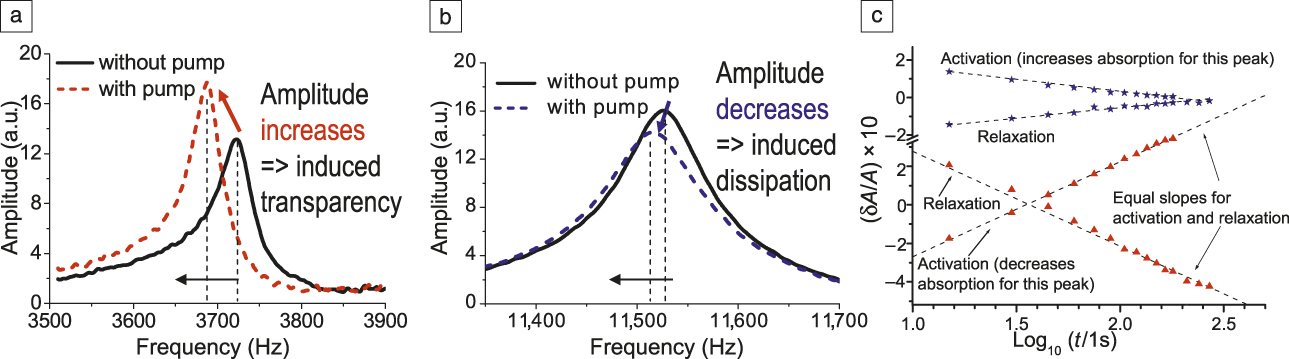
An even more flexible method may be designed through utilization of different frequencies for sample “pumping” and probing, which makes it possible to evaluate changes in properties of a sample during acoustic activation.Reference Zaitsev, Gusev and Castagnede52 In this case, an interesting effect was found for different probing modes in a glass-rod resonator containing a single crack, for which the intense acoustic activation produced opposite influences: namely, the same acoustic pumping wave may affect thermoelastic loss in the resonator and cause either an increase or a decrease in Q-factor, depending on the probe-wave frequency (see Figure 4a–b). Furthermore, the use of separate pump and probe waves revealed another mechanism of slow dynamics related to acoustically induced local heating/cooling of “weak” areas with strongly increased straining, resulting in strikingly symmetrical behavior during activation and subsequent relaxation (Figure 4c). The application of separate pump and probe waves is gaining popularity and suggests rich possibilities for studying both time-averaged and “instantaneous” nonlinear-acoustic manifestations of microstructural defects.Reference Riviére, Renaud, Guyer and Johnson53
Examples of “fast” and “slow” influence of intense pumping excitation at ∼22.5 kHz on different probe modes in a glass rod containing a single thermally produced crack. (a) Probing eigenmode at ∼3.7 kHz exhibits induced transparency (increase in the quality factor and the resonance-peak amplitude), whereas (b) the eigenmode at ∼11.5 kHz exhibits induced dissipation (decrease in the quality factor and the resonance-peak amplitude). The resonance frequency for both probe modes demonstrates a pump-induced decrease. (c) Slow, strikingly symmetrical behavior of the resonance amplitude (proportional to the quality factor) exhibiting logarithmic-in-time behavior for two different modes during acoustic activation and subsequent post-pumping relaxation (asterisks are for 3.7 kHz and triangles for 23.5 kHz).Reference Zaitsev, Gusev and Castagnede52

Other nonlinear effects can also be used and may be preferable in certain situations, for example, utilizing self-demodulation of an initially modulated wave propagating in the medium,Reference Tournat, Zaitsev, Gusev, Nazarov, Béquin and Castagnède54 generating subharmonics and self-modulation,Reference Solodov, Wackerl, Pfleiderer and Busse55,Reference Fillinger, Zaitsev, Gusev and Castagnède56 using phase-amplitude self-action as a function of excitation amplitude,Reference Zaitsev, Nazarov and Talanov44 evaluating distortions in the overall shape of coda waves in strongly scattering materials,Reference Ouarabi, Boubenider, Gliozzi and Scalerandi57 or measuring wave propagation velocities for quasistatically varying pressure.Reference Zaitsev, Dyskin, Pasternak and Matveev58
Observation of microstructure-induced nonlinear acoustic manifestations in solids with strong background nonlinearity
We next pay special attention to nonlinear acoustic effects in solids with complex structures and initially elevated nonlinearity due to the presence of high-compliance heterogeneities. At first glance, due to a strong background acoustic nonlinearity, one would hardly expect that nonlinear effects may be helpful for revealing fine structural rearrangements in these materials. This concerns almost all rocks (and similar artificial engineering materials) and especially, non-consolidated granular materials. The latter are composed of grains interacting via contacts exhibiting the so-called Hertzian nonlinearity resulting in a stress–strain relationship of the form  $\sigma \propto {\varepsilon ^{{\rm{\ }}3/2}}H(\varepsilon ){\rm{\ }}$, where
 $H(\varepsilon ){\rm{\ }}$ is the Heaviside function symbolizing that contacts do not support tensile loading. However, it is knownReference Jaeger, Nagel and Behringer59 that different contacts in disordered granular materials are usually prestrained to different degrees, so that for average strain
 ${\varepsilon _0}$ and stress
 ${\sigma _0}$, a significant fraction of the contacts has a much smaller prestrain
 $\mu {\varepsilon _0}$, where the small parameter
 $\mu &lt; &lt; 1$ characterizes the degree of unloading of such weak contacts. Therefore, for perturbations with acoustic stress
 $\tilde{\sigma }$ and strain
 $\tilde{\varepsilon }$ that do not yet cause clapping of contacts, it is clear that the acoustic linear elastic modulus
 $d\tilde{\sigma }/d\tilde{\varepsilon }$ is dominated by the contribution of the average-loaded contacts (forming the granular-packing skeleton), whereas the weak contacts give only a small correction
 $\propto {\mu ^{1/2}} &lt; &lt; 1$ (as schematically elucidated in Sidebar). In contrast, for the quadratic nonlinearity
 $\propto {d^2}\tilde{\sigma }/d{\tilde{\varepsilon }^2}$, the weak contacts give a dominant contribution
 $\propto {\mu ^{ - 1/2}} &gt; &gt; 1$. For higher-order nonlinearities, the contrast is even stronger. Therefore, propagation of the fundamental signal component is mostly determined by stronger and average-loaded contacts, whereas observation of nonlinear effects gives information selectively about the state of the loose contacts. Self-demodulation with down-conversion of signal frequency is especially convenient for probing nonlinearity of strongly absorbing granular packings.Reference Zaitsev, Richard, Delannay, Tournat and Gusev60,Reference Kiesgen de Richter, Zaitsev, Richard, Delannay, Le Caër and Tournat61
Schematic elucidation of distinct roles of the averaged-loaded and weakly loaded contacts coexisting in real granular packing. Having strongly different preloading with static strains  ${\varepsilon _0}$ and
 $\mu {\varepsilon _0}$ (where the unloading parameter is
 $\mu &lt; &lt; 1$), they experience roughly the same acoustic straining
 $\tilde{\varepsilon }$. For comparable amounts of stronger and weaker contacts,
 $(A\simB)$, the weak contacts give only a small correction
 $\sim{\mu ^{1/2}} &lt; &lt; 1$ to the linear elastic modulus of the granular material, but strongly dominant contribution
 $\sim{\mu ^{ - 1/2}} &gt; &gt; 1$ to the quadratic nonlinear parameter (and even stronger to higher-order ones).
 $H$ is the equilibrium height of chains composed of grains with stronger and weaker loaded intergrain contacts, and
 $\tilde{h}$ is the acoustically induced perturbation of the initial height of the differently preloaded chains.

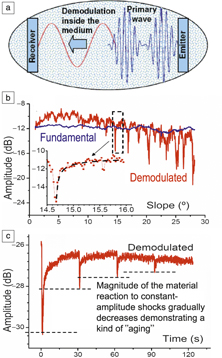
Figure 5 illustrates the use of the nonlinear self-demodulation effect (schematic in Figure 5a) to observe rupture and slow spontaneous restoration of a weak-contact network in a granular packing of ∼2-mm glass beads. The packing is subjected to either slow tilting with velocity of ∼0.5°/s (Figure 5b) up to stability loss or remains motionless and is perturbed by weak mechanical taps (Figure 5c). The fundamental component (linearly propagating carrier wave) in Figure 5b demonstrates much weaker sensitivity to the packing tilt angle, whereas the demodulated component exhibits ever-increasing variations related to the abrupt loss of stability of weak-contact ensembles and the slower partial restoration and formation of new weak contacts (see zoomed inset in Figure 5b) up to the onset of a macroscopic avalanche around a critical angle of approximately 28°. In Figure 5c, abrupt drops in the demodulated signal level are caused by tap-produced destruction of the weakest contacts that dominate the material nonlinearity. Post-perturbation, slower spontaneous partial restoration is seen, whereas the average-loaded skeleton of the packing remains undamaged. Thus, even in intrinsically heterogeneous materials with strong background nonlinearity (much higher than in homogeneous solids), observation of nonlinear effects can be a highly sensitive and selective tool for studying the state of the weakest structural components.
High sensitivity of demodulated acoustic waves applied to a weak-contact network with granular packings. (a) Schematic of the frequency down-conversion. (b) Illustration of the weak variability of the fundamental wave and strong variations in the demodulated wave amplitude in slowly tilted granular packing, reflecting gradually intensified, abrupt structural rearrangements (avalanche precursors) up to macroscopic avalanche onset; the inset shows temporal partial healing of weak contacts that were broken by the previous precursor. (c) Demodulated signal variations caused by breaking of the weakest contacts by mechanical taps applied to the granular packing. Broken weak contacts demonstrate subsequent spontaneous partial healing with clear “aging” of the system reaction to repeated taps.

Impressive manifestations of giant nonlinearity of natural rocks experiencing deformations of tidal origin with strain magnitudes as small as  ${10^{ - 8}}$ have also been reported.Reference Takano, Nishimura, Nakahara, Yusaku and Tanaka62 Such periodic strains cause variations (modulation) in elastic wave velocities with magnitudes of
 $\Delta v/v\sim{10^{ - 3}}$ and an interesting effectReference Saltykov, Kugaenko, Sinitsyn and Chebrov63 of tidal modulation of endogenous seismic noise intensity with even greater magnitude of variations
 $\Delta I/I\sim{10^{ - 2}}{...10^{ - 1}}$. Both effects consistently indicate that the quadratic nonlinearity parameter of rocks is
 $\sim{10^5}$, for which the observed magnitudes of tidal modulation of seismic noises and wave velocities can be consistently explained using the rheological model shown in Figure 1b. The variations
 $\Delta I/I\sim{10^{ - 2}}{...10^{ - 1}}$ in the model arise due to tide-induced modulation of the absorption (and the size of the region from which the noise is collected at the receiver) due to combined action of the elastic nonlinearity and linear losses at localized soft microstructural defects.Reference Zaitsev, Saltykov and Matveev64 These conclusions are supported by specific physical models of viscous and thermoelastic losses at cracks with corrugated surfaces.Reference Zaitsev, Saltykov and Matveev65,Reference Zaitsev and Matveev66 Furthermore, the model suggests an explanation for the effect of phase stabilization of the tide-induced modulation of seismic noises during the four- to six-week period preceding strong earthquakes. This effect over decennia has been successfully used as an indicator of approaching strong earthquakes in the seismically active Kamchatka region.Reference Saltykov, Chebrov, Kugaenko and Sinitsyn67
Observation of such a manifestation of nonlinearity of rocks as pressure dependences of elastic-wave velocities (acousto-elastic effect) has attracted attention as a mean for obtaining rich information about soft (i.e., crack-like) porosity of rocks.Reference David and Zimmerman68 In such measurements, two independent velocities (for longitudinal and shear waves) are available, which opens an interesting possibility for untangling information about the crack’s compliance with respect to either shear or normal loading. Indeed, the two crack compliances differently affect various elastic moduli (e.g., bulk modulus,  $K$, and shear,
 $G$), whereas pressure controls crack concentration. Conventional descriptions of the effects of cracks on elastic moduli use exactly solvable crack models, (e.g., penny-shaped cracks, for which the ratio of normal-to-shear compliances of ∼1 is almost invariable).Reference Kachanov69 Correspondingly, such a crack model predicts a nearly invariable proportion between variations
 $\Delta K$ and
 $\Delta G$. Alternatively, cracks can be described as planar objects with independent, non-predetermined compliances, and the corresponding expressions for the material’s moduli can be derived.Reference Zaitsev and Sas70,Reference MacBeth71 Thus, one can predict trajectories of the point describing the state of the material on the (
 $K,G$)-plane for varying crack concentrations and different normal-to-shear compliance ratios of the cracks. Comparison between the so-predicted trajectories and experimentally observed trajectory for varying pressure readily yields the actual compliance ratio for real cracks.Reference Zaitsev and Sas72,Reference Zaitsev, Radostin, Pasternak and Dyskin73 In contrast to the approximately unity ratio for the penny-shaped crack model, the compliance ratio for real, dry cracks in many cases demonstrates a dominant normal compliance and an unexpected abundance of rocks with negative Poisson’s ratio.Reference Zaitsev, Radostin, Pasternak and Dyskin74 Development of adequate crack models to describe these observations is challenging.
A similar approachReference Zaitsev, Matveyev, Matveev, Gelikonov, Baum, Omelchenko, Shabanov, Sovetsky, Yuzhakov, Fedorov, Siplivy, Bolshunov and Sobol75 based on analysis of elastic-moduli variations due to the appearance of high-compliance crack-like heterogeneities appeared to be useful in biomechanics for assessing the properties of microscopic crack-like pores that may develop in some collagenous tissues reshaped via moderate heating with an infrared laser. In properly chosen regimes, such procedures may be biologically nondestructive and are considered useful for novel methods that can be used for preparation of cartilaginous implants or cornea reshaping in vision-correction procedures. Recently developed methods for mapping strains and Young’s modulus variations in biological tissues, based on processing of optical coherence tomography (OCT) images of deformed tissues,Reference Kennedy, Chin, McLaughlin, Latham, Saunders, Sampson and Kennedy76 make it possible to use such OCT-based complementary measurements of the tissue dilatation and reduction in its Young modulus for evaluating averaged aspect ratios of microscopic pores produced in cartilaginous and corneal samples by infrared laser irradiation.Reference Zaitsev, Matveyev, Matveev, Gelikonov, Baum, Omelchenko, Shabanov, Sovetsky, Yuzhakov, Fedorov, Siplivy, Bolshunov and Sobol75
Intense ultrasound for probing ultimate strength of materials
In addition to the previously discussed weak-amplitude nonlinear-acoustic effects, it is worth noting the possibility of probing a material’s strength using sufficiently intense ultrasound excitation. For example, an assessment of the adhesion quality is discussed for fusion-welded silicon wafers and a model system of aluminum plates bonded by an epoxy layer.Reference Wegner, Koka, Janser, Netzelmann, Hirsekorn and Arnold77–Reference Delsanto, Hirsekorn, Agostini, Loparco and Koka79 The stress–strain curve at the weakened bond areas in these systems exhibited maximum bonding force with a subsequent descending branch qualitatively similar to the loading curve in Figure 1a. The stability of the entire system was maintained by the surrounding more strongly bonded and fairly linear material, whereas nonlinearity of the stress–strain dependence at the more weakly bonded areas generated higher harmonics under sinusoidal ultrasonic excitation (at ∼2 MHz and strain up to  ${10^{ - 4}}$, approaching the damage threshold). Observing dependences of several higher-order harmonics on the fundamental component amplitude made it possible to assess the stress–strain curve shape in the weakened areas even when passing through the maximum and transiting to the descending branch with negative slope.
In another configuration, high-intensity pulses of surface acoustic waves (SAWs) were generated by Nd:YAG (neodymium-doped yttrium aluminum garnet) laser pulses focused into a line by a cylindrical lens and absorbed in the near-surface layer of Si samples.Reference Lomonosov and Hess80 The strong SAWs produced with this setup formed sharp shock fronts at a time scale of 10–20 ns and could even cause material fracturing. The critical tensile stress for dynamic fracture along the weakest fracture plane could be obtained from the calibrated shocks in such experiments.
Conclusion
More than four decades have passed since the first demonstrations of utilizing nonlinear-acoustic effects for diagnostic purposes. Yet, new nonlinear vibro-acoustic diagnostic methods are still emerging, and interest in these unique methods is growing, as confirmed by the increasing number of relevant publications. Possible application areas of nonlinear acoustic probing are broad, ranging from studies of nanoscale phenomena to macroscopic NDT for engineering applications and up to scales of hundreds of meters or even kilometers in the case of seismic studies. Such diverse areas of applications are usually discussed in respective specialized publications, even though there are striking similarities and analogies among apparently different problems. In this article, an attempt has been made to present a general overview of this diversity with focus on some important aspects that often do not receive due attention in the literature.
Acknowledgment
Support by the Russian Foundation for Basic Research (Grant No. 19–05–00536) is acknowledged.

Vladimir Y. Zaitsev is a laboratory head at the Institute of Applied Physics of the Russian Academy of Sciences (IAP RAS), Russia. He graduated from the State University of Nizhny Novgorod, Russia. He received PhD and DrSc degrees at IAP RAS related to the development of nonlinear acoustic/seismoacoustic diagnostic methods based on the phenomenon of microstructure-induced nonlinearity. He was a postdoctoral researcher/invited professor at KU Leuven, Belgium; the Institute for Nondestructive Testing, Germany; the Universities of Maine and Rennes-1, France; The University of Western Australia; and the University of Virginia. His research interests also include the development of optical coherence tomography methods for characterization of mechanical properties of biological tissues. Zaitsev can be reached by email at vyuzai@ipfran.ru.