INTRODUCTION
Microbial symbionts increase the metabolic diversity of many eukaryotes, allowing their hosts to survive and compete for space in systems that would otherwise be inhospitable (Moran, Reference Moran2007; Moya et al., Reference Moya, Peretó, Gil and Latorre2008). Indeed, the products of autotrophic and chemosynthetic symbiont metabolism sustain diverse ecosystems on tropical coral reefs and around deep-sea hydrothermal vents, respectively (Muscatine & Cernichiari, Reference Muscatine and Cernichiari1969; Vrijenhoek, Reference Vrijenhoek and Kiel2010). On oligotrophic coral reefs, these interactions are exemplified by the mutualisms between photosynthetic symbionts and reef-building corals, octocorals and sponges (Muscatine & Porter, Reference Muscatine and Porter1977; Wilkinson, Reference Wilkinson1983; Freeman & Thacker, Reference Freeman and Thacker2011; Baker et al., in review). These symbioses are incredibly complex, with substantial diversity both across functional groups and across host species (Knowlton & Rohwer, Reference Knowlton and Rohwer2003; Thacker & Freeman, Reference Thacker and Freeman2012; Freeman et al., Reference Freeman, Thacker, Baker and Fogel2013; Baker et al., in review).
In marine sponges, some species support symbiont communities spanning almost all evolutionary lineages of bacteria and archaea (Thacker & Freeman, Reference Thacker and Freeman2012). These high microbial abundance (HMA) species have long been hypothesized to derive substantial nutritional benefit from these associations (Taylor et al., Reference Taylor, Radax, Steger and Wagner2007). Other sympatric sponge species hosting only sparse symbiont communities (termed LMA (Low Microbial Abundance)) may rely more heavily on heterotrophic filter feeding to meet their energy demands (Weisz et al., Reference Weisz, Hentschel, Lindquist and Martens2007; Freeman & Thacker, Reference Freeman and Thacker2011). Recent research, however, has shown that variation in symbiont-derived benefit may be driven more by the presence of specific, physiologically unique symbiont groups than overall symbiont abundance (Freeman et al., Reference Freeman, Thacker, Baker and Fogel2013). Thus, while hosting symbionts may allow HMA species to utilize sources of C and N that are unavailable to most LMA species, the evolution of highly specific host-symbiont associations (termed holobionts; Easson & Thacker, Reference Easson and Thacker2014) may lead to substantial variation in biogeochemical C and N cycling across sympatric sponge species (Taylor et al., Reference Taylor, Radax, Steger and Wagner2007; Mohamed et al., Reference Mohamed, Colman, Tal and Hill2008; Southwell et al., Reference Southwell, Popp and Martens2008; Maldonado et al., Reference Maldonado, Ribes and van Duyl2012). Indeed, broad dispersion of individual species within bivariate (δ13C and δ15N) isotopic ‘niche space’ suggests that there is a complex niche structure in tropical sponge communities (Newsome et al., Reference Newsome, Del Rio, Bearhop and Phillips2007; Freeman et al., Reference Freeman, Easson and Baker2014).
Sponge communities extend into temperate and polar latitudes, however, and recent evidence supports the contention that these symbioses also extend beyond the tropics (Webster et al., Reference Webster, Negri, Munro and Battershill2004; Becerro, Reference Becerro2008; Erwin et al., Reference Erwin, López-Legentil and Turon2012). For instance, in temperate Western Australia, 48% of the sponge species surveyed using PAM fluorometry were categorized as positive for the presence of photosymbionts (Lemloh et al., Reference Lemloh, Fromont, Brümmer and Usher2009). Photosymbionts have also been reported in sponges from additional temperate sites in Australia, Ireland and the Mediterranean (Roberts et al., Reference Roberts, Cummins, Davis and Pangway1999; Bell, Reference Bell2007; Erwin et al., Reference Erwin, López-Legentil and Turon2012). While these symbiont communities may allow some sponges to utilize inorganic sources of C and N (Weisz, Reference Weisz2006), little is known about the role these associations play in host ecology within temperate systems and even less is known about how these interactions may change over latitudinal gradients (Muller-Parker & Davy, Reference Muller-Parker and Davy2001; Usher, Reference Usher2008).
To investigate the role these associations play in host sponge ecology in temperate systems, we adapted the isotopic niche space concept, which posits that the relative placement of an organism in two-dimensional (δ13C and δ15N) isotopic space is a reliable indicator of the physiochemical ‘niche’ space it fills in a system (Newsome et al., Reference Newsome, Del Rio, Bearhop and Phillips2007; Thurber, Reference Thurber2007; Layman et al., Reference Layman, Araujo, Boucek, Harrison, Jud, Matich, Hammerschlag-Peyer, Rosenblatt, Vaudo, Yeager, Post and Bearhop2012). Thus, because the niche position of a consumer is driven by both the sources of C and N assimilated and biochemical processing of these sources (Newsome et al., Reference Newsome, Del Rio, Bearhop and Phillips2007; Layman et al., Reference Layman, Araujo, Boucek, Harrison, Jud, Matich, Hammerschlag-Peyer, Rosenblatt, Vaudo, Yeager, Post and Bearhop2012), we would expect wide disparity in the placement of sympatric sponge species across isotopic niche space if microbial symbionts expand the metabolic capabilities of their host. These methods allowed us to quantitatively depict and compare the niche space filled by nine sponge species from the temperate hard-bottom habitats within Gray's Reef National Marine Sanctuary (GRNMS) (Jackson et al., Reference Jackson, Inger, Parnell and Bearhop2011; Layman et al., Reference Layman, Araujo, Boucek, Harrison, Jud, Matich, Hammerschlag-Peyer, Rosenblatt, Vaudo, Yeager, Post and Bearhop2012). The placement of each species in isotopic niche space was compared with its photosymbiont abundance (as measured by chlorophyll a) and its characterization as either an HMA or LMA species. In addition, because sponges within GRNMS have tropical Caribbean conspecifics (Freeman et al., Reference Freeman, Gleason, Ruzicka, van Soest, Harvey, Mcfall, Custódio, Lôbo-Hajdu, Hajdu and Muricy2007), we also investigated how these associations change with latitude by comparing the isotopic niche space occupied by sponges from GRNMS to data from the same species collected previously from tropical reefs in Honduras (Freeman et al., Reference Freeman, Easson and Baker2014).
MATERIALS AND METHODS
Study site and species collected
Sponges were sampled across 10 sites within Gray's Reef National Marine Sanctuary (GRNMS; 31°23.815N, 80°53.461W) during a June 2013 research cruise aboard the NOAA RV Nancy Foster. Gray's Reef is a temperate, hard-bottom reef approximately 25 km off the coast of Georgia, USA. These limestone, sandstone or relic scallop shell reefs include ledges and escarpments that provide substrate for diverse assemblages of tropical and temperate benthic organisms, including over 50 species of sponges (Freeman et al., Reference Freeman, Gleason, Ruzicka, van Soest, Harvey, Mcfall, Custódio, Lôbo-Hajdu, Hajdu and Muricy2007; Ruzicka & Gleason, Reference Ruzicka and Gleason2009). Unlike tropical coral reefs, however, the benthic community within GRNMS is strikingly heterotrophic, with a heavy reliance on inputs of allochthonous organic carbon to meet respiratory requirements (Hopkinson et al., Reference Hopkinson, Fallon, Jansson and Schubauer1991).
We collected individuals of the sponge species Aiolochroia crassa (Hyatt, 1875); Aplysina fulva (Pallas, 1766); Chondrilla caribensis, Rützler, Duran & Piantoni, 2007; Cinachyrella alloclada (Uliczka, 1929); Desmapsamma anchorata (Carter, 1882); Dysidea fragilis (Montagu, 1814); Ircinia campana (Lamarck, 1814); Ircinia felix (Duchassaing & Michelotti, 1864); and Scopalina ruetzleri (Wiedenmayer, 1977). These species were chosen because they are abundant within GRNMS, have tropical conspecifics in the Caribbean, and include members of both HMA (A. crassa, A. fulva, C. caribensis, I. campana and I. felix) and LMA (C. alloclada, D. anchorata, D. fragilis and S. ruetzleri) groups (Thacker & Freeman, Reference Thacker and Freeman2012; Freeman et al., Reference Freeman, Easson and Baker2014; Gloeckner et al., Reference Gloeckner, Wehrl, Moitinho-Silva, Gernert, Schupp, Pawlik, Lindquist, Erpenbeck, Wörheide and Hentschel2014; Supplementary Table 1). At each site, individuals of these species were collected when present, along with a sample of seawater from depth for an assessment of the δ13C and δ15N values of particulate organic matter (POM), a potential source of C and N for sponges feeding heterotrophically (Freeman & Thacker, Reference Freeman and Thacker2011). Individuals of the following species were collected at multiple sites: A. crassa, A. fulva, C. caribensis, I. campana, I. felix and S. ruetzleri, while C. alloclada, D. anchorata and D. fragilis were relatively less abundant within GRNMS and were thus only collected from a single site. All sites were within a 28 km2 area of GRNMS and had an depth between 18–20 m. After each dive, sponge specimens were catalogued, potential contaminants (such as macroalgae embedded within Scopalina ruetzleri) were removed with forceps, and tissue was immediately frozen at −20°C; water samples were filtered through a 0.70 μm GF filter to obtain POM as in Freeman & Thacker (Reference Freeman and Thacker2011) and also frozen at −20°C for future analyses.
Isotope and chlorophyll a analysis
At the Smithsonian Marine Station in Fort Pierce, FL, USA, sponge samples were lyophilized and ground to a fine powder using a mortar and pestle. Homogenized sponge tissue and GF filters were acidified to remove carbonate and weighed into tared silver capsules for δ13C and δ15N analysis as in Freeman & Thacker (Reference Freeman and Thacker2011). Sponge and POM samples were analysed in the Stable Isotope Ratio Mass Spectrometry laboratory (SIRMS) at the University of Hong Kong via combustion in a Eurovector EA3028 coupled to a Perspective IRMS (Nu Instruments). Analytical precision was determined by repeated analysis of an internal acetanilide standard (‘acet 6’; 70% C). Mean (±SE) precision during analysis was 0.2 ± 0.04 and 0.1 ± 0.01 for δ15N and δ13C, respectively. Isotope data are expressed in delta (δ) or permil (‰) notation as in Freeman & Thacker (Reference Freeman and Thacker2011) and as described in Fry (Reference Fry2006). Photosymbiont abundance (chlorophyll a (chl a)) analyses were carried out on lyophilized tissue as in Freeman & Thacker (Reference Freeman and Thacker2011) and Freeman et al. (Reference Freeman, Thacker, Baker and Fogel2013).
Data analysis
The niche structure of these nine sponge species from GRNMS was estimated by calculating the standard ellipse area (SEAc) of each species using a Bayesian approach based on multivariate ellipse-based metrics (SIBER (Stable Isotope Bayesian Ellipses in R); Jackson et al., Reference Jackson, Inger, Parnell and Bearhop2011). Because the SEAc contains approximately 40% of the data within a set of bivariate (δ13C and δ15N) data, an ellipse represents the core niche area for a population or community (Jackson et al., Reference Jackson, Inger, Parnell and Bearhop2011; Layman et al., Reference Layman, Araujo, Boucek, Harrison, Jud, Matich, Hammerschlag-Peyer, Rosenblatt, Vaudo, Yeager, Post and Bearhop2012). Unlike other estimates of niche width (the area of a convex hull enclosing all data points (Total Area, TA); Layman et al., Reference Layman, Arrington, Montaña and Post2007), SEAc calculations are less susceptible to outliers. In addition, using Bayesian inference allows for more robust comparisons across sets of data with variable sample sizes. We adapted these methods to visualize the placement of each of these species within the isotopic ‘niche space’ of GRNMS. We also compared the placement of individual species within this isotopic space using methods outlined by Turner et al. (Reference Turner, Collyer and Krabbenhoft2010). These methods calculate the Euclidean distance between the centroids (bivariate mean) of individual species within isotopic space and use a residual permutation procedure (RPP) and Hotelling T 2 test to evaluate whether this distance is significant (different from zero), thus placing these individual species in unique isotopic space (Turner et al., Reference Turner, Collyer and Krabbenhoft2010).
In addition, to assess how sponge niche structure changes across a tropical-temperate gradient, we calculated the niche area (as SEAc) and assessed the relative position of temperate and tropical sponge communities. These communities included individuals of A. crassa, A. fulva, C. caribensis, D. anchorata and I. campana collected from the temperate reefs of GRNMS and tropical reefs within the Miskito Cays of Honduras (Chollett et al., Reference Chollett, Stoyle and Box2014). Data for sponge communities from Honduras were collected previously as part of a prior study (Freeman et al., Reference Freeman, Easson and Baker2014). We generated a SEAc from each of these communities using the mean values for each of these five species (Jackson et al., Reference Jackson, Inger, Parnell and Bearhop2011; Layman et al., Reference Layman, Araujo, Boucek, Harrison, Jud, Matich, Hammerschlag-Peyer, Rosenblatt, Vaudo, Yeager, Post and Bearhop2012). Above statistical analyses were conducted in R v. 3.1.1 using R commands adapted from Turner et al. (Reference Turner, Collyer and Krabbenhoft2010) and Jackson et al. (Reference Jackson, Inger, Parnell and Bearhop2011). We also assessed the relative effects of host species identity and site (GRNMS vs Honduras) on the placement of samples within isotopic space using the function adonis in the R package vegan (Oksanen et al., Reference Oksanen, Blanchet, Kindt, Legendre, Minchin, O'hara, Simpson, Solymos, Stevens and Wagner2014; as in Freeman et al., Reference Freeman, Easson and Baker2014).
We conducted an Analysis of Variance (ANOVA) to test for differences in the δ13C and δ15N values and chl a concentrations of sponge species collected from disparate sites within GRNMS. As these values were similar (P > 0.05) across sites, isotope values and chl a concentrations were pooled for each species prior to further analyses. We also used an ANOVA to test for differences in the δ13C and δ15N values of POM, sponge communities, and individual sponge species from GRNMS and Honduras. Prior to SIBER analyses on isotope data, residuals were tested for normality and homogeneity of variances among groups. These statistical analyses were conducted using Systat v. 11 (Systat, Inc.).
RESULTS
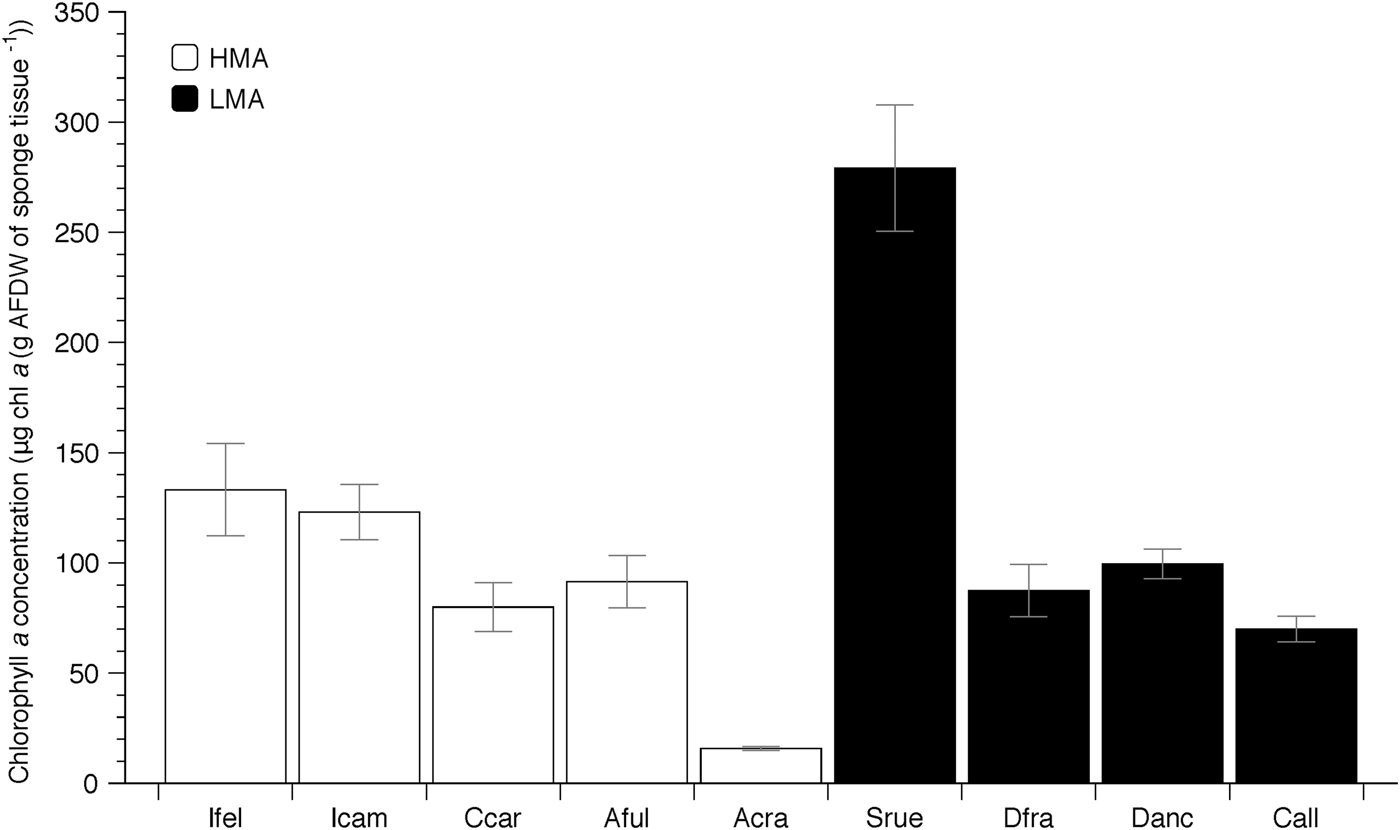
Photosymbiont abundance (measured by chl a) ranged from approximately 280 μg chl a (g AFDW of sponge tissue−1) in Scopalina ruetzleri to 15 μg chl a (g AFDW of sponge tissue−1) in Aiolochroia crassa (Figure 1). Although these nine species include members of both HMA and LMA groups, and many of these HMA species typically have chl a concentrations well above 200 μg chl a (g AFDW of sponge tissue−1) in the Caribbean (Freeman et al., Reference Freeman, Thacker, Baker and Fogel2013, Reference Freeman, Easson and Baker2014; Supplementary Table 1), almost all species (except the LMA species S. ruetzleri) had chl a values that were below 150 μg chl a (g AFDW of sponge tissue−1).
Mean chlorophyll a (chl a) concentration (±SE) of nine sponge species from Gray's Reef National Marine Sanctuary. Sponges include members of Low (LMA – filled columns) and High (HMA – open columns) Microbial Abundance groups (Weisz, Reference Weisz2006; Freeman et al., Reference Freeman, Easson and Baker2014; Gloeckner et al., Reference Gloeckner, Wehrl, Moitinho-Silva, Gernert, Schupp, Pawlik, Lindquist, Erpenbeck, Wörheide and Hentschel2014). Abbreviations represent the first letter of the genus name, followed by the first three letters of the specific epithet.

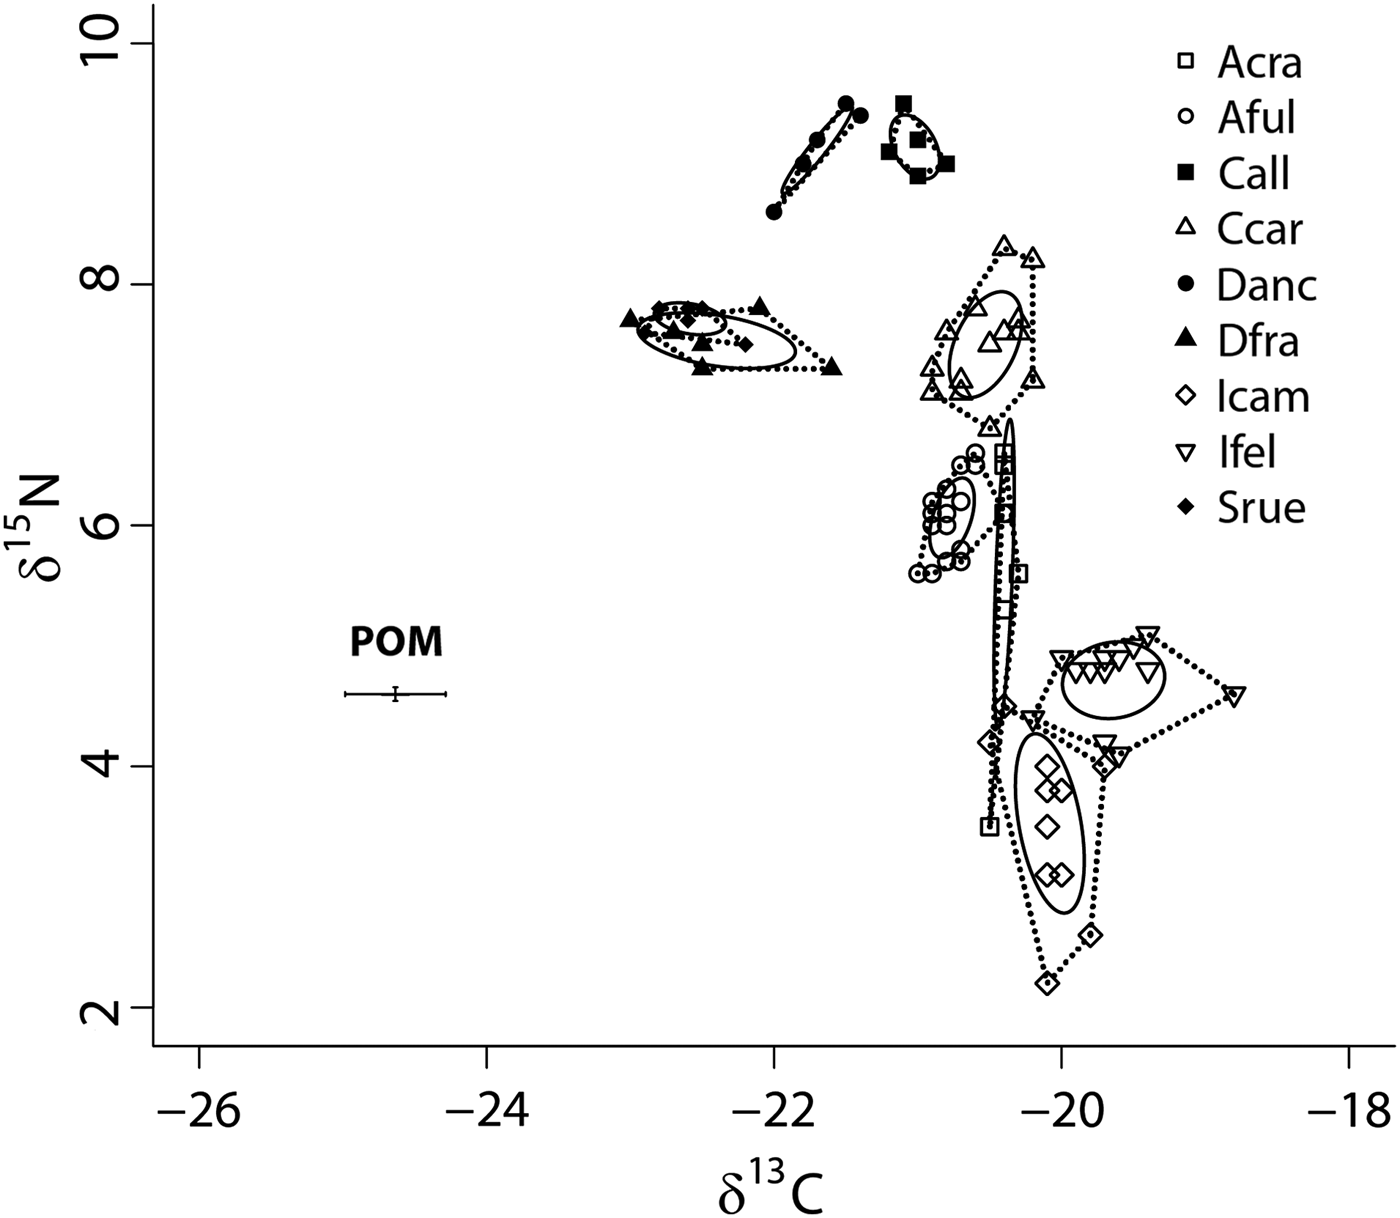
SIBER analysis showed low overlap of the standard ellipse areas (SEAc) of the nine species at GRNMS (Figure 2) and host identity accounted for over 90% of the variance in sample placement within isotopic space (adonis: F = 133.7, R 2 = 0.93, P < 0.001). In fact, while the SEAc of Dysidea fragilis and S. ruetzleri overlapped by approximately 7%, and these species occupied a similar location in isotopic niche space (distance between centroids = 0.26; Hotelling's T test: T 2 = 2.30, F = 0.88, P = 0.38; Turner et al., Reference Turner, Collyer and Krabbenhoft2010), the SEAc of the other seven species did not overlap and each species was present within unique isotopic niche space (P < 0.05). With δ15N values ranging from ~7.0 to 9.4‰, the LMA species were generally more enriched in 15N than the HMA species (δ15N values from 2.2 to 8.2‰, with only Chondrilla caribensis above 7.0‰; Figure 2). In addition, the δ13C values of LMA species were generally depleted in 13C relative to HMA species (−20.8 to −23.0‰ vs −18.8 to −21‰ for LMA and HMA, respectively; Figure 2). Although there was some variation in SEAc size across these nine species, we purposefully limit our discussion of these data, as some, but not all, of these sponges were collected at multiple sites. We were unable to obtain accurate δ13C and δ15N values of POM from all 10 sites within GRNMS due to lower organic matter on some filters. There was, however, minimal variation in the δ13C and δ15N values of particulate organic matter (POM) across six sites, with mean (±SE) values around −24.6 ± 0.7 and 4.3 ± 0.1‰, respectively.
Bivariate δ13C and δ15N plot depicting the placement of nine sponge species within the isotopic niche space of Gray's Reef National Marine Sanctuary. Sponges include members of Low (filled symbols) and High (open symbols) Microbial Abundance groups (Weisz, Reference Weisz2006; Freeman et al., Reference Freeman, Easson and Baker2014; Gloeckner et al., Reference Gloeckner, Wehrl, Moitinho-Silva, Gernert, Schupp, Pawlik, Lindquist, Erpenbeck, Wörheide and Hentschel2014). Standard ellipse areas (SEAc) depicted by solid lines provide estimates of the niche area of each of these species using Bayesian inference as in Jackson et al. (Reference Jackson, Inger, Parnell and Bearhop2011). Convex hulls depicting total niche width of each species are also shown using dashed lines for reference (Layman et al., Reference Layman, Arrington, Montaña and Post2007). Species abbreviations are the same as in Figure 1. Mean particulate organic matter (POM) δ13C and δ15N values (±SE) for GRNMS are also shown.
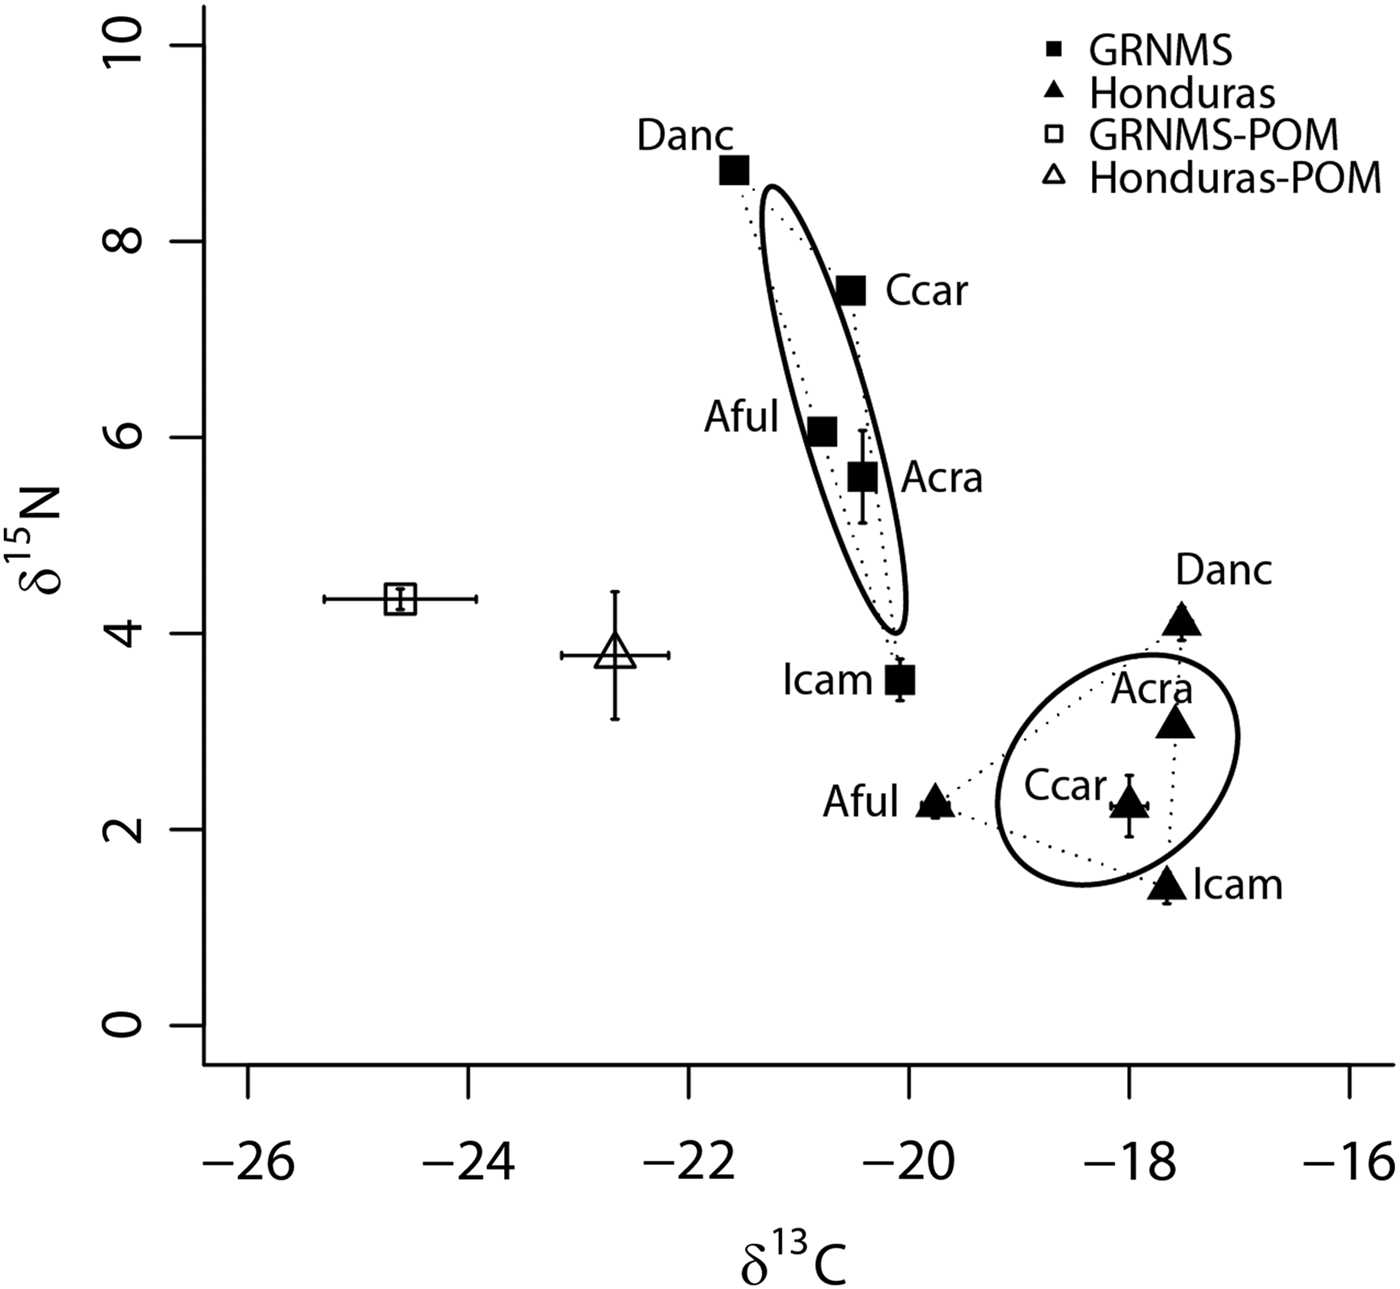
Although the SEAc of the sponge communities from GRNMS and Honduras were similar in size (P = 0.39), each of these communities was present within unique isotopic niche space (0% overlap; distance between centroids = 4.48; Hotelling's T test: T 2 = 32.86, F = 11.50, P < 0.01; Figure 3), and these communities had significantly different δ13C and δ15N values (mean (±SE): −20.6 ± 0.1 and −18.6 ± 0.2‰ for δ13C of GRNMS and Honduras, respectively; 6.2 ± 0.2 and 2.2 ± 0.1‰ for δ15N of GRNMS and Honduras, respectively; ANOVA: F = 150.7, P < 0.0001, and F = 208.4, P < 0.0001 for δ13C and δ15N, respectively). In addition, when considering data from both sites, host species identity accounted for 37% (adonis: F = 15.2, R 2 = 0.37, P < 0.001) of the variance in sample placement within isotopic space, whereas site accounted for over 60% (adonis: F = 192.8, R 2 = 0.65, P < 0.001) of this variance.
Bivariate δ13C and δ15N plot depicting the placement of five sponge species from temperate Gray's Reef National Marine Sanctuary (GRNMS; filled squares) and tropical Honduras (filled triangles; from Freeman et al., Reference Freeman, Easson and Baker2014) within isotopic niche space. Mean values (±SE) are shown for each species. Standard ellipse areas (SEAc) depicted by solid lines provide estimates of the niche area of each of these communities using Bayesian inference as in Jackson et al. (Reference Jackson, Inger, Parnell and Bearhop2011). Convex hulls depicting total niche width of each community are also shown using dashed lines for reference (Layman et al., Reference Layman, Arrington, Montaña and Post2007). Mean (±SE) δ13C and δ15N for particulate organic matter (POM) from GRNMS (open square) and Honduras (open triangle) are also shown. Species abbreviations are the same as in Figures 1 and 2.
The δ13C values of both POM (ANOVA: F = 5.4, P = 0.04) and all five sponge species (ANOVA: P < 0.05) were significantly depleted at GRNMS compared with Honduras (Figure 3; Table S1). In contrast, although the δ15N values of all five sponge species were significantly more enriched at GRNMS (ANOVA: P < 0.05) than in Honduras, there was no significant difference in the δ15N values of POM between these two sites (ANOVA: F = 0.7, P = 0.41; Figure 3; Table S1). The sponge community from GRNMS was, on average, 1.9‰ enriched in δ15N relative to POM and almost all species (except Ircinia campana (0.8‰ depleted in δ15N relative to POM)) were enriched in δ15N (between 0.4 and 4.8‰) relative to POM. The sponge community from Honduras, on the other hand, was, on average, 1.2‰ depleted in δ15N relative to POM and almost all species (except Desmapsamma anchorata (0.4‰ enriched in δ15N relative to POM)) were depleted in δ15N (between 0.6 and 2.3‰) relative to POM (Figure 3).
DISCUSSION
Unlike in the tropics, photosymbiont abundance values (chlorophyll a) in sponges from GRNMS were generally low (<150 μg chl a (g AFDW of sponge tissue−1)), regardless of whether these species were categorized as HMA or LMA. In fact, the average (±SE) chl a concentration of the five HMA species in this study was approximately 90 (±20) μg chl a (g AFDW of sponge tissue−1), whereas the mean chl a concentration for these same HMA species was around 320 (±100) μg chl a (g AFDW of sponge tissue−1) in tropical Honduras (Freeman et al., Reference Freeman, Easson and Baker2014), and 160 (±40) μg chl a (g of sponge tissue−1) in Panama (Erwin & Thacker, Reference Erwin and Thacker2007). Although the LMA species Scopalina ruetzleri had abnormally elevated chl a concentrations (>250 μg chl a (g AFDW of sponge tissue−1) at GRNMS compared with only 40 μg chl a (g of sponge tissue−1) in Panama; Erwin & Thacker, Reference Erwin and Thacker2007), these levels likely reflect the fact that this semi-encrusting species grows in close proximity to and around some macroalgae at GRNMS (see photos at GRNMS benthic invertebrate field guide: http://www.bio.georgiasouthern.edu/gr-inverts/index.html). While we removed apparent algal tissue following collection and prior to chl a and isotope analyses, deeply embedded algae may have amplified these chl a values. Therefore, unlike the other species, chl a values in S. ruetzleri likely do not reflect true photosymbiont abundance.
Although photosymbiont populations were reduced in HMA sponges from these temperate reefs (Muller-Parker & Davy, Reference Muller-Parker and Davy2001), striking disparity in the placement of sponges within the isotopic niche space of GRNMS suggests that biogeochemical cycling of C and N is highly variable across these nine species (Newsome et al., Reference Newsome, Del Rio, Bearhop and Phillips2007; Layman et al., Reference Layman, Araujo, Boucek, Harrison, Jud, Matich, Hammerschlag-Peyer, Rosenblatt, Vaudo, Yeager, Post and Bearhop2012). Microbial communities may allow HMA holobionts to assimilate sources of C and N that are unavailable to LMA species within this system (Weisz et al., Reference Weisz, Hentschel, Lindquist and Martens2007; Thacker & Freeman, Reference Thacker and Freeman2012; Freeman et al., Reference Freeman, Easson and Baker2014). Indeed, the placement of LMA species in isotopic space relative to HMA species and particulate organic matter (POM: δ13C and δ15N values of −24.6 ± 0.7 and 4.3 ± 0.1‰, respectively) suggest that LMA species may be more reliant on local sources of C and N than most HMA species (Michener & Kaufman, Reference Michener, Kaufman, Michener and Lajtha2007; Weisz et al., Reference Weisz, Hentschel, Lindquist and Martens2007; Freeman & Thacker, Reference Freeman and Thacker2011). Substantial dispersion of HMA species and the strong effect of host species identity in the placement of individual samples across isotopic space makes such broad generalizations difficult, however, and implies that factors other than overall symbiont abundance are driving the relative placement of these species in isotopic niche space (Freeman et al., Reference Freeman, Easson and Baker2014).
The placement of individual LMA species may reflect specialization on particular size fractions of the POM pool or the assimilation of abundant dissolved organic matter (DOM; Hopkinson et al., Reference Hopkinson, Fallon, Jansson and Schubauer1991) by sponge cells or microbes within some species (Thurber, Reference Thurber2007; Maldonado et al., Reference Maldonado, Ribes and van Duyl2012; Easson & Thacker, Reference Easson and Thacker2014). The relative placement of HMA species, on the other hand, may reflect variation in symbiont metabolism, relative host reliance on symbiont- vs heterotrophically derived nutrients, or internal transformations and cycling of nutrients within holobionts of different species (Newsome et al., Reference Newsome, Del Rio, Bearhop and Phillips2007; Taylor et al., Reference Taylor, Radax, Steger and Wagner2007; Southwell et al., Reference Southwell, Popp and Martens2008; Thacker & Freeman, Reference Thacker and Freeman2012). For example, photosymbionts may allow some holobionts to fix inorganic sources of C, but photosymbiont productivity may vary substantially across diverse holobionts (Erwin & Thacker, Reference Erwin and Thacker2007, Reference Erwin and Thacker2008; Freeman et al., Reference Freeman, Thacker, Baker and Fogel2013). In addition, some species may host abundant microbial communities, but maintain a reliance on C and N from both microbial metabolism and heterotrophic feeding on local sources (Freeman & Thacker, Reference Freeman and Thacker2011). Microbial communities within other species may further expand the metabolic repertoires of their host by fixing and further transforming inorganic sources of N (Mohamed et al., Reference Mohamed, Colman, Tal and Hill2008; Maldonado et al., Reference Maldonado, Ribes and van Duyl2012); largely heterotrophic microbial symbionts in additional species may assimilate diverse and abundant sources of dissolved organic matter (Hopkinson et al., Reference Hopkinson, Fallon, Jansson and Schubauer1991; van Duyl et al., Reference van Duyl, Moodley, Nieuwland, van Ijzerloo, van Soest, Houtekamer, Meesters and Middelburg2011). While our data provide limited information on the relative contribution of different sources to each sponge host, the expansion of these species across isotopic niche space implies that microbial symbionts increase host metabolic diversity and thus likely play an important role in host ecology, even on temperate reefs (Knowlton & Jackson, Reference Knowlton and Jackson1994).
The trophic position of this sponge community shifted considerably across a tropical-temperate gradient. At GRNMS, almost all (except Ircinia campana) of these species were enriched in δ15N relative to POM, while on tropical reefs most (except Desmapsamma anchorata) of these sponges were depleted relative to this potential heterotrophic food source. Because the process of trophic enrichment leads to consumers that are generally enriched in δ15N compared with their prey (Michener & Kaufman, Reference Michener, Kaufman, Michener and Lajtha2007), we propose that there is a general trend towards a reduction in sponge reliance on symbiont-derived nutrients in temperate conspecifics, with a concurrent increase in the assimilation of local, diverse nutrient sources (Hopkinson et al., Reference Hopkinson, Fallon, Jansson and Schubauer1991; Michener & Kaufman, Reference Michener, Kaufman, Michener and Lajtha2007; Weisz et al., Reference Weisz, Hentschel, Lindquist and Martens2007; Freeman & Thacker, Reference Freeman and Thacker2011).
Shifts in POM δ13C values across this latitudinal gradient may be driven by variation in the ultimate C source supporting food webs in each of these regions. For instance, while benthic communities near (26 km offshore) coastal GA may be largely supported by terrestrial sources of C with depleted δ13C values, communities far (~70 km) off the coast of Honduras are probably supported by marine sources of C with more enriched δ13C values (Hopkinson et al., Reference Hopkinson, Fallon, Jansson and Schubauer1991; Deegan & Garritt, Reference Deegan and Garritt1997; Michener & Kaufman, Reference Michener, Kaufman, Michener and Lajtha2007; Lamb & Swart, Reference Lamb and Swart2008). Although sponge δ13C values from both communities are well outside the range expected by sponges feeding exclusively on bulk POM (POM δ13C value + 0.5 to 1.0‰; Michener & Kaufman, Reference Michener, Kaufman, Michener and Lajtha2007), depleted δ13C values in both POM and sponges from GRNMS suggests a reliance on these allochthonous sources of C, and may imply a reduced dependence on photosynthetic assimilation of dissolved inorganic carbon (DIC) from plentiful seawater bicarbonate, which has a δ13C value of ~0‰ (Fry, Reference Fry2006).
These data provide initial evidence that symbiont communities within temperate sponges may contribute less to holobiont metabolism than tropical conspecifics (Muller-Parker & Davy, Reference Muller-Parker and Davy2001; Usher, Reference Usher2008). While this may be driven in part by comparatively low photosymbiont abundance in sponges at GRNMS, additional studies are needed that experimentally assess differences in photosymbiont productivity across a latitudinal gradient and investigate the relative contribution of diverse sources of C and N to hosts in both regions (Hopkinson et al., Reference Hopkinson, Fallon, Jansson and Schubauer1991; Thacker & Freeman, Reference Thacker and Freeman2012). In addition, there may be substantial shifts in photosymbiont (Erwin & Thacker, Reference Erwin and Thacker2007; Usher, Reference Usher2008) and overall microbial (Easson & Thacker, Reference Easson and Thacker2014) diversity and community composition across these gradients. Future studies investigating the role that these shifts play in the biogeochemical cycling of C and N within sponge holobionts are warranted.
In conclusion, although sponges at GRNMS may be less reliant on symbiont metabolism than their tropical conspecifics, the disparate placement of HMA species across isotopic niche space (Freeman et al., Reference Freeman, Easson and Baker2014) implies that symbionts increase host metabolic diversity in these systems and allow their hosts to expand into novel physiochemical niches (Easson & Thacker, Reference Easson and Thacker2014; Freeman et al., Reference Freeman, Easson and Baker2014). Although potentially minor compared with tropical conspecifics, such a nutritional benefit may provide a competitive advantage to symbiotic sponges at GRNMS, possibly enhancing growth (Muller-Parker & Davy, Reference Muller-Parker and Davy2001; Usher, Reference Usher2008) and allowing these species to compete for space on the densely colonized scarp habitat, where all five of these HMA species are found (Ruzicka & Gleason, Reference Ruzicka and Gleason2009).
Supplementary materials and methods
To view supplementary material for this article, please visit http://dx.doi.org/S0025315415000363
ACKNOWLEDGEMENTS
We thank the staff of NOAA Gray's Reef National Marine Sanctuary and the crew of the NOAA RV Nancy Foster for their assistance and logistical support. In particular, we thank G. McFall and S. Fangman for their assistance with this project. M. Zhu and H. Wong assisted with isotopes and L. Concepcion, H. Hoffman, A. Nguyen and L. Hoke assisted with work in the laboratory. Sponge samples were collected under the NOAA permit GRNMS-2010-001. This is contribution #984 from the Smithsonian Marine Station at Fort Pierce.
FINANCIAL SUPPORT
Financial support for this project was provided to CJF as part of a postdoctoral fellowship with the Marine Global Earth Observatory (MarineGEO) project at the Smithsonian Institution.