


There are two undeniable truths in American politics. First, group identities significantly shape public opinion and political behavior. These identities act as a lens through which individuals interpret the political world around them (Krook and Mackay Reference Krook and Mackay2011; Sanchez Reference Sanchez2006; Tate Reference Tate1994). Whether based on partisanship, gender, sexuality, age, race, or ethnicity, our affiliations and connections to fellow group members influence how we perceive policies, candidates, and political issues. Moreover, they impact the political actions we take, such as voting, protesting, and donating to campaigns (Leighley and Vedlitz Reference Leighley and Vedlitz1999; Lien Reference Lien1998). Second, emotions play a powerful role in shaping political participation (Neuman et al. Reference Neuman, Marcus, Crigler and MacKuen2007; Valentino et al. Reference Valentino, Brader, Groenendyk, Gregorowicz and Hutchings2011). They can influence not only how individuals engage with politics but also how they make decisions and react to political events (Marcus et al. Reference Marcus, Neuman and MacKuen2000; Phoenix Reference Phoenix2019).
These truths—relating to group identities and emotions—were especially salient in the 2020 presidential election, a period marked by heightened racialized and gendered tensions. Anti-Asian violence during the COVID-19 pandemic (Hua and Junn Reference Hua and Junn2021), the national uprisings following the murder of George Floyd (Woodly Reference Woodly2022), and punitive immigration enforcement (Todres and Fink Reference Todres and Fink2020) all generated powerful emotional responses among minoritized groups. While these incidents focused on ethno-racial groups, women in these groups also experience targeted and systemic mistreatment. For example, the Me Too Movement initially started as a way to bring attention to sexual violence experienced by Black women (Burke Reference Burke2021). Similarly, the murder of Asian American women at a Georgia spa drew attention to sexualized stereotypes of this population that can lead to violence (Hwang and Parreñas Reference Hwang and Parreñas2021). Restrictive immigration climates have led to the rise of depression among Latina mothers who were worried about the impact on their families (Barajas-Gonzalez et al. Reference Barajas-Gonzalez, Ursache, Kamboukos, Huang, Dawson-McClure, Urcyo, Huang and Brotman2022). Racial and gendered identities are targeted through violence, and individuals tend to respond to such with anger, fear, or anxiety.
Despite extensive research on emotions in politics, existing scholarship offers limited insight into how fear and anger influence the political engagement of diverse racialized and gendered groups. Prior studies often treat emotions as universal predictors of participation, emphasizing that anger increases costly forms of engagement (e.g., voting, protesting, and donating), while fear encourages lower-cost political behaviors, such as interpersonal discussion (Valentino et al. Reference Valentino, Brader, Groenendyk, Gregorowicz and Hutchings2011). Yet, these broad generalizations overlook how the targets and sources of emotions shape participation. Moreover, most research relies heavily on measures from the American National Election Study, which centers on respondents’ emotional reactions to political elites rather than the everyday racialized and gendered experiences that fuel politics. Scholarship also tends to examine only one racial group at a time, rarely incorporating intergroup analysis, and even fewer studies assess the additional impact of gender (Marcus Reference Marcus2003; Redlawsk and Mattes Reference Redlawsk and Mattes2022).
To address these gaps in the literature, we use the 2020 Collaborative Multiracial Post-Election Survey (CMPS), which includes over 17,000 respondents across major racial and gender subgroups. This dataset allows us to analyze how fear and anger—specifically fear of other racial groups and anger about racism—shape electoral and non-electoral participation among Black women, Black men, Latinas, Latinos, Asian American women, Asian American men, White women, and White men. Grounded in sociological and anthropological theories of racialized emotions and the matrix of oppression, we argue that emotions influence political behavior differently depending on an individual’s location within the racial and gender hierarchy in the United States. We find that racialized emotions, such as fear and anger about race, have a different effect on protest participation, vote choice, and voter turnout. We begin by reviewing the literature on fear and anger in American politics, then we examine the race-gender matrix of oppression, present our theory, hypotheses, and methods, and conclude by demonstrating why emotional dynamics must be incorporated into core models of political engagement among race-gendered groups in American politics.
Fear and Anger in American Politics
If we are to study the potency of fear and anger at the intersections of race, ethnicity, and gender, it would behoove us to have a good working definition and understanding of each emotion, their action tendencies, and effects in contemporary politics. Fear is a vital response to physical and emotional danger—if we did not feel it, we could not protect ourselves from legitimate threats. Lazarus (Reference Lazarus1994) prefers the term fright to fear because it involves concrete and sudden threats; it is the danger of imminent physical harm. Anxiety is a mood state characterized by worry, apprehension, and somatic symptoms (Munir and Takov Reference Munir and Takov2022). To explain the distinction between anxiety and fear, Averill (Reference Averill1988) states, “Ask a person who is afraid what he fears, and generally he can tell you; ask him what he would like to do, and he can tell you that, too. By contrast, the person who is suffering an anxiety attack cannot say what he is anxious about, or what he wants to do” (Lazarus Reference Lazarus1994, 234). Most scholars use the terms fear and anxiety interchangeably (Wagner and Morisi Reference Wagner and Morisi2019), but psychology scholars argue that these emotions are distinct with differing effects. The primary actions associated with fear are fight or flight, depending on the intensity of the threat (Lazarus Reference Lazarus1994; Rosen and Schulkin Reference Rosen and Schulkin1998). When we are anxious, extant research finds that we are more likely to avoid a particular situation or freeze. Indeed, political psychology scholars have found that even before people decide how to vote, anxiety plays a role in the kind of information they seek and pay attention to (Albertson and Gadarian Reference Albertson and Gadarian2015). Fear about various political events, along with the actions and words of political elites, has been associated with people engaging in greater non-electoral political acts like talking about politics and wearing campaign paraphernalia (Valentino et al. Reference Valentino, Brader, Groenendyk, Gregorowicz and Hutchings2011).
Studies of fear have long dominated our understanding of public opinion and political decision-making (Marcus et al. Reference Marcus, Valentino, Vasilopoulos and Foucault2019). Early scholarship examined fear in authoritarian regimes (Adorno et al. Reference Adorno, Frenkel-Brunswik, Levinson and Sanford1950; Fromm Reference Fromm1941), and more recent research on fear focuses on the ways in which right-wing extremists’ appeals to fear increase political participation (Marcus et al. Reference Marcus, Valentino, Vasilopoulos and Foucault2019; Nai Reference Nai2021; Vasilopoulos et al. Reference Vasilopoulos, Marcus, Valentino and Foucault2019). Beyond power dynamics in the context of leadership, the overwhelming majority of what we know about fear in politics centers on the fears of White Americans and its implications for public opinion and political decision-making. Research on the racial threat hypothesis finds that when White Americans feel threatened by increases in racial and ethnic minorities in homogeneously White areas, they are more likely to support conservative policies and political candidates (Blumer Reference Blumer1958; Bobo and Hutchings Reference Bobo and Hutchings1996; Glaser Reference Glaser1994; Hopkins Reference Hopkins2010; Rocha and Espino Reference Rocha and Espino2009). A large body of research on fear of crime examines how White Americans perceive non-Whites, especially Black people, to be dangerous and in need of being controlled (Beckett Reference Beckett1997; Weaver Reference Weaver2007). Much of this research has found that these White racialized fears are associated with support for restrictions to welfare and increased support of punitiveness and mass incarceration (Soss et al. Reference Soss, Fording and Schram2011). Metzl (Reference Metzl2019) finds that race-coded fear narratives lead White Americans to oppose policies like the Affordable Care Act and gun control and to support the Republican Party. Fear has been and will continue to be a powerful force in shaping the politics of White Americans.
Less is known about how fear manifests among racial and ethnic minorities. Some recent research on fear among Latinos and Asian Americans examines how hateful rhetoric and threatening language surrounding immigration and deportation mobilize these groups into political action (Barreto and Segura Reference Barreto and Segura2014; Kim Reference Kim2024; Pantoja and Segura Reference Pantoja and Segura2003; Serrano-Careaga and Huo Reference Serrano-Careaga and Huo2019). However, even less is known about the role of fear in Black politics (Burge and Johnson Reference Burge and Johnson2018; Slaughter et al. Reference Slaughter, Burge-Hicks, Coronado and Brown2024). Despite growing scholarship on emotions in politics, we know remarkably little about how fear shapes political behavior among race-gender groups. Existing research rarely considers how race and gender jointly structure experiences of racialized emotions among racial and ethnic minorities. We seek to address this omission.
Anger has been shown to be a powerful force in politics (Huddy et al. Reference Huddy, Feldman, Cassese, George, Russell and Michael2007; Banks Reference Banks2014; Haynes and Skulley Reference Haynes and Skulley2012; Stapleton and Dawkins Reference Stapleton and Dawkins2022; Valentino et al. Reference Valentino, Brader, Groenendyk, Gregorowicz and Hutchings2011; Webster Reference Webster2020). Anger is defined as a belief that we, or our friends, have been unfairly slighted, which causes in us both painful feelings and a desire or impulse for revenge (Lazarus Reference Lazarus1994). “Anger is experienced when a person has been threatened and, more importantly, when an individual is certain about who’s responsible (or blameworthy) for the offense” (Banks Reference Banks2014). If we blame someone for a wrongdoing, it requires that we believe that the individual could have acted differently, that they had control over the offending action (Lazarus Reference Lazarus1994). When we are angry, psychological research suggests that it brings about the following action tendencies/behaviors: it produces a desire to regain control, remove the obstruction, and, if necessary, attack the source of injury. Existing research in political psychology finds that anger is a mobilizing or motivating emotion. When we are angry, we are more likely to engage in more “costly” forms of political participation: voting, attending a rally, working for a campaign, and donating money to candidates and causes (Valentino et al. Reference Valentino, Brader, Groenendyk, Gregorowicz and Hutchings2011).
While extant literature on the role of anger in American politics generally centers the experiences of White Americans, several scholars examine how Black Americans’ experiences with anger impact their political decision-making. In Anger and Racial Politics, Banks (Reference Banks2014) provides the most comprehensive understanding of the role of anger in White public opinion and political behavior. Banks (Reference Banks2014) finds that when generalized anger is triggered among White Americans, it activates racial biases, leading White Americans to be less supportive of racialized policies like affirmative action and the Affordable Care Act and more supportive of right-wing candidates. In The Anger Gap, Phoenix (Reference Phoenix2019) argues and finds that White Americans are more likely than Black Americans and Latinos to express anger toward political actors or systems. Phoenix (Reference Phoenix2019) further finds that pride and enthusiasm are more likely than anger to mobilize Latinos and Black Americans to vote. Banks et al. (Reference Banks, White and McKenzie2019) use a recall-and-write emotional induction task and find that feeling angry about race or race relations increases Blacks’ willingness to donate to Black organizations, protest, and vote for Black candidates. Recent scholarship finds that anger functions differently across race and gender, carrying distinct electoral costs for Black women that Black men do not face (Scott-Cummings and Wright Reference Scott-Cummings and Wright2026).
Research on anger and political behavior beyond the Black-White binary is quite limited. Gutierrez et al. Reference Gutierrez, Ocampo, Barreto and Segura(2019) and Serrano-Careaga and Huo (Reference Serrano-Careaga and Huo2019) both find that anger induced by anti-immigrant rhetoric increases Latino solidarity and mobilizes collective action, even among those not personally threatened by immigration policy. Even less is known about anger among Asian Americans in politics. Wong et al. (Reference Wong, Ramakrishnan, Lee, Junn and Wong2011) allude to racial victimization and hate crimes against Asians leading to greater collective anger and solidarity, which in turn increases turnout. Much of this work focuses on members of racial groups and fails to provide a nuanced understanding of how both ethno-racial and gender identities influence emotional experiences and political engagement.
Power, Privilege, and the Race-Gendered Matrix of Oppression in America
The matrix of domination, a foundational concept, captures how systems of power operate through intersecting and mutually reinforcing structural oppression to shape group experiences in American political life (Collins Reference Collins1990). This concept purports that the interlocking systems of oppression—such as racism, sexism, classism, heterosexism, ageism, and other hierarchies—organize society in a way that shapes an individual’s and groups’ experiences with privilege and disadvantage. Power is relational and cannot be viewed as separate or additive. Rather, the matrix demonstrates how forms of oppression function together to produce complex, layered social inequalities.
The ability to analyze interlocking systems of privilege and oppression to develop strategies to challenge those systems—with an emphasis on racism, sexism, classism, and heterosexism (Combahee River Collective Reference Collective1974)—is key to linking both theory and praxis. Recognizing social processes, such as experiences of discrimination, affords people the opportunity to assess the interlocking systems of marginalization and oppression at the individual level. However, seeing these experiences with discrimination as happening because of one’s group membership is an acknowledgment of systems or institutional structures that continually privilege or marginalize people based on their group identity. Yet, simply belonging to multiple social identities of groups who have been historically marginalized by said structural inequalities does not fully account for how people experience oppression. Persons from marginalized groups do not experience oppression in the same way or all at the same time; rather, what makes people vulnerable to oppression is how others perceive them, which is based on both political realities and societal norms (Aguayo-Romero Reference Aguayo-Romero2021). Merely looking at social identities without placing them within the context of systemic, institutional, and/or structural marginalization provides a partial view of how group identity influences political behavior.
The mutual reinforcement of intersecting systems of oppression allows scholars to understand the multifaceted forms of discrimination that group members may face because of their identities. However, intersectional invisibility (Purdie-Vaughns and Eibach Reference Purdie-Vaughns and Eibach2008) reduces how privilege informs oppression. For example, the fight for gender equality often focuses on White women, and the fight for racial equality often focuses on Black men, thus obscuring Black women AND how some members of marginalized groups experience privileged status within the group (Hull et al. Reference Hull, Scott and Smith1982). This form of secondary marginalization (Cohen 1998) renders the non-prototypical subject invisible (Lei et al. Reference Lei, Leshin and Rhodes2020). The matrix of domination (Collins Reference Collins1990) suggests that the confluence of social identities profoundly impacts one’s lived experience in America.
How Racialized Emotions and the Matrix of Oppression Shape the Politics of Diverse People
Focusing on intersectionality and positionality allows us to understand why groups may feel a certain way based on their status in the American socio-political hierarchy. Indeed, sociology, anthropology, and philosophy scholars have long argued that systems of White supremacy and patriarchy lead to experiences of racialized and gendered emotions among the American polity. Bonilla-Silva (Reference Bonilla-Silva2019) argues that “racialized emotions are group-based and relational.” That is, emotions are not simply individual feelings but are socially produced through racial hierarchies. Emotions such as fear and anger do not emerge in a vacuum. Instead, they are shaped by one’s position within systems of power, especially racial domination (Gay et al. Reference Gay, Hochschild and White2016). People learn what to fear, who to distrust, and which injustices should anger them based on their social location in a racialized society. Thus, emotional experiences and life become deeply structured by and intertwined with race.
The matrix of oppression provides a framework for understanding how race intersects with gender, class, and other identities to produce hierarchies of domination and vulnerability (Collins Reference Collins1990; Crenshaw Reference Crenshaw1991). This matrix is not only about access to resources or exposure to violence. It also governs who is allowed to feel and express certain emotions and whose emotions are dismissed, feared, or criminalized. For example, anger expressed by White men is often interpreted as strength or leadership, whereas anger expressed by Black women is often stereotyped as dangerous, irrational, or aggressive (Harris-Perry Reference Harris-Perry2011). Conversely, fear expressed by White groups may be politically legitimized as a concern about crime or immigration, while fear and anger expressed by communities of color may be ignored or treated as paranoia (Gause et al. Reference Gause, Moore and Ostfeld2023). The matrix allocates emotional legitimacy unevenly across groups.
When combined, the theory of racialized emotions and the matrix of oppression reveal that emotions are both products and drivers of inequality in politics. People who occupy subordinated racial-gender positions experience emotions in response to systemic harms, and these emotions can mobilize political resistance (e.g., BLM protests, #MeToo, etc.). Meanwhile, dominant racial groups often experience racialized emotions that protect their privileged status. For instance, White racial resentment or fear of demographic change can mobilize participation that reinforces racial hierarchy like support for punitive policing and anti-immigrant policies. As such, emotions are not politically neutral—they reproduce or challenge the racial-gender order. We side with the scholars of racialized emotions and the matrix of oppression and argue that the experiences of fear and anger among race-gendered groups may have profoundly different influences on their political participation.
Fear leads to engagement in less risk-averse activities (Wagner and Morisi Reference Wagner and Morisi2019). Experiencing fear leads individuals to sign petitions and talk to their neighbors about politics (Valentino et al. Reference Valentino, Brader, Groenendyk, Gregorowicz and Hutchings2011). However, in the context of racialized emotions, we expect fear to operate in different ways among racial, ethnic, and gender groups. When White Americans suggest that they fear other races, they are more likely to support conservative or Republican candidates (Brandt et al. Reference Brandt, Turner-Zwinkels, Karapirinler, Van Leeuwen, Bender, van Osch and Adams2021; Krosch et al. Reference Krosch, Park, Walker and Lisner2022). The extant literature also suggests that fear of the other leads White people to engage in riskier political behaviors, such as protest and voting (Layne Reference Layne2023; Waldroff Reference Waldroff2024). We hypothesize that fear of other races reinforces racial groups’ interests among White Americans, leading to lower support for Democratic candidates and higher levels of voting and protest activity (H1 – Racial Fear and White Americans).
On the other hand, we expect that racial and ethnic minorities have a different response to racial fear given their location in the racial hierarchy. When Asian Americans and Latinos/as feel afraid or threatened by political rhetoric, they are more likely to vote against the party sending those threatening messages (Kim Reference Kim2024). Moreover, we expect fear among racial and ethnic minorities to serve as a mobilizing force for their political engagement. Instead of engaging in less risk-averse activities, racial and ethnic minorities might perceive the vote and collective action as the only way to escape oppression. We hypothesize that fear of other races among Black, Latino, and Asian Americans will be associated with greater support for Democratic candidates and higher levels of voting and protest activity (H2 – Racial Fear among Racial and Ethnic Minorities).
Extant research on emotions in political science finds that anger leads to greater levels of participation in protests, voting, and donating money to candidates (Phoenix Reference Phoenix2019; Valentino et al. Reference Valentino, Brader, Groenendyk, Gregorowicz and Hutchings2011). This understanding of emotions lacks nuance, as it fails to account for racialized emotions and the fact that when race-gendered groups in America are angry, they cannot channel that anger in politics in the same ways. For example, when a critical mass of White men and women stormed the U.S. Capitol on January 6, 2021, many pundits commented on how that public display of anger would never work for Black people because they would be shot and killed (Hawkins and Simon-Roberts Reference Hawkins and Simon-Roberts2024). This is not an isolated example. If we were to look back over the last 200 years of American history, we would find countless examples of the ways in which marginalized racial, ethnic, and gender groups attempted to channel their anger into politics, with massive amounts of resistance that resulted in violence and grave consequences (Gause Reference Gause2022; Gillion Reference Gillion2020). However, we recognize that this may vary among White male partisans (Huddy et al. Reference Huddy, Mason and Aaroe2015). That is, White male Democrats who are angry about racism will be more likely to support Democratic candidates. We hypothesize that anger about racism will increase support for Democratic candidates among racial and ethnic minorities and White women but have little to no effect on Democratic vote choice among White men (H3-Racial Anger and Democratic Vote Choice).
Finally, the extant literature suggests that anger related to race or racial issues may increase solidarity among people of color, which subsequently influences their willingness to vote, participate in protests, and donate money to candidates (Ross et al. Reference Ross, DeShields, Edwards and Livingston2022). Thus, we hypothesize that anger about racism will increase turnout and protest participation among Black Americans, Latinos, and Asians, regardless of gender (H4-Racial Anger, Voting, and Protests). Overall, building on theories of racialized emotions and the matrix of oppression, we argue that a group’s location within the racial and gender hierarchy shapes how fear and anger translate into vote choice, turnout, and protest participation.
Methods
We utilize data from the 2020 Collaborative Multiracial Postelection Study (CMPS) to study emotions among diverse men and women (Frasure et al. Reference Frasure, Wong, Vargas and Barreto2024). The 2020 CMPS was an online self-administered survey conducted from April 2, 2021, to October 4, 2021. This survey was administered after the protests following the May 2020 killing of George Floyd and Breonna Taylor, the COVID-19 lockdowns, the rise of anti-Asian sentiments, and the end of the Trump presidency, which was marked by political tensions around racial issues and concerns about immigration. We restrict our analysis to Black, Latino, White, and Asian Americans in the CMPS (n = 15,551). More than half of the respondents in the CMPS are women (n = 9078). With this dataset, we can conduct cross-racial and cross-ethnic analyses because of its large sample size, which is impossible in other gold-standard post-election studies, including the American National Election Study (ANES).
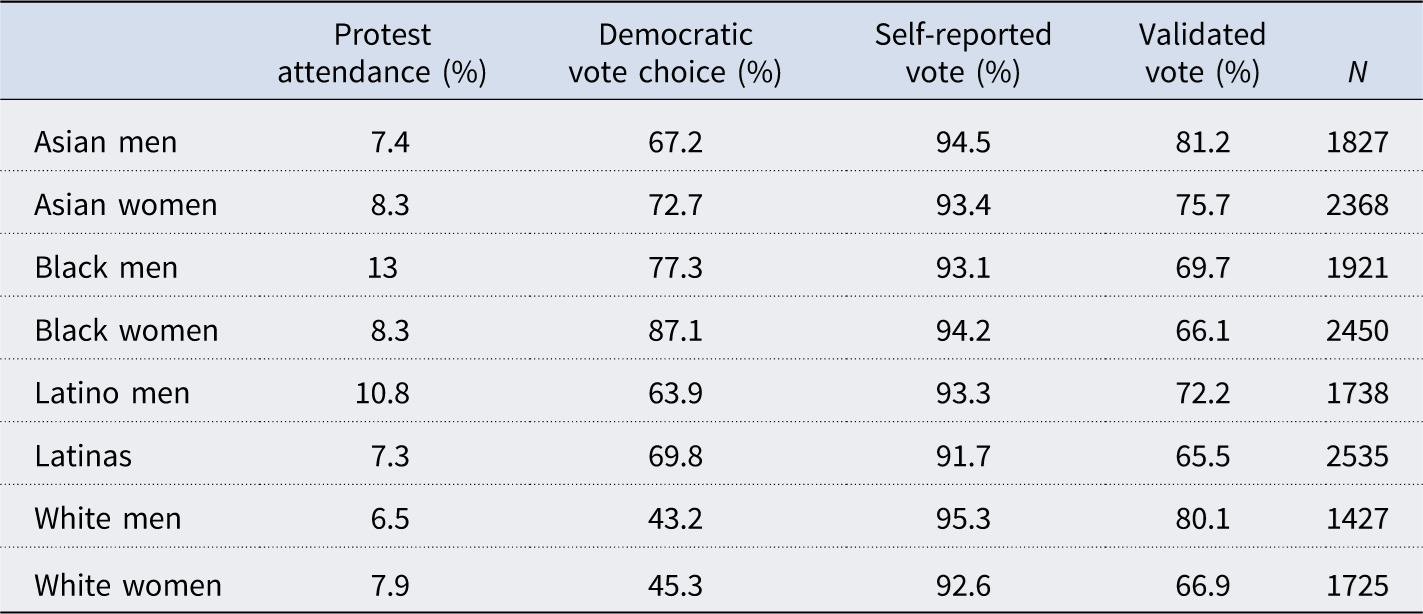
We examine three dependent variables in our analyses: turnout in the 2020 election, Democratic vote choice, and protest participation. Each variable captures a distinct dimension of politics where emotions are potentially influential. Examining these outcomes together allows us to assess whether racialized emotions shape whether individuals participate, how they participate, and which politicians they support. Analyzing multiple outcomes provides a more comprehensive assessment of the political consequences of racialized emotions for racially diverse men and women. Table 1 presents descriptive statistics for the dependent variables. Consistent with participation patterns in the 2020 election, turnout rates exceed protest participation rates, while substantial variation remains across all outcomes. Through the descriptive analysis, we find that Black men report the highest levels of protest engagement, followed by Black women. While Black men and Latinos are more likely to protest than their female counterparts, Asian women and White women are more likely to protest than men in their racial groups. Of all the groups, Black men and women were most likely to support the Democratic candidate, while White men and women were the least likely. The CMPS provides validated 2020 vote data, which reduces the overall sample size because records were not available for all respondents. We utilized validated reports instead of self-reports since individuals can over-report their voting activity (Jenkins et al. Reference Jenkins, White, Hanmer and Banks2021). Indeed, self-reported participation rates in the data indicate that nearly 94% of all registered voters across racial groups report voting.Footnote 1 Of the validated voters in the 2020 CMPS, 78% of Asian Americans voted, 73% of White Americans, 68% of Latinos, and 67% of Black Americans.
Descriptive statistics for political behavior in 2020 CMPS 2

Table 1. Long description
The table presents descriptive statistics for political behavior in 2020, focusing on protest attendance, Democratic vote choice, self-reported vote, and validated vote across different demographic groups. The table has 8 rows and 5 columns. Column headers are Protest attendance (percent), Democratic vote choice (percent), Self-reported vote (percent), Validated vote (percent), and N. Row labels are Asian men, Asian women, Black men, Black women, Latino men, Latinas, White men, and White women. Row 1: Asian men, 7.4, 67.2, 94.5, 81.2, 1827. Row 2: Asian women, 8.3, 72.7, 93.4, 75.7, 2368. Row 3: Black men, 13, 77.3, 93.1, 7.7, 1921. Row 4: Black women, 8.3, 87.1, 94.2, 66.1, 2450. Row 5: Latino men, 10.8, 63.9, 93.3, 72.2, 1738. Row 6: Latinas, 7.3, 69.8, 91.7, 65.5, 2535. Row 7: White men, 6.5, 43.2, 95.3, 80.1, 1427. Row 8: White women, 7.9, 45.3, 92.6, 66.9, 1725.
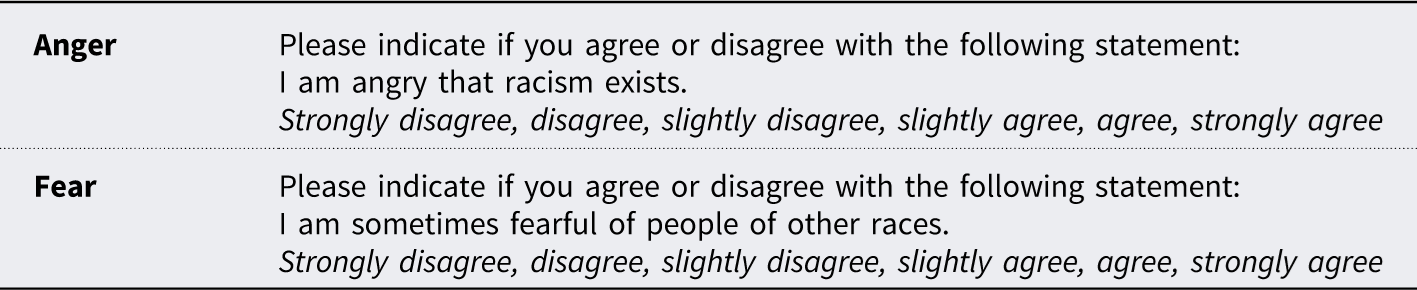
Our analysis includes several key independent variables. Racialized emotions are measured using two items. The anger measure assesses respondents’ level of agreement with the statement, “I am angry that racism exists.” The fear measure captures agreement with the statement, “I am sometimes fearful of people of other races.” Table 2 presents the wording of the racialized emotions measures.Footnote 3 The “angry racism exists” and “fear of other races” items are drawn from the FIRE battery (DeSante and Smith Reference DeSante and Smith2020). These measures approximate how racial injustice and emotions can be intertwined for Black, Latino Americans, Asians, and Whites.
Question wording for racialized emotions variables

Table 2. Long description
A table with two rows and two columns. The first column lists emotions: Anger and Fear. The second column contains statements associated with each emotion. For Anger, the statement is ‘I am angry that racism exists.’ For Fear, the statement is ‘I am sometimes fearful of people of other races.’ Each statement is followed by a scale for respondents to indicate their level of agreement, ranging from ‘Strongly disagree’ to ‘Strongly agree.’
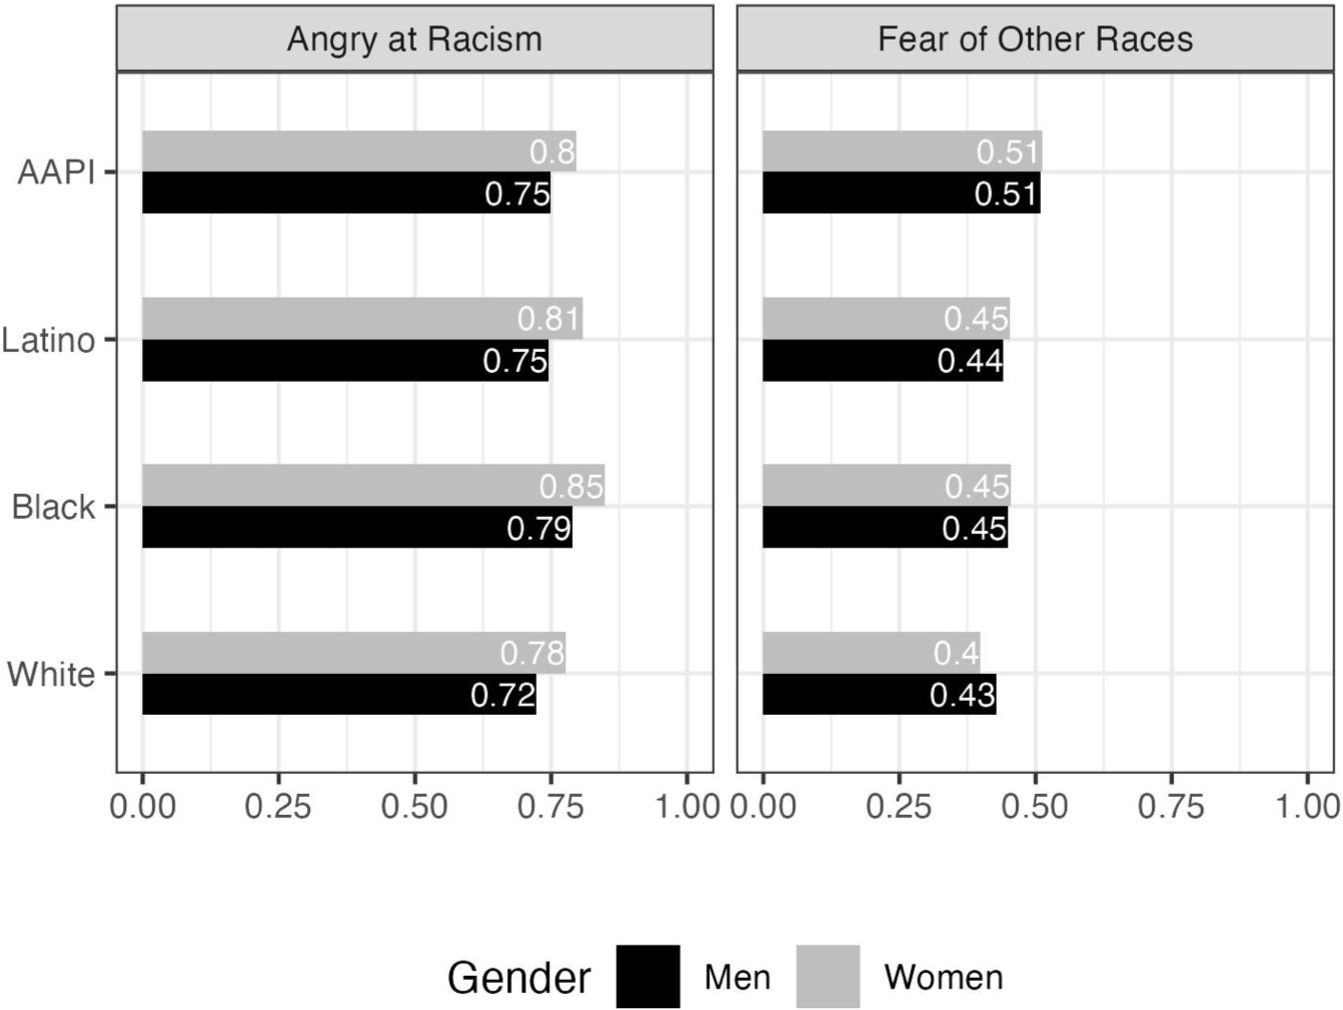
Figure 1 demonstrates the average level of racialized emotions among men and women by race. Women consistently report slightly higher levels of anger than men across racial groups, with a 0.5-point difference. Anger toward racism is highest among Black men (0.79) and Black women (0.85), but the gender gap is largest among Latinos and Whites, where men are .6 points less angry than women (p < 0.05). After the racial reckoning in 2020, Black Americans may have exhibited higher levels of anger about racism. In a similar vein, Asian Americans express the greatest fear of other races when compared to other race-gendered groups. This should come as no surprise since the data were collected during COVID-19 during a period of heightened racial discrimination against Asians (Ruiz et al. Reference Ruiz, Im and Tian2023). The average level of fear among Asian men and women (0.51) is notably higher than that of other race-gender groups. As Asian Americans were subject to racist rhetoric for spreading the virus, this likely elevated the sense of fear that other groups were targeting Asian Americans directly. Taken together, the average levels of anger and fear in Figure 1 demonstrate that racial and ethnic groups hold varying emotions toward race, which can have consequences for their engagement in politics.
Average level of anger and fear among diverse men and women.
Note: The figure displays the weighted means for anger and fear across racial and gender groups in the 2020 CMPS. The measure ranges from 0 to 1.

In the remaining analyses, the paper examines how anger and fear are associated with political engagement among Black, Latino, Asian, and White men and women. In the subsequent logistic regression analyses, we include the emotion variables, in addition to controls for racial-linked fate, partisanship, income, age, education, nativity (US born), and region (south). We also include measures of church attendance and outreach from organizations, since these measures have been associated with the frequency of political engagement (Jones-Correa and Leal Reference Jones-Correa and Leal2001; Barreto et al. Reference Barreto, Masuoka and Sanchez2008; Barreto and Bozonelos Reference Barreto and Bozonelos2009; Brown Reference Brown2014; Ramakrishnan and Shah Reference Ramakrishnan and Shah2016). Since the outcome measures are binary, the results are presented as predicted probabilities, whereas the change in an independent measure is interpreted on a 0–1 scale with all other regression variables held at their means. The figures plot the predicted probabilities for each racial and gender group of the emotion as it increases from its minimum to maximum value, with all variables held at their means. All logistic regression coefficients are included in the appendix.
Findings
The results demonstrate that racial anger and racial fear have divergent effects on the political behavior of diverse men and women. We first assess how fear of other races influences Democratic vote choice, turnout, and protest participation among race-gender groups. We then examine the role of anger about racism in shaping these same political behaviors. We compare the political consequences of fear and anger across both electoral and non-electoral forms of participation.
How fear of other races shapes political behavior
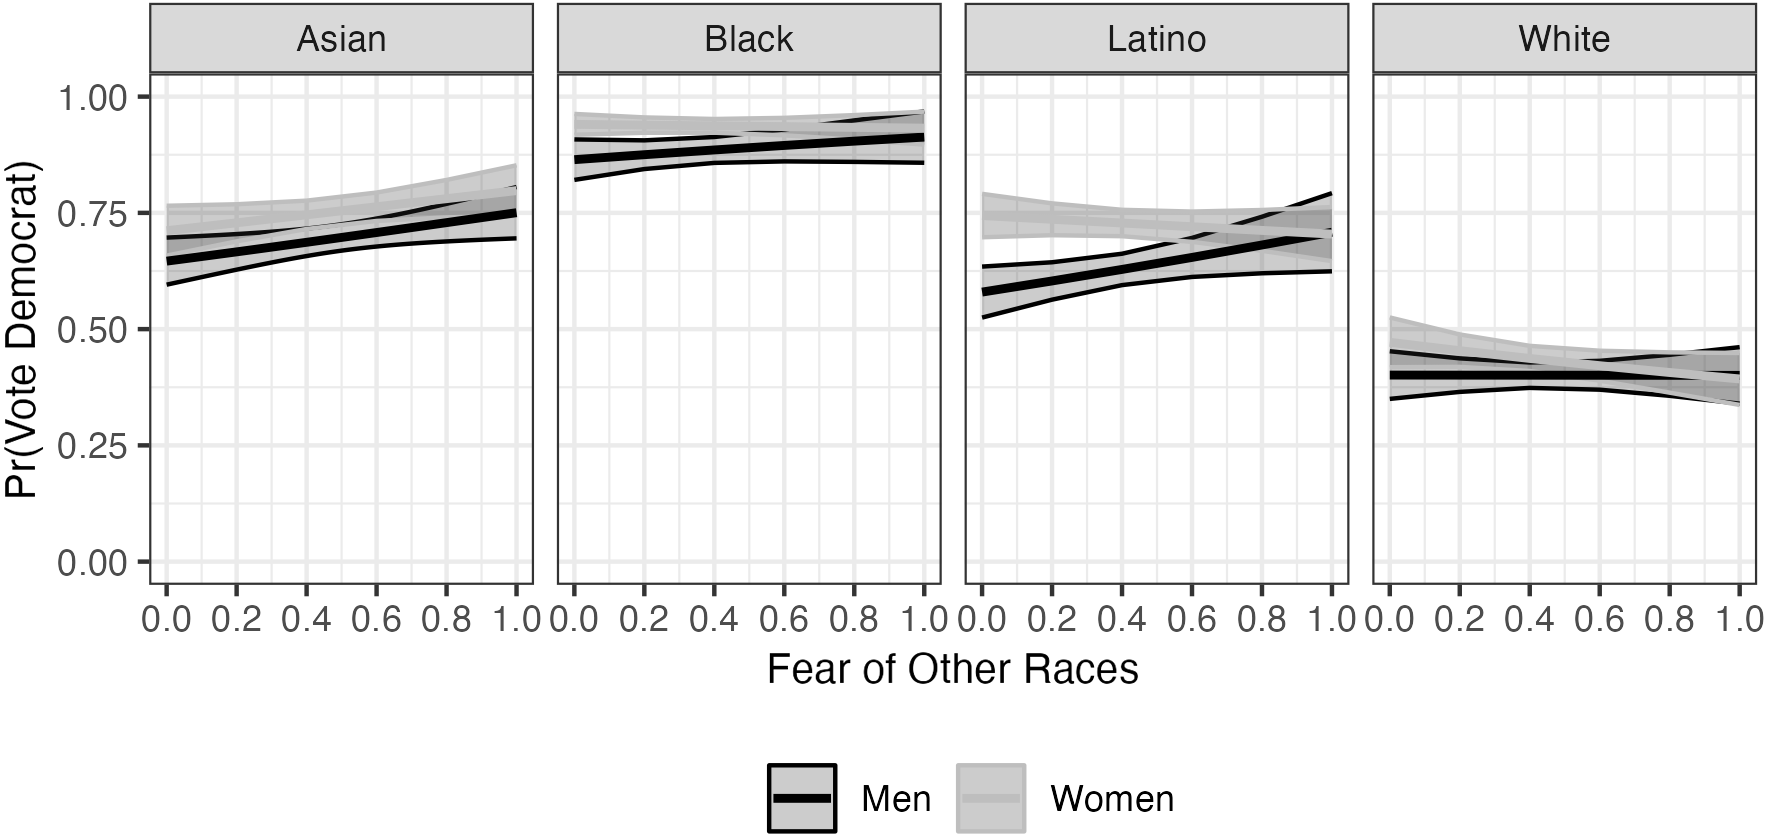
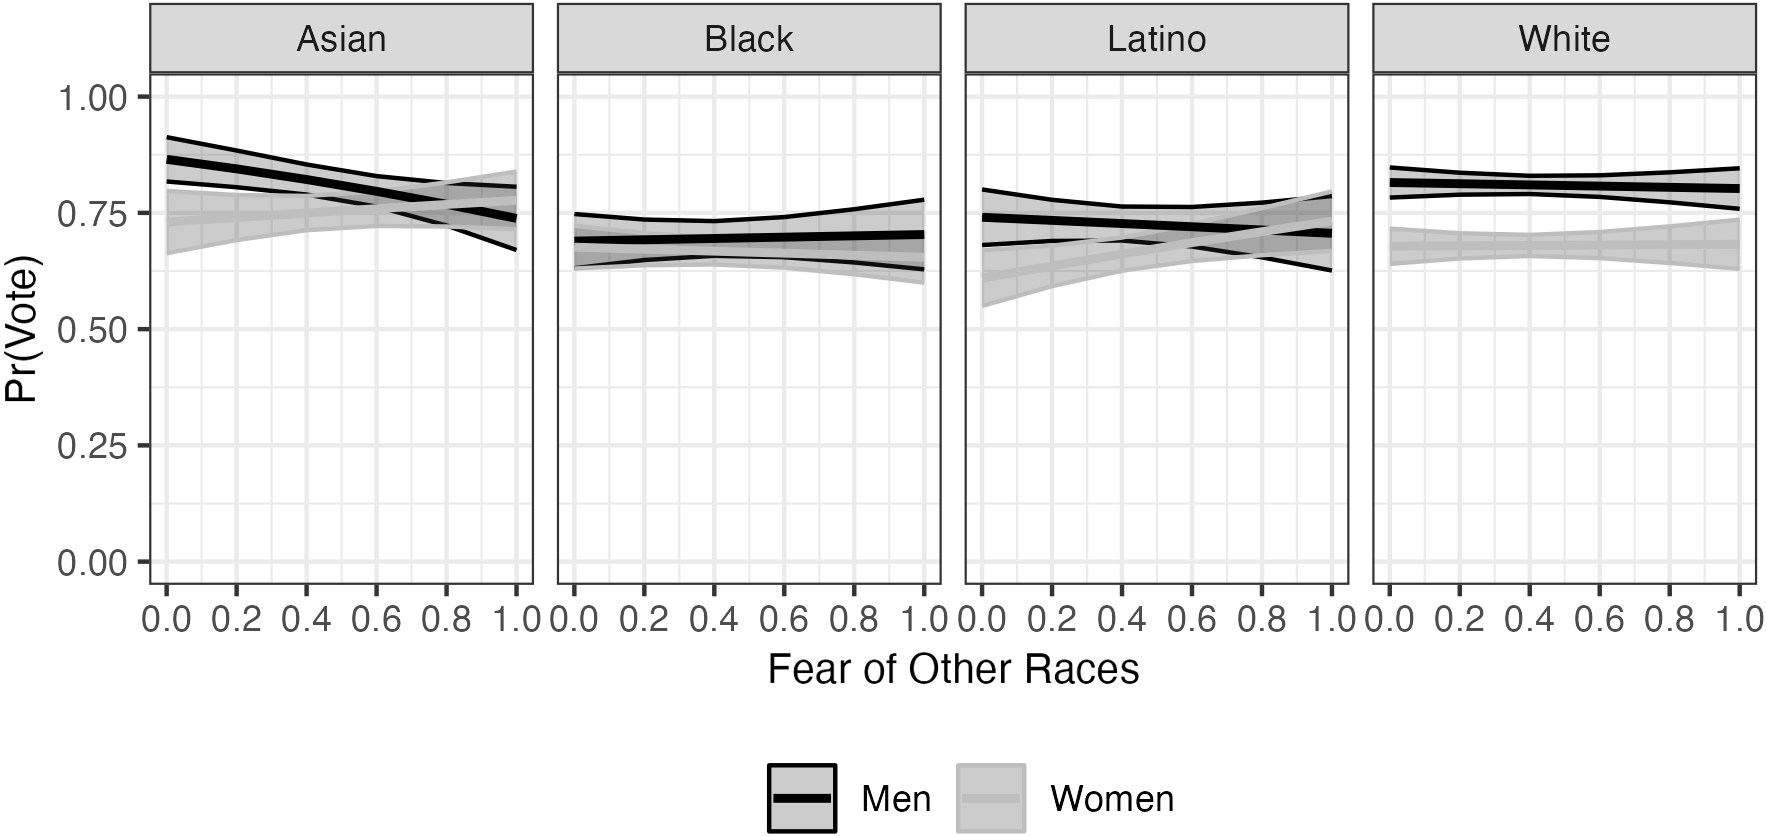
We begin by examining whether fear of other races shapes electoral and non-electoral participation. Figure 2 presents the relationship between racial fear and Democratic vote choice. We hypothesized that fear would increase support for Democratic candidates among Black, Asian, and Latino voters while decreasing support among White voters. Figure 2 provides partial support for H1, suggesting that fear of other races is associated with lower Democratic support among some White respondents, although the relationship is weaker than expected. The results suggest that fear is more likely to reinforce Democratic support among some racial and ethnic minority groups than to decrease Democratic support among White Americans.
Predicted probability of voting democrat in 2020, moving from least afraid (0) to most afraid (1) of other races, holding all other values at their means. 95% confidence intervals.

Consistent with H1 and H2, Figure 2 reveals that the relationship between fear and Democratic support varies across racial groups, although the magnitude of these effects is generally modest. Among White respondents, fear of other races is largely unrelated to Democratic vote choice. While White women become slightly less likely to support Democratic candidates as fear increases, this decline is statistically indistinguishable from the pattern observed among White men. Overall, White respondents maintain the lowest levels of Democratic support across levels of racialized fear.
Fear of other races is associated with Democratic vote choice among some racial and ethnic minority groups, though the effects are not uniform across all groups. The strongest relationship appears among Latino respondents, particularly Latino men, whose likelihood of supporting Democratic candidates increases by approximately 10 to 15 points as fear of other races rises. Asian Americans also exhibit a positive relationship, with both men and women becoming more supportive of Democrats as the fear of other races increases. Democratic support among Black voters remains consistently high regardless of fear levels, with a slight increase for men and nearly no change for women. More broadly, cross-racial differences in the relationship between racial fear and vote choice are substantially larger than differences between men and women within racial groups, demonstrating the effects of increased racial fear among racial groups more than gender-based differences within racial groups.
Next, we examine whether fear of other races influences voter turnout.Footnote 4 Figure 3 suggests that fear of other races is not a consistent predictor of electoral participation across race-gender groups. Among White and Black respondents, turnout remains largely stable across the fear scale, indicating that fear of other races has little effect on the decision to vote. Similarly, only modest changes are observed among Latino respondents. The most notable patterns emerge among Asian Americans, where increasing fear is associated with slightly lower turnout among men and slightly higher turnout among women. Therefore, for both H1 and H2 on the role of racial fear, we find that fear plays a more prominent role in vote choice (Figure 2) than it does for turning out to vote (Figure 3).
Predicted probability of turning out to vote in 2020, moving from least afraid (0) to most afraid (1) of other races, holding all other values at their means. 95% confidence intervals.

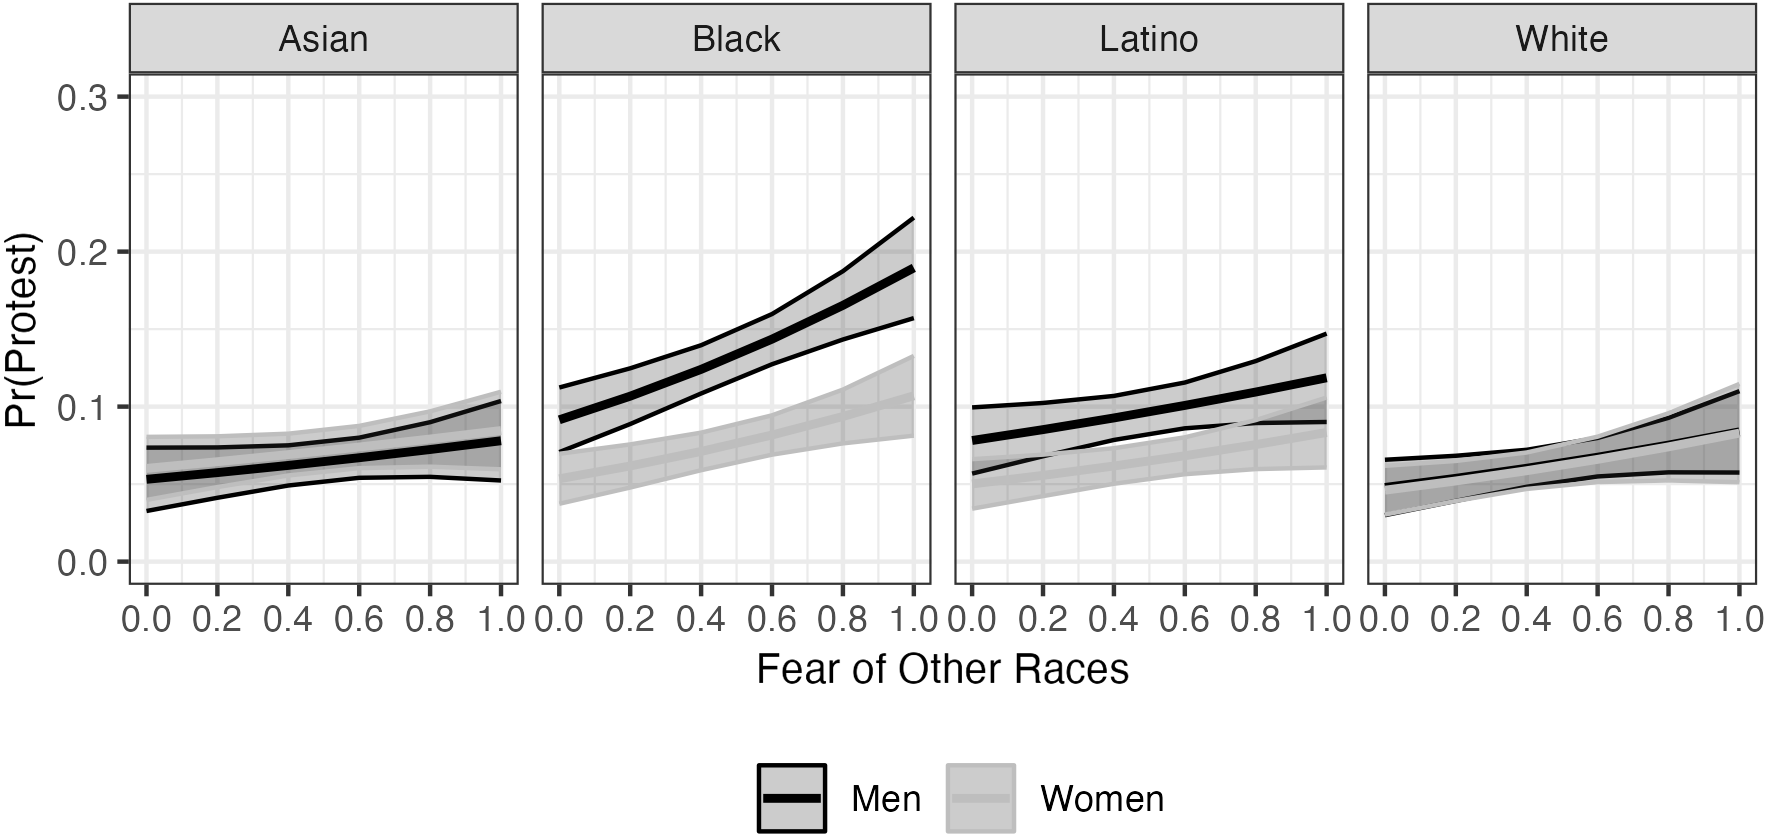
Lastly, we examine racial fear and protest behavior. Figure 4 assesses the relationship between racial fear and protest participation. In support of the first and second hypotheses, we find that racial fear is a mobilizing agent of protest engagement. Across nearly all race-gender groups, increasing fear corresponds with a greater likelihood of participating in protests, although the magnitude of the relationship varies substantially by race. Interestingly, no intra-racial gender differences emerge between White women and White men. Yet this is similar to Asian men and women, who also exhibit overlapping likelihoods of protest participation.
Predicted probability of protest activity in 2020, moving from least afraid (0) to most afraid (1) of other races, holding all other values at their means. 95% confidence intervals.

The strongest effects of racial fear and protest emerge among Black women and men. Moving from the lowest to the highest levels of racial fear is associated with a 10 to 12 percentage point increase in the probability of protesting for Black men. That is, the likelihood of protesting nearly doubles as levels of racial fear increase among Black men. Black women also experience a meaningful increase in protest activity, just not as steep. Positive, though smaller, relationships are also evident among Latino and Asian respondents. Latino respondents exhibit more moderate gains of roughly 3–5 percentage points, while Asian and White respondents show smaller increases. By contrast, the relationship among White respondents is comparatively weak. Although fear is associated with a slight increase in protest participation, the magnitude of the effect is considerably smaller than that observed among Black respondents.
Unlike turnout, which remains largely unchanged across levels of racial fear, protest participation appears particularly responsive to racialized fear. This suggests that fear may be more effective at mobilizing non-electoral forms of participation than electoral participation. More broadly, the results are consistent with our expectation that the political consequences of fear depend on a group’s position within the racial hierarchy. These findings suggest that racial fear can serve as a powerful mobilizing force among groups that are more likely to experience racialized vulnerability and threat consistent with their position in the racial hierarchy and the matrix of oppression. For groups that are lower in the racial hierarchy and experience racialized and gendered threat more directly, racial fear appears to motivate collective action in protest rather than turnout in electoral politics.
The Role of Anger in Political Decision-Making
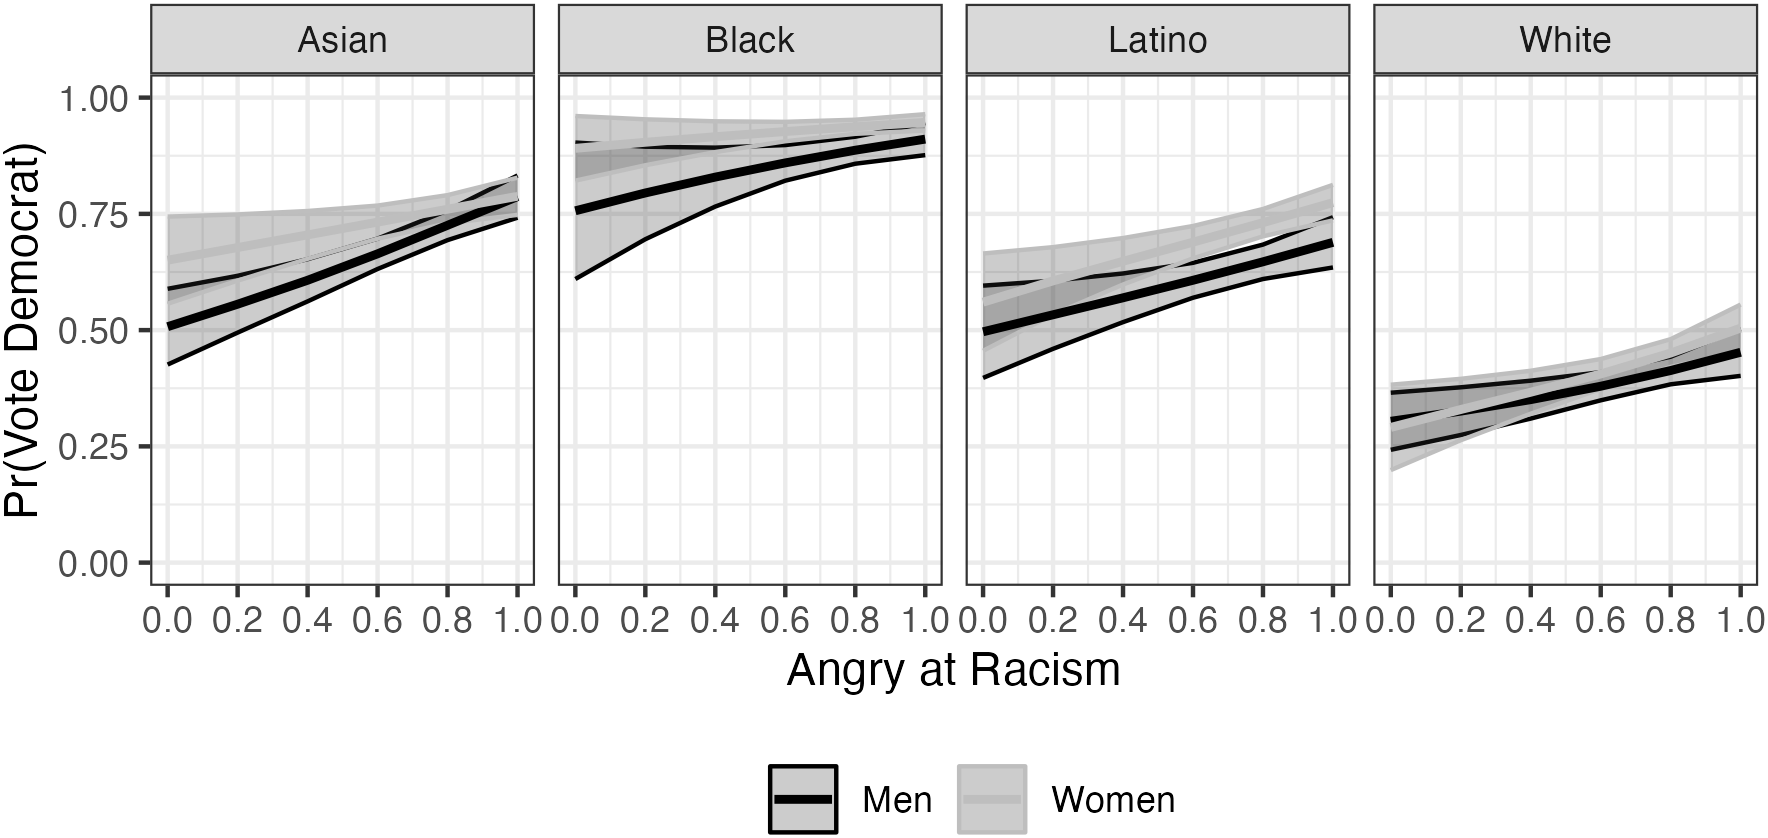
We next turn to anger about racism, which prior research identifies as a particularly mobilizing emotion for electoral and non-electoral behavior. Anger is expected to have varied effects on political engagement, including voting, voting for Democratic candidates, and participating in protests for diverse men and women, especially for White male Democrats. Figure 5 provides substantial support for H3, demonstrating that anger about racism is positively associated with Democratic vote choice among most racial and ethnic minority groups and White women. In fact, we find that anger about racism is associated with an increase in the likelihood to vote Democrat among White men and women voters, providing support for our racial anger and vote choice hypothesis (H3). As anger about racism for White women, Asian women, Black women, Black men, Latino women, and Latino men increases, so too does the likelihood to support Democratic presidential candidates. Unlike fear of other races, which exhibited positive but relatively modest effects on candidate preferences, anger about racism is consistently associated with greater support for Democratic candidates.
Predicted probability of voting for democrats in 2020, moving from least angry (0) to most angry (1) at racism, holding all other values at their means. 95% confidence intervals.

The magnitude of the effects of racial anger varies across groups. Among Black respondents, support for Democratic candidates is already high at low levels of anger but increases further as anger rises. For Black men, moving from the lowest to highest levels of anger corresponds with approximately a 15-to 20-percentage-point increase in Democratic support, while Black women exhibit a smaller but still positive increase. Latino respondents display a similarly strong pattern, with Democratic support increasing by nearly 20 percentage points across the anger scale for both men and women. These results suggest that anger about racism is strongly associated with electoral preferences among groups that have historically experienced racial marginalization through the matrix of oppression.
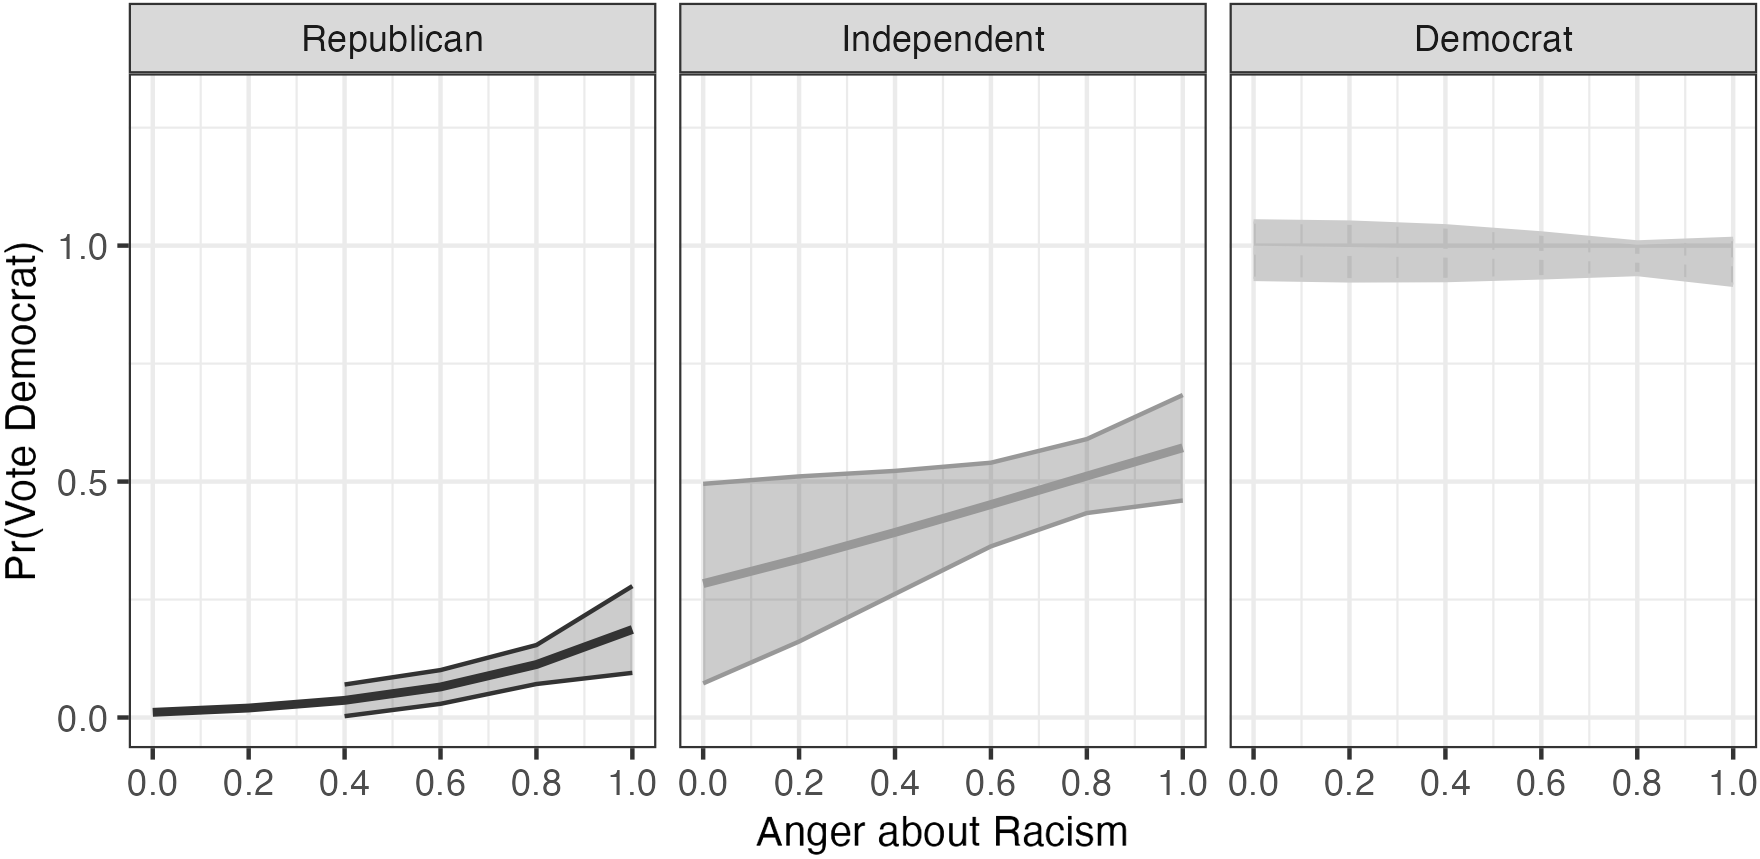
On the other hand, White respondents begin with substantially lower levels of Democratic support than Black, Latino, and Asian respondents, yet anger about racism remains politically consequential. Asian women exhibit a positive association between anger about racism and Democratic vote choice, with support increasing as anger rises. Similarly, as racial anger increases, Democratic support among White men and women rises by roughly 10–15 percentage points. This finding runs counter to our expectation that anger would have little effect on White men’s vote choice, we examine White men across partisan identity in Figure 6.
Predicted probability of voting for democrats in 2020, moving from least angry (0) to most angry (1) about racism among White male partisans, holding all other values at their means. 95% confidence intervals.

In Figure 6, we explore the relationship between racial anger, partisanship, and support for Democratic candidates among White men. As expected, the relationship between racial anger and vote choice among White men is conditioned by partisan identity. Among Republican White men, support for Democratic candidates remains extremely low across levels of racial anger. This suggests that anger about racism is insufficient to overcome strong partisan attachments among Republican White men or that White Republicans lack enough racial anger to switch their vote from Republican to Democrat. In contrast, anger about racism has a substantially larger effect among Independent White men. Among Democratic White men, support for Democratic candidates remains nearly universal regardless of anger levels. Taken together, Figure 6 helps explain the patterns observed in Figure 5. The positive relationship between anger about racism and Democratic vote choice among White men is driven primarily by Independents rather than Republicans or Democrats. For White men, anger about racism appears most consequential among those whose partisan attachments are weaker and whose vote choices are therefore more susceptible to racialized emotions.
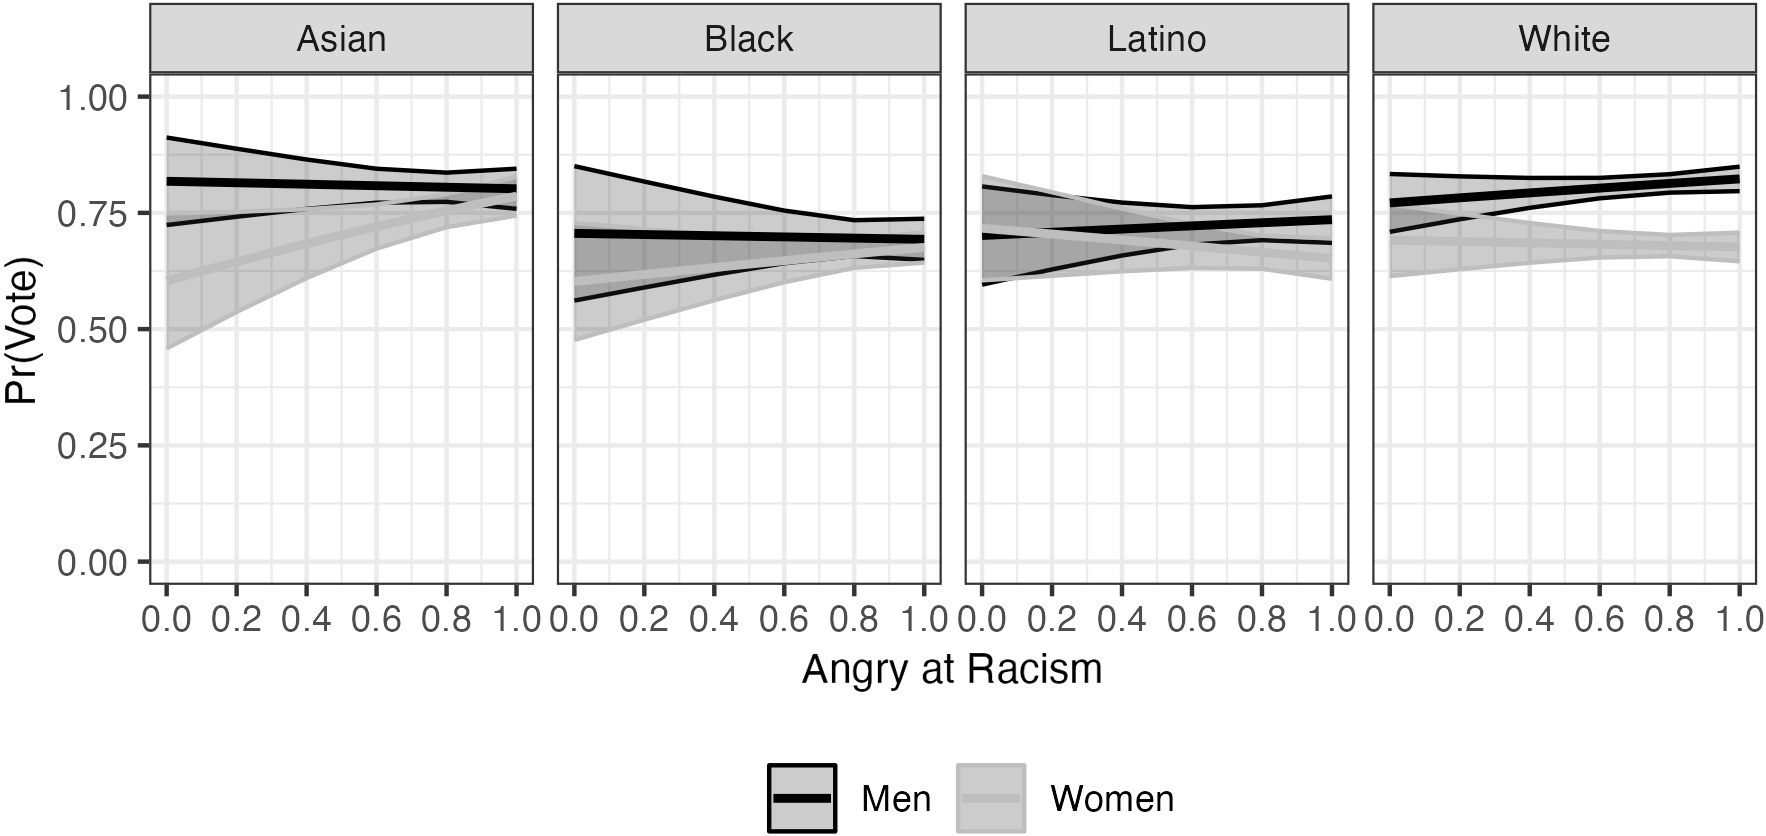
We next assess whether anger about racism influences voter turnout. Figure 7 reveals a substantially weaker relationship between racial anger and turnout than that observed for vote choice. This is consistent with racialized fear, which had little influence on voter turnout. We hypothesize that racial anger would increase turnout and protest for Blacks, Latinos, and Asian Americans (H4). Across racial and gender groups, turnout probabilities remain relatively stable as anger increases, providing little support for H4’s expectation that racial anger would mobilize voting among Black, Latino, and Asian Americans. Although White men exhibit a slight increase in turnout as racial anger rises and White women show a slight decline, these differences are substantively small and do not meaningfully alter overall participation rates. Taken together, these findings provide limited support for H4 and suggest that anger about racism is a relatively weak predictor of turnout across race-gender groups. Rather than motivating electoral participation, racial anger appears more consequential for shaping candidate preferences and, as we show next, non-electoral forms of political engagement.
Predicted probability of turning out to vote in 2020, moving from least angry (0) to most angry (1) at racism, holding all other values at their means. 95% confidence intervals.

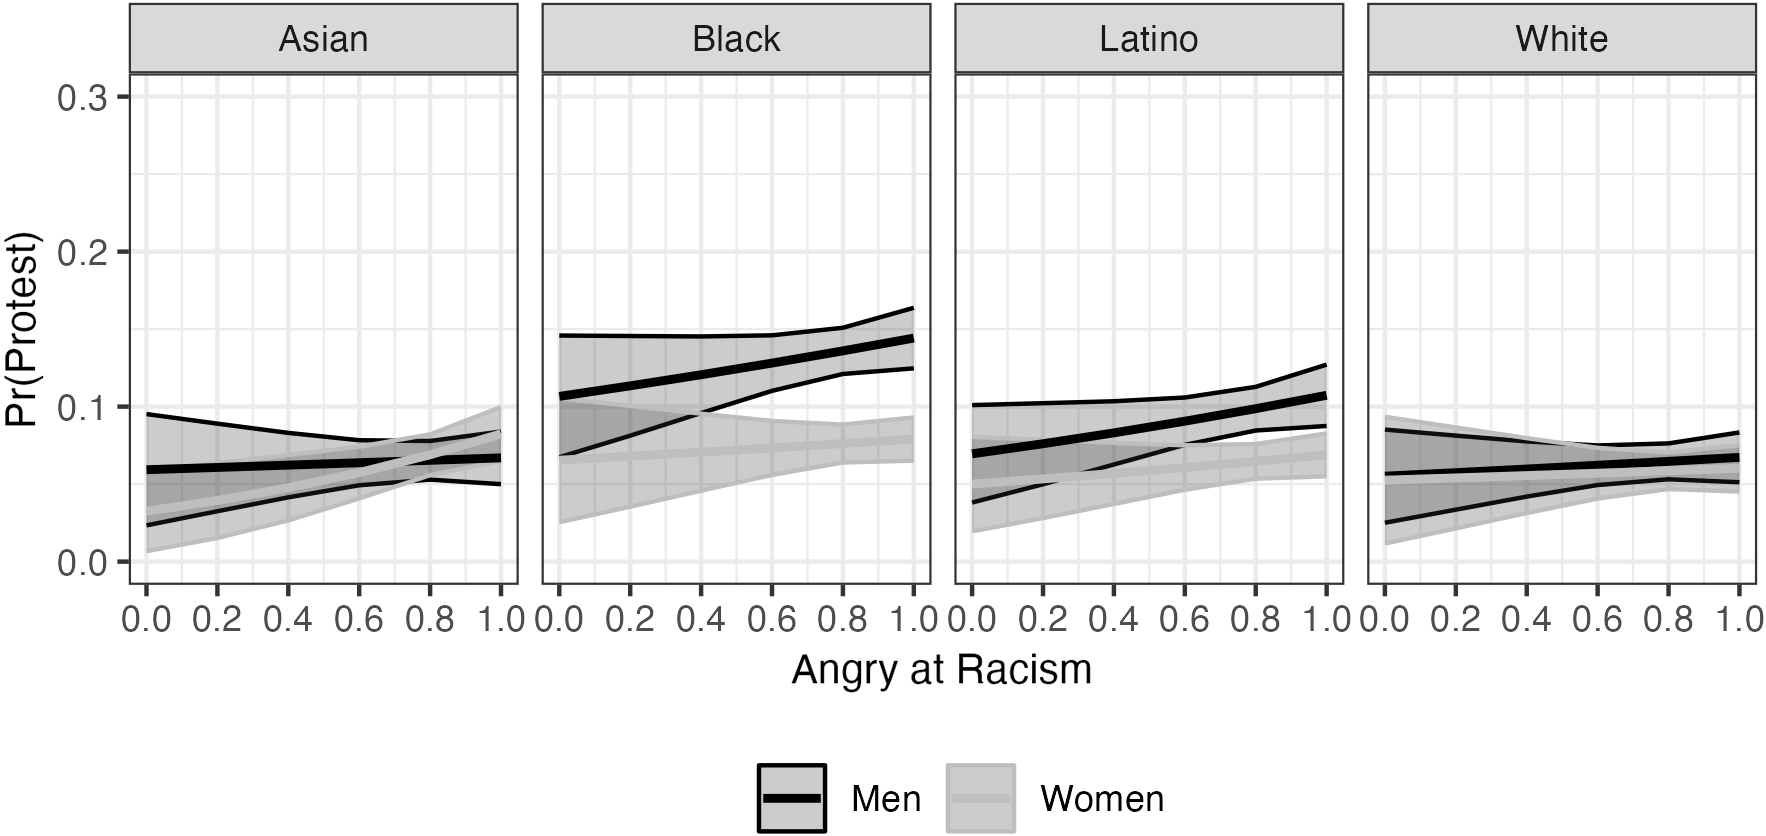
Finally, Figure 8 examines the relationship between anger about racism and protest participation. In contrast to turnout, anger exhibits a clear and consistent mobilizing effect on protest activity. Figure 8 provides support for H4, showing that anger about racism is associated with protest participation among Black, Latino, and Asian respondents. Among Black men, the probability of engaging in protest rises about 5 percentage points. For Black women, anger about racism leads to a smaller, 4-point increase in willingness to engage in protest. Given the relatively low baseline rates of protest participation, these changes represent substantively important increases in political engagement. Latino respondents have a moderate but consistent increase in their willingness to engage in protest. As anger about racism increases, the probability of protest participation rises by approximately three to five percentage points for both men and women. Similarly, Asian American respondents exhibit an increase in willingness to protest.
Predicted probability of protest moving from least angry (0) to most angry (1) at racism, holding all other values at their means. 95% confidence intervals.

While intra-racial gender differences emerge among some groups, particularly Black and Latino respondents, the more notable pattern is the consistency of the positive relationship between racial anger and protest participation across racial groups. Similar to racial fear, racial anger is particularly effective at motivating non-electoral forms of participation, especially among those located at the bottom of the racial hierarchy who seek change outside traditional electoral channels.
Collectively, Figures 5 through 8 demonstrate that anger about racism shapes political behavior unevenly across forms of participation for diverse men and women. Anger is strongly associated with Democratic vote choice and protest participation but exhibits only weak relationships with turnout. These findings suggest that racial anger is more likely to influence how individuals express their political preferences and grievances than whether they participate in elections.
Discussion and Conclusion
Our work began with a straightforward and underexplored examination: how do racialized emotions shape non-electoral and electoral political engagement across race and gender? Drawing on Bonilla Silva’s theory of racialized emotions, we expected that the positionality of groups within the race and gender hierarchy would explain divergent patterns in the effects of emotions on political engagement. Racial and ethnic minorities experience fear and anger about the state of racism, which can spur political engagement, similarly to how White Americans’ fear of other races can mobilize political engagement. Fear and anger are not politically neutral emotions, but when charged with racial animus, they are structured by groups’ positions in the race-gender hierarchy in the United States. For White Americans, fear of other races is linked to concerns about group position and status preservation. For racial and ethnic minorities, fear and anger are more likely to emerge from experiences of marginalization, discrimination, and racial threat. These distinct emotional origins help explain why fear and anger do not translate into political behavior uniformly across groups. By examining the political behavior of Black, Latino, Asian American, and White men and women simultaneously, and intersectionally, our results move beyond a White male-centered emotional politics framework and demonstrate meaningful divergences across race and gender. By doing so, our paper offers a comparative account of how emotions can mobilize and constrain electoral and non-electoral participation.
Our results point to a clear conclusion: positionality in the racial and gender hierarchy and racialized emotions matter in the political behavior of racial, ethnic, and gender groups—including White Americans. First, the relationship between racialized fear and protest participation reveals that fear is not necessarily a demobilizing emotion. While fear had limited effects on turnout and only modest effects on vote choice, it was associated with meaningful increases in protest participation, particularly among Black respondents. Second, our results challenge conventional assumptions about anger, racial anger, and political participation. Political psychologists have long characterized anger as a mobilizing emotion that increases participation. While our findings partially support this claim, they also reveal a more nuanced pattern. Anger about racism was only weakly associated with turnout but strongly associated with both Democratic vote choice and protest participation. Anger about racism appears to function primarily as a force that directs political preferences and channels political action rather than simply increasing participation.
One of the central contributions is the enduring role of anger and fear about race as political emotions. A substantial body of research in political psychology treats anger as a uniformly mobilizing emotion, particularly for electoral participation. Across studies of campaigns, racial threat, and affective polarization, anger is theorized and empirically shown to increase turnout. Our results complicate this by demonstrating that anger about racism is far more informative about vote choice than turnout alone. While racial anger differentiates who individuals support electorally, it does not consistently increase the likelihood that groups participate electorally. At the same time, the protest results underscore that anger is not politically inert. Rather, its mobilizing capacity is domain specific. Anger about racism is more likely to translate into non-electoral participation—particularly protest—among groups for whom institutional channels have historically been less responsive.
Our results demonstrate that emotions about race persistently influence electoral and non-electoral behavior. Protest participation among Black men reflects a persistent form of political engagement, spanning generations of social movement participation alongside Black women. For marginalized groups, particularly Black Americans, non-electoral protest participation remains a salient avenue for political engagement.
Our findings also demonstrate that gender matters, but not always in the way the literature would predict. In several instances, racial differences were larger than gender differences, yet gender continued to shape the magnitude and expression of political behavior within racial groups. This pattern is consistent with the matrix of domination, which suggests that systems of race and gender do not operate independently but instead interact to structure opportunities, constraints, and responses to inequality. As members of a racially marginalized group who simultaneously occupy a socially privileged gender category, Black men experience a unique position within the matrix of oppression. At the same time, the experiences of Black women, Latinas, and Asian American women demonstrate that racialized emotions cannot be understood solely through race. Our findings suggest that scholars must examine how race and gender interact to produce qualitatively different political experiences.
Overall, the divergences of race, gender, emotions, and behavior further reinforce the need to disaggregate participation and to theorize emotions as operating through different behavioral pathways depending on group position in the racial and gendered hierarchy. We need more research about the varied sources and targets of emotions to better understand their political consequences.
Funding statement
The authors received no financial support for the research and authorship of this article.
Competing interests
The authors declare no competing interests.
Appendix
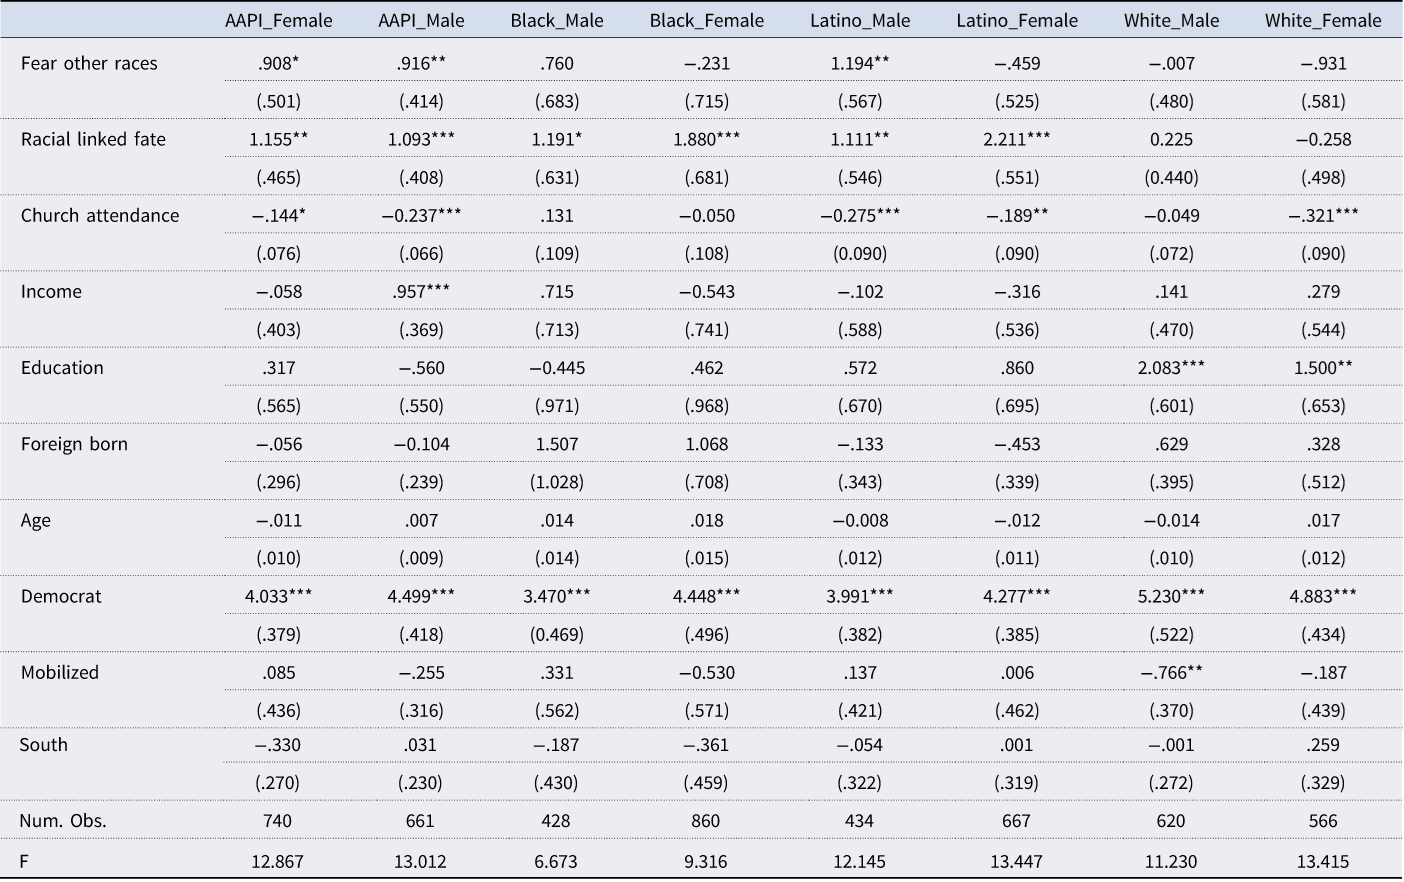
Fear of other races and voting democrat

Appendix Table 1. Long description
The table presents data on fear of other races and voting democrat across various demographic groups, including AAPI, Black, Latino, and White, with further divisions by gender. It has 12 rows and 9 columns. The columns are labeled as AAPI_Female, AAPI_Male, Black_Male, Black_Female, Latino_Male, Latino_Female, White_Male, and White_Female. The rows are labeled as Fear other races, Racial linked fate, Church attendance, Income, Education, Foreign born, Age, Democrat, Mobilized, South, Num. Obs., and F. Each cell contains numerical values and standard errors in parentheses. Notable trends include high values for Democrat across all groups and varying values for Fear other races and Racial linked fate.
Note: *p =. 1, p = .05, *p = .01 Source: 2020 CMPS | N = 17,545 Note: Data are weighted to fall within the margin of error of the adult population in the 2019 ACS 1-year datafile for age, gender, education, nativity, and ancestry.
Fear of other races and voting (Figure 3)

Appendix Table 2. Long description
A table comparing various demographic groups on factors influencing voting behavior. The table has 12 rows and 9 columns. The columns are labeled as AAPI_Female, AAPI_Male, Black_Male, Black_Female, Latino_Male, Latino_Female, White_Male, and White_Female. The rows are labeled as Fear other races, Racial linked fate, Church attendance, Income, Education, Foreign born, Age, Democrat, Mobilized, South, and Num. Obs. Each cell contains a value with a standard error in parentheses. Notable trends include high values for Education across all groups and varying values for Fear other races and Racial linked fate. The table also includes statistical significance indicators for some values.
Note: *p = .1, **p = .05, ***p = .01 Source: 2020 CMPS | N = 17,545 Note: Data are weighted to fall within the margin of | error of the adult population in the 2019 ACS 1-year datafile for age, gender, education, nativity, and ancestry.
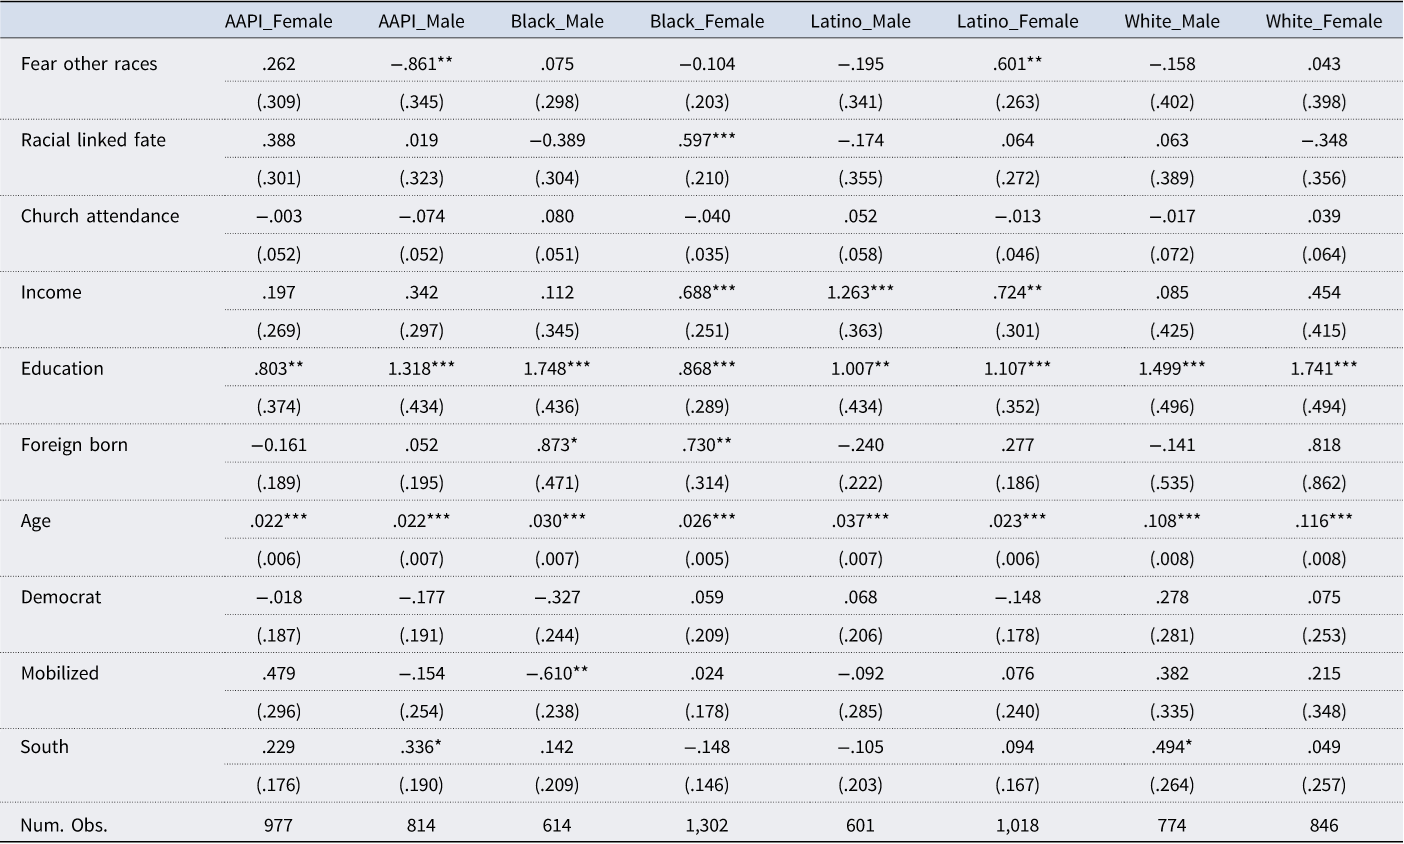
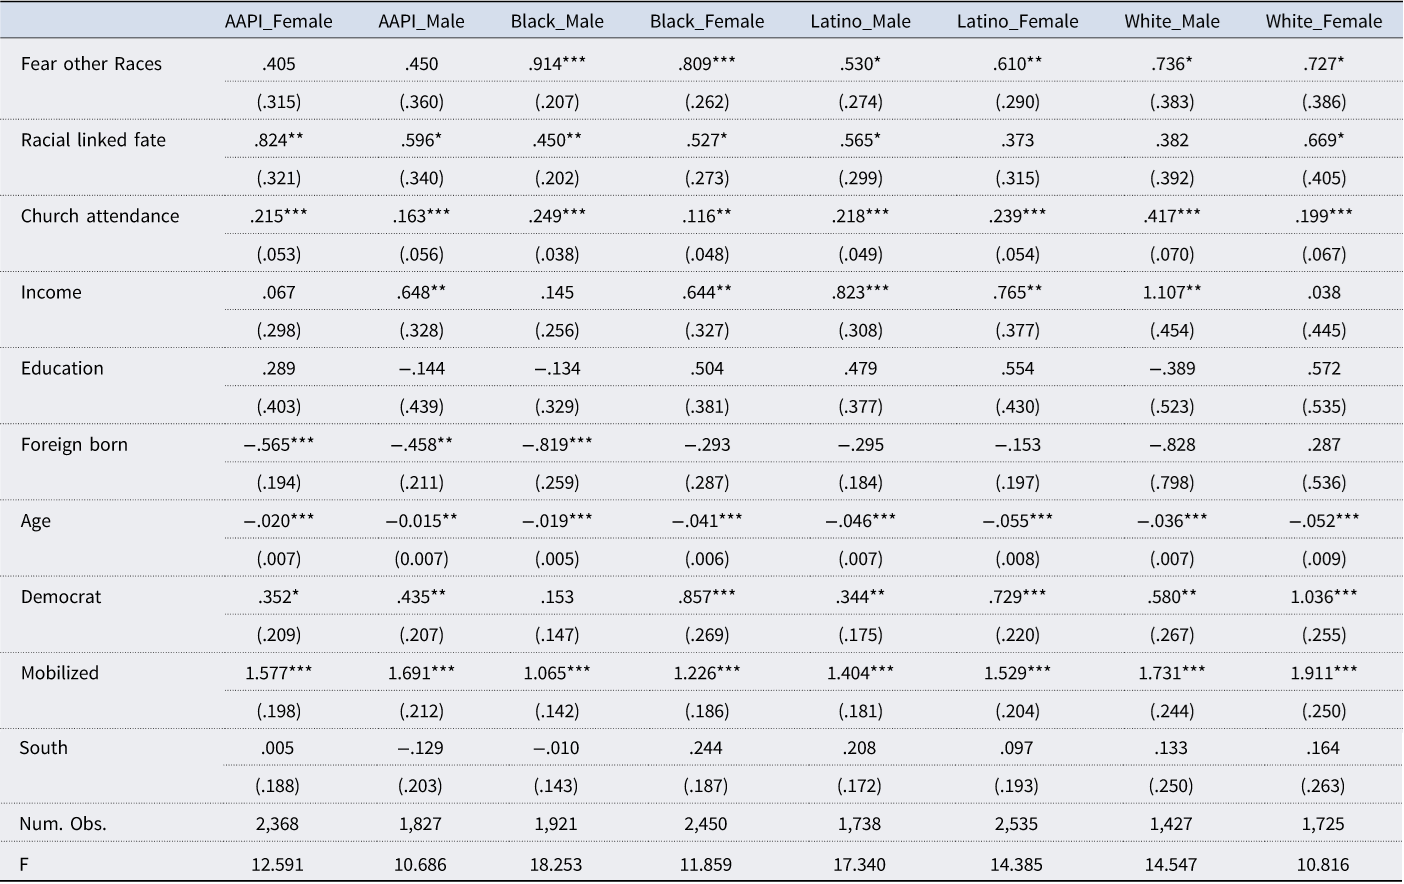
Fear of other races and protest (Figure 4)

Appendix Table 3. Long description
The table presents data on fear of other races and protest across various demographic groups, including AAPI, Black, Latino, and White, with further divisions by gender. It has 12 rows and 9 columns. The columns are labeled as AAPI_Female, AAPI_Male, Black_Male, Black_Female, Latino_Male, Latino_Female, White_Male, and White_Female. The rows are labeled as Fear other Races, Racial linked fate, Church attendance, Income, Education, Foreign born, Age, Democrat, Mobilized, South, Num. Obs., and F. Each cell contains numerical values with standard errors in parentheses. Notable trends include high values for Fear other Races among Black_Male and Black_Female, and high values for Mobilized across all groups. The table also includes statistical significance indicators.
Note: *p = .10, **p = .05, ***p = 0.01 Source: 2020 CMPS | N = 17,545 Note: Data is weighted to fall within the margin of error of the adult population in the 2019 ACS 1-year datafile for age, gender, education, nativity, and ancestry.

Appendix Table 4. Long description
The table presents data on various demographic groups, focusing on their anger at racism and voting democrat. It includes columns for AAPI Female, AAPI Male, Black Male, Black Female, Latino Male, Latino Female, White Male, and White Female. Each column lists values for different variables such as Angry at racism, Racial linked fate, Church attendance, Income, Education, Foreign born, Age, Democrat, Mobilized, South, Independent, Angry at racism: independent, and Angry at racism: democrat. The table also includes the number of observations for each group. Notable trends include high values for anger at racism among Latino and White Females, and high values for voting democrat among Black and White Females.
Note: *p = .1, p = .05, *p = .01 Source: 2020 CMPS | N = 17,545 Note: Data is weighted to fall within the margin of error of the | adult population in the 2019 ACS 1-year datafile for age, gender, education, nativity, and ancestry.
Angry at racism and voting (Figure 7)

Appendix Table 5. Long description
A table comparing various demographic factors and their correlation with anger at racism across different gender and ethnic groups. The table has 12 rows and 9 columns. The columns are labeled as AAPI_Female, AAPI_Male, Black_Male, Black_Female, Latino_Male, Latino_Female, White_Male, and White_Female. The rows are labeled as Angry at racism, Racial linked fate, Church attendance, Income, Education, Foreign born, Age, Democrat, Mobilized, South, and Num. Obs. Each cell contains a value representing the correlation coefficient and standard error for each demographic factor. Notable trends include high education levels correlating with anger at racism across most groups, and significant variations in income and foreign-born status among different ethnic groups.
Note: *p = .1, p = .05, *p = .01 Source: 2020 CMPS | N = 17,545 Note: Data is weighted to fall within the margin of | error of the adult population in the 2019 ACS 1-year datafile for age, gender, education, nativity, and ancestry.
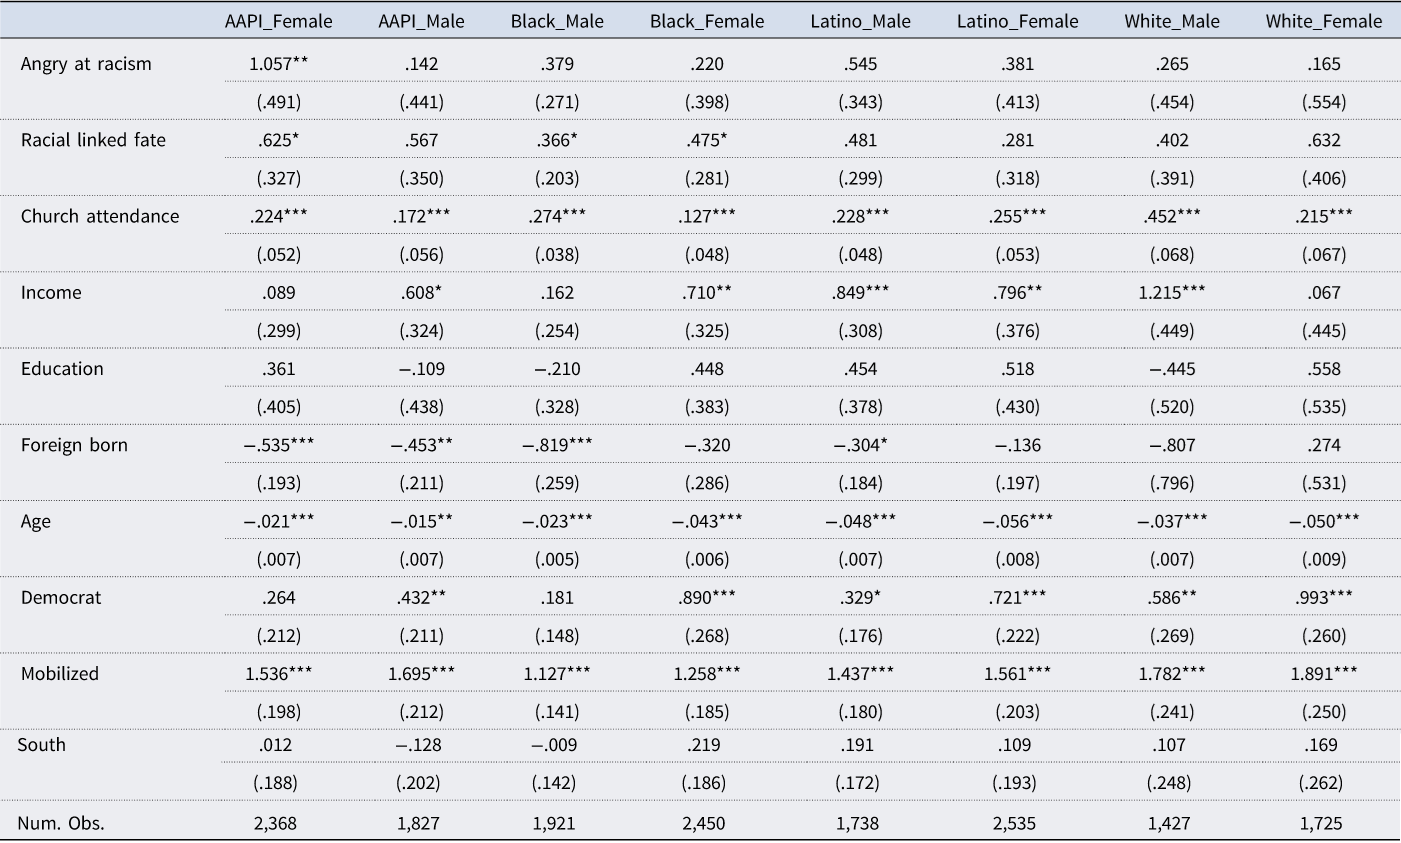
Angry at racism and protest (Figure 8)

Appendix Table 6. Long description
The table presents data on various demographic groups, including AAPI, Black, Latino, and White, both male and female, across different variables. The table has 12 rows and 9 columns. The columns are labeled as AAPI_Female, AAPI_Male, Black_Male, Black_Female, Latino_Male, Latino_Female, White_Male, and White_Female. The rows are labeled as Angry at racism, Racial linked fate, Church attendance, Income, Education, Foreign born, Age, Democrat, Mobilized, South, and Num. Obs. Each cell contains a value and a standard error in parentheses. Notable trends include high mobilization values across all groups, significant church attendance among Black and White females, and varying levels of anger at racism and racial linked fate among the different groups.
Note: *p = .1, p = .05, *p = .01 Source: 2020 CMPS | N = 17,545 Note: Data is weighted to fall within the margin of | error of the adult population in the 2019 ACS 1-year datafile for age, gender, education, nativity, and ancestry.
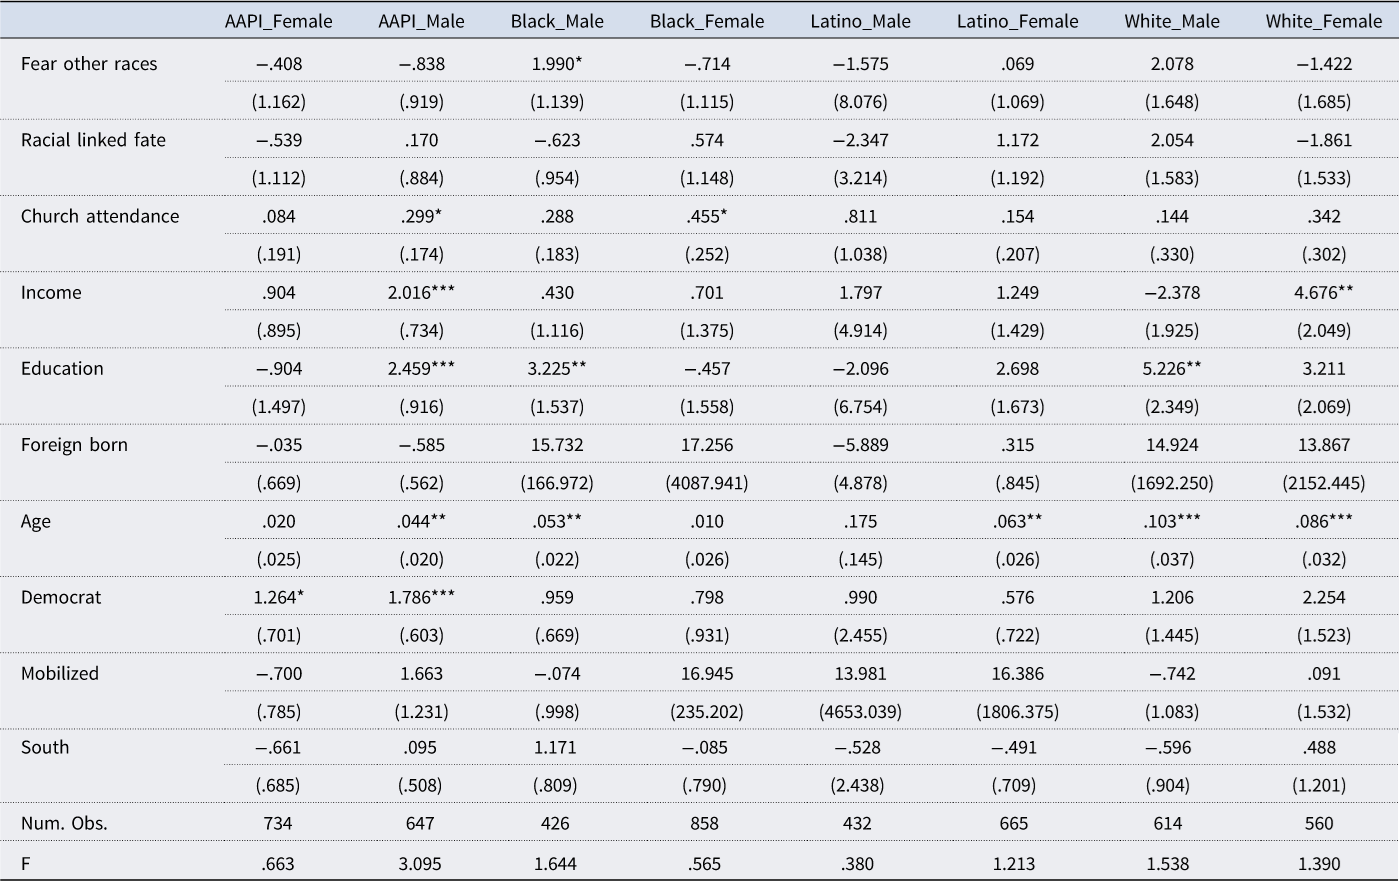
Fear of other races and self reported vote (Figure 3)

Appendix Table 7. Long description
A table comparing fear of other races and self-reported vote across different demographic groups. The table has 12 rows and 9 columns. Column headers are: AAPI_Female, AAPI_Male, Black_Male, Black_Female, Latino_Male, Latino_Female, White_Male, White_Female. Row labels are: Fear other races, Racial linked fate, Church attendance, Income, Education, Foreign born, Age, Democrat, Mobilized, South, Num. Obs., F. Row 1: Fear other races. AAPI_Female, -0.408; AAPI_Male, -0.838; Black_Male, 1.990; Black_Female, -0.714; Latino_Male, -1.575; Latino_Female, 0.069; White_Male, 2.078; White_Female, -1.422. Row 2: Racial linked fate. AAPI_Female, -0.539; AAPI_Male, 0.170; Black_Male, -0.623; Black_Female, 0.574; Latino_Male, -2.347; Latino_Female, 1.172; White_Male, 2.054; White_Female, -1.861. Row 3: Church attendance. AAPI_Female, 0.084; AAPI_Male, 0.299; Black_Male, 0.288; Black_Female, 0.455; Latino_Male, 0.811; Latino_Female, 0.154; White_Male, 0.144; White_Female, 0.342. Row 4: Income. AAPI_Female, 0.904; AAPI_Male, 2.016; Black_Male, 0.430; Black_Female, 0.701; Latino_Male, 1.797; Latino_Female, 1.249; White_Male, -2.378; White_Female, 4.676. Row 5: Education. AAPI_Female, -0.904; AAPI_Male, 2.459; Black_Male, 3.225; Black_Female, -0.457; Latino_Male, -2.096; Latino_Female, 2.698; White_Male, 5.226; White_Female, 3.211. Row 6: Foreign born. AAPI_Female, -0.035; AAPI_Male, -0.585; Black_Male, 15.732; Black_Female, 17.256; Latino_Male, -5.889; Latino_Female, 0.315; White_Male, 14.924; White_Female, 13.867. Row 7: Age. AAPI_Female, 0.020; AAPI_Male, 0.044; Black_Male, 0.053; Black_Female, 0.010; Latino_Male, 0.175; Latino_Female, 0.063; White_Male, 0.103; White_Female, 0.086. Row 8: Democrat. AAPI_Female, 1.264; AAPI_Male, 1.786; Black_Male, 0.959; Black_Female, 0.798; Latino_Male, 0.990; Latino_Female, 0.576; White_Male, 1.206; White_Female, 2.254. Row 9: Mobilized. AAPI_Female, -0.700; AAPI_Male, 1.663; Black_Male, -0.074; Black_Female, 16.945; Latino_Male, 13.981; Latino_Female, 16.386; White_Male, -0.742; White_Female, 0.091. Row 10: South. AAPI_Female, -0.661; AAPI_Male, 0.095; Black_Male, 1.171; Black_Female, -0.085; Latino_Male, -0.528; Latino_Female, -0.491; White_Male, -0.596; White_Female, 0.488. Row 11: Num. Obs. AAPI_Female, 734; AAPI_Male, 647; Black_Male, 426; Black_Female, 858; Latino_Male, 432; Latino_Female, 665; White_Male, 614; White_Female, 560. Row 12: F. AAPI_Female, 0.663; AAPI_Male, 3.095; Black_Male, 1.644; Black_Female, 0.565; Latino_Male, 0.380; Latino_Female, 1.213; White_Male, 1.538; White_Female, 1.390.
Note: *p = .1, p = .05, *p = .01 Source: 2020 CMPS | N = 17,545 Note: Data is weighted to fall within the margin of error of the adult population in the 2019 ACS 1-year datafile for age, gender, education, nativity, and ancestry.



 Open access

