Implications
The sale of cull cows has an impact on the returns of dairy herds, but little is known about the factors that affect their characteristics and carcass value. Data from 555 cull cows showed that animals kept in loose-housing farms outperformed those kept in traditional tie-stall farms in carcass conformation and carcass value; dual-purpose cows (Simmental (SI) and Rendena (RE)) provided better carcass traits and a greater carcass value than specialised dairy cows (Holstein Friesian (HF) and Brown Swiss (BS)); increasing the age at culling had a greater effect on body size and carcass weight (CW) than on the carcass conformation and price; and increasing the calving to culling interval (Calv_Cull) improved the carcass traits and carcass value.
Introduction
Carcasses of cull cows greatly contribute to red meat production. Nearly 30% of beef in the European Union comes from cull cows (Eurostat, 2015), and almost 18% of cattle slaughtered in the United States in 2014 were cull cows (US Department of Agriculture, 2015). The contribution of dairy cows to beef production varies according to country (Cabaraux et al., Reference Cabaraux, Dufrasne, Roux, Istasse and Hornick2005), but is generally substantial. The sale of cull cows, therefore, accounts for a significant share of the total monetary returns of dairy herds (Seegers et al., Reference Seegers, Bareille and Beaudeau1998). Dairy cows are culled for various reasons, such as failure to reproduce, injury, poor performance, disease events and age (Pinedo et al., Reference Pinedo, De Vries and Webb2010), and they are frequently disposed of without a finishing period. Hence, cull cows are characterised by large variations in live animal characteristics, carcass traits and market value due to differences in breed, age, stage of lactation and body condition (Vestergaard et al., Reference Vestergaard, Madsen, Bligaard, Bredahl, Rasmussen and Andersen2007).
Scientific information on the slaughter performance of dairy cull cows is scarce, often derived from studies dealing with the fattening of cull cows, frequently regarding HF. Moreover, the value of carcasses from culled cows has been seldom taken into account. McHugh et al. (Reference McHugh, Fahey, Evans and Berry2010) investigated several factors associated with the price of cows sold at livestock marts in Ireland, but did not provide any information on the live animals characteristics, dressing percentage (DP) and slaughter performance. Bazzoli et al. (Reference Bazzoli, De Marchi, Cecchinato, Berry and Bittante2014) studied the effects of breed and age on the CW and value of slaughtered cows, but did not consider any live animal traits. In addition, the effects of farm type, which may affect the characteristics and price of cull cows according to differences in the housing system, feeding regime and management procedures, have rarely been investigated.
Improved knowledge of the characteristics and beef value of cull cows could be useful for the improvement of culling strategies within dairy herds, for the definition of selection indices for dual-purpose breeds, and for life cycle assessment procedures for improving the allocation of the environmental impact when different dairy breeds and farming systems are involved. This study investigated the effects of farm type, which was characterised by a combination of housing and feeding systems; breed; age at slaughter (AGE); and the Calv_Cull on live animal and carcass characteristics as well as the price of dairy and dual-purpose cull cows.
Material and methods
Farms and animals
This study is based on the data of 767 cull dairy and dual-purpose cows collected over a 6-month period by the Breeders Federation of Trento Province (BFTP, Trento, Italy) from dairy farms of that province. The cows were collected on Wednesdays and kept in the BFTP barn until they were moved to a commercial slaughterhouse the following day. The information for each animal included herd, breed, birth date and date of the last calving. The classification of each farm was based on the results of a previous study (Sturaro et al., Reference Sturaro, Marchiori, Penasa, Ramanzin and Bittante2013). The farms were first classified according to the housing system as loose (LO), where cows were kept loose in pens and milked in a milking parlour, and tied (TIE), where cows were kept tied and milked at the stall. The LO farms were further classified as feeding total mixed rations (TMR) with (LO1) or without silages (LO2) or not feeding TMR (LO3). In traditional farms, the rations for lactating cows are usually based on meadow hay and compound feeds, whereas pasture is seldom used in permanent farms. As Trento is an alpine province, the TIE farms were classified as practicing (TIE1) or not practicing (TIE2) the summer transhumance to temporary farms in the highland pastures.
Live animal characteristics and carcass traits
The cows were weighed and measured for heart girth and wither height. Moreover, the same operator scored cows for both body condition, according to Edmonson et al. (Reference Edmonson, Lean, Weaver, Farver and Webster1989) from 1 (lean) to 5 (fat) with increments of 0.25, and for fleshiness conformation, applying the SEUROP grading system used for carcasses (European Economic Community, 1991) according to six classes, from P (poor, in this case given a score of 1.00) to S (superior, 6.00), with subclasses of 0.33. The following data were collected at the slaughterhouse: hot CW, DP, carcass conformation and fatness score (according to the SEUROP grading system, on a six and five–point scale, respectively, with subclasses of 0.33) and total carcass value (€). The carcass price was calculated as the ratio of the carcass value to CW (€/kg).
Data editing and statistical analysis
Cows with missing information for birth or last calving date, or those from uncertain farms, were removed from the data set. A minimum of 40 animals/breed was set to include the breed in the study, and the data from Alpine Grey, Jersey and crossbred cows were removed. The final data set consisted of 555 cows of the following breeds: HF (233 cows), BS (238 cows), dual purpose SI (44 cows) and local dual purpose RE (40 cows). The cull cows came from 182 herds, and nearly half of them provided only one cow. The live characteristics and carcass traits of the cows were analysed using the SAS GLM procedure (SAS Institute, 2008). The significance of the effects in the model was based on the F-statistic, and residuals were assumed to be normally distributed with a mean of 0 and a variance of σ 2 e . The fitted general model was
 $$y_{{ijklmn}} {\rm \,{\equals}}\,\mu {\rm {\plus}}FT_{i} {\rm {\plus}}B_{j} {\rm {\plus}}MS_{k} {\rm {\plus}}AS_{l} {\rm {\plus}}CCl_{m} {\rm {\plus}}e_{{ijklmn}} $$
where y ijklmn is the observed trait; μ the overall intercept of the model; FT i the fixed effect of the ith farm type (LO1, LO2, LO3, TIE1 and TIE2), B j the fixed effect of the jth breed (j=HF, BS, SI and RE); MS k the fixed effect of the kth month of slaughter (k=1 to 6); AS l the fixed effect of the lth class of the age of the cull cow at slaughter (l: 1=⩽4 years; 2=>4 to ⩽5 years; 3=>5 to ⩽6 years; 4=>6 to ⩽7 years; 5=>7 to ⩽8 years; and 6=>8 years); CCI m the fixed effect of the mth class of the Calv_Cull (m: 1=<100 days; 2=between 101 and 200 days; 3=between 201 and 300 days; 4=between 301 and 400 days; and 5=>400 days); and e ijklmn is the random residual.
Even if mixed breed farms are widespread in the province of Trento, the interaction between the farm type and breed of cows was not included in the model of analysis due to the small number of cows from the dual-purpose breeds. The following orthogonal contrasts were planned to investigate the differences among the farm types: (a) between the housing system of the farms ((LO1+LO2+LO3) v. (TIE1+TIE2)); (b) within farms with a loose-housing system and between those that feed TMR and those that do not ((LO1+LO2) v. LO3); (c) within farms with a loose-housing system feeding TMR and between those that feed silages and those that do not (LO1 v. LO2); and (d) within tie-stall farms and between those that practice summer transhumance and those that do not (TIE1 v. TIE2). The following orthogonal contrasts were planned to investigate the differences among breeds: (a) between dairy and dual-purpose breeds ((HF+BS) v. (SI+RE)); (b) between the two dairy breeds (HF v. BS); and (c) between the two dual-purpose breeds (SI v. RE).
Results
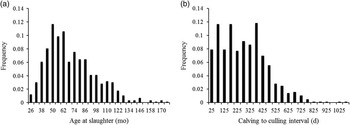
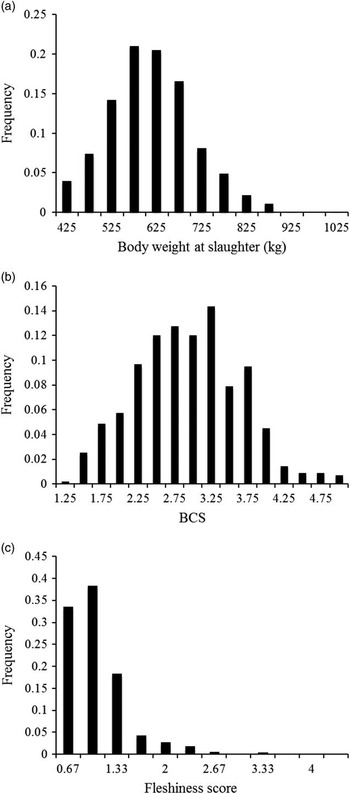
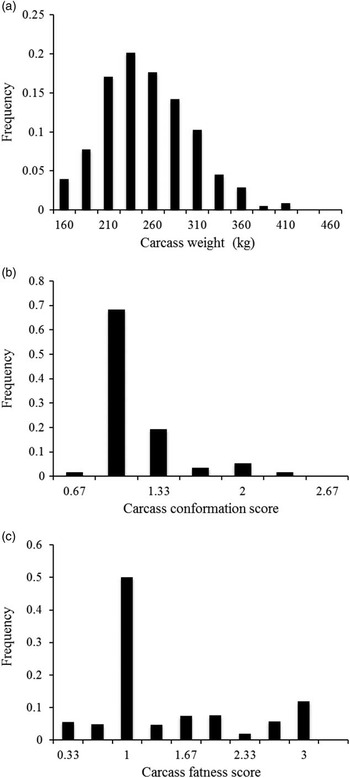
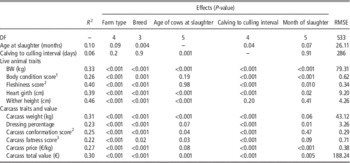
On an average, cows were slaughtered at ~6 years of age and nearly 290 days after the last calving (Figure 1), but we found wide variations in both traits. BW at slaughter (Figure 2) averaged 615 kg, and the CV exceeded 15%. The body condition score (BCS) of cull cows ranged between 1.25 and 5, with a mean of 2.91 and a modal class of 3.25. Nearly 50% of the cows fell within the BCS range of 2.75 to 3.50. Nearly 90% of the cows had fleshiness scores ranging from 0.67 to 1.33 (corresponding to P− to P+ in the SEUROP grading system). The carcass weight averaged 257 kg, with an 18% CV (Figure 3). Nearly 70% of the carcasses were graded 1 for fleshiness (i.e. P in the EUROP grading system), and nearly 50% were graded 1 for fatness. The farm type and breed affected most of the traits recorded (Table 1). The age of the cows at slaughter influenced the Calv_Cull, BW, body measurements and CW, but neither the fleshiness nor fatness scores, both in vivo and postmortem, nor the carcass price. Conversely, Calv_Cull was strongly related to all of the traits considered, except wither height.
Frequency distribution for (a) age at slaughter (mean=71.4 months, SD=27.2 months) and (b) calving to culling interval (mean=285 days, SD=187 days).

Frequency distribution for (a) BW at slaughter (mean=615 kg, SD=95 kg), (b) body condition score (BCS; mean=2.93, SD=0.71) and (c) fleshiness score (on a six-point scale divided into subclasses of 0.33; mean=1.05, SD=0.44).

Frequency distribution for (a) carcass weight (mean=257 kg, SD=51 kg), (b) carcass conformation score (on a six-point scale divided into subclasses of 0.33; mean=1.16, SD=0.32) and (c) carcass fatness score (on a five-point scale divided into subclasses of 0.33; mean=1.46, SD=0.79).

Results of ANOVA (R 2, levels of significance and RMSE) for the age at slaughter, calving to culling interval, live animal traits and carcass traits

RMSE=root mean square error.
1 On a five-point scale with subclasses of 0.25 (the greater the fatter).
2 On a six-point scale with subclasses of 0.33 (the greater the better conformation).
3 On a five-point scale with subclasses of 0.33 (the greater the fatter).
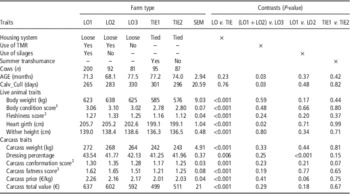
Effects of farm type
Nearly two-thirds of the cull cows were kept loose (Table 2). Among them, nearly half received a TMR with silages (mainly corn silage) and 25% received a TMR based on dry feedstuffs moisturised with water. The cows kept in tie-stall farms were almost equally divided with those from farms practicing or not practicing summer transhumance to a highland pasture. Compared with those from tie-stall housing systems, the cows kept in a loose-housing system showed greater values for BW and measurements, CW and DP, as well as better scores for fleshiness and fatness, both before and after slaughtering. Consequently, compared with cull cows kept in tie-stall farms, those kept in a loose-housing system achieved a 9% higher price for carcasses and an increase in carcass total value of ~100 €. Conversely, the differences in management practices within free- or tie-stall farms exerted only minor effects.
Least squares means of the farm type on the age at slaughter (AGE), calving to culling interval (Calv_Cull), live animal traits and carcass traits

LO1=loose-housing system, TMR and silage in the diet; LO2=loose-housing system, TMR and no silage in the diet; LO3=loose-housing system and no TMR; TIE1=tie-stall housing system, no TMR and summer transhumance; TIE2=tie-stall housing system, no TMR and no summer transhumance; TMR=total mixed ratio.
1 On a five-point scale with subclasses of 0.25 (the greater the fatter).
2 On a six-point scale with subclasses of 0.33 (the greater the better conformation).
3 On a five-point scale with subclasses of 0.33 (the greater the fatter).
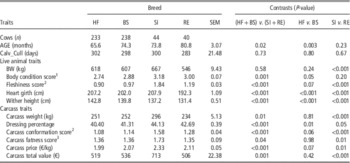
Effects of breed
In the present study, the specialised dairy breeds (HF and BS) accounted for nearly 85% of the cull cows studied (Table 3). On average, cows from these breeds were younger at slaughter, were scored lower for BCS and fleshiness, and had greater body measurements, lower DP, CW and conformations than those from dual-purpose breeds. As a consequence, the price per kg of the carcass and its total value were 9% and 16% greater in dual-purpose than in specialised dairy breeds, respectively. Within dairy breeds, HF cows were younger and had greater body size measurements and BW than BS, whereas HF and BS provided carcasses of comparable weight, conformation, fatness, price and total value. Conversely, SI cull cows had a greater BW and CW, a better fleshiness and carcass conformation, and greater values for body size measurements than RE cull cows. We also found that SI had a greater DP and price per kg of carcass than RE cull cows and, consequently, a greater total carcass value (+41%).
Least squares means of the cow breed on the age at slaughter (AGE), calving to culling interval (Calv_Cull), live animal traits and carcass traits

HF=Holstein Friesian; BS=Brown Swiss; SI=Simmental; RE=Rendena.
1 On a five-point scale with subclasses of 0.25 (the greater the fatter).
2 On a six-point scale with subclasses of 0.33 (the greater the better conformation).
3 On a five-point scale with subclasses of 0.33 (the greater the fatter).
Effects of the age at slaughter and calving to culling interval
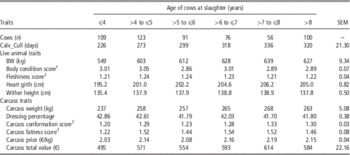
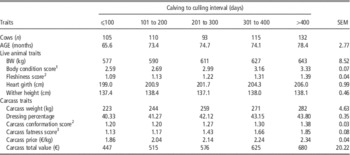
The Calv_Cull, BW and body measurements increased with increasing AGE until cows were 5 to 6 years old (Table 4), whereas differences among age classes were only nominal afterwards (P>0.05, data not shown in the table). In addition, the CW tended to increase with increasing AGE, even if the differences concerned only the youngest cows compared with the others (P<0.05, data not shown in the table). The conformation and fatness score of the carcasses and their price were slightly influenced by AGE. Therefore, the increase of the carcass total value observed at increasing AGE was entirely due to the concurrent increase of the CW. BW, BCS, fleshiness score and all of the carcass traits increased almost linearly with increasing Calv_Cull (Table 5). The cows that were culled 400 or more days after calving, compared with those at the beginning of lactation, had a 52% greater carcass value (P<0.05, data not shown in the table) due to an improvement of BW (+11%), DP (+9%), CW (+26%) and carcass price (+26%).
Least squares means of the age of cows at slaughter for calving to culling interval (Calv_Cull), live animal traits and carcass traits

1 On a five-point scale with subclasses of 0.25 (the greater the fatter).
2 On a six-point scale with subclasses of 0.33 (the greater the better conformation).
3 On a five-point scale with subclasses of 0.33 (the greater the fatter).
Least squares means of the calving to culling interval for the age at slaughter (AGE), live animal traits and carcass traits

1 On a five-point scale with subclasses of 0.25 (the greater the fatter).
2 On a six-point scale with subclasses of 0.33 (the greater the better conformation).
3 On a five-point scale with subclasses of 0.33 (the greater the fatter).
Discussion
Age of cows at slaughter
The average age of cull cows in the present study (71.4 months) was slightly lower than that (74 months) reported by Bazzoli et al. (Reference Bazzoli, De Marchi, Cecchinato, Berry and Bittante2014) for cows culled in the same province between 2003 and 2011. These authors observed a reduction in the average AGE of all breeds examined over the period considered. The farm type affected the AGE within the free-stall farms because the cows kept in the loose-housing system and fed TMR were slaughtered nearly 8 months earlier than cows kept in free-stall farms, but fed without TMR (Table 2). This probably reflects the differences in the animal productivity, as cows fed TMR produce more milk than those of the other groups (Bergamaschi et al., Reference Bergamaschi, Aprea, Betta, Biasioli, Cipolat-Gotet, Cecchinato, Bittante and Gasperi2015). Information on AGE in relation to farm type is scarce: Ahlman et al. (Reference Ahlman, Berglund, Rydhmer and Strandberg2011) observed different reasons for culling but not different AGE when comparing conventional and organic dairy farms, whereas Bielfeldt et al. (Reference Bielfeldt, Tolle, Badertscher and Krieter2006) reported that cows in loose-housing systems had slightly longer production periods than those housed in tie-stall barns. The average AGE also differed according to the breed, with the lowest being HF and the greatest RE. The ranking of the breeds for AGE is consistent with the statistics for the average number of lactations of dairy cows kept in the province of Trento (2.38 for HF to 3.35 for RE, Associazione Italiana Allevatori, 2014), which can be assumed to be an indicator of longevity. The age of the cows at culling is a function of the age at first calving and the length of their productive life, which is defined as the number of days from first calving until culling (Ducrocq, Reference Ducrocq1994). The average age at first calving in the province of Trento ranges between 28.6 months in HF and 34.6 months in RE (Associazione Italiana Allevatori, 2014), but differences in the life productivity among breeds were still evident after adjusting for differences in age at first calving. Garcia-Peniche et al. (Reference Garcia-Peniche, Cassell and Misztal2006) reported that BS cows lived longer than HF cows, and Hare et al. (Reference Hare, Norman and Wright2006) found a lower mean number of parities in HF than in BS cows.
In this study, the lower Calv_Cull of cows that were younger at slaughter and lower age of cows culled in the first 100 DIM can be partly explained by a greater proportion of involuntary culling of younger cows, particularly those at first calving, than of cows in other classes at the age of culling. Heikkila et al. (Reference Heikkila, Nousiainen and Jauhiainen2008) reported that in Finnish HF cows, the probability of being culled increased with the parity number, but the probability that culling was involuntary was greater in first than in other parity cows. Seegers et al. (Reference Seegers, Bareille and Beaudeau1998) found twice as many primiparous as multiparous cows among animals culled in the first 100 days after calving. This supports the lower AGE found for cows culled during the first 100 days of lactation compared with cows culled in other classes of Calv_Cull. From the results of the present study, a lower age or lower Calv_Cull leads to a lower overall carcass value of culled cows.
Live animal BW and measures
The increase in BW and body size with AGE was expected, and most traits reached their maximum value at ~5 to 6 years of age, and differences among older cows were only nominal. The observed rate of increase in BW with age was lower than that reported for HF cows by Koenen et al. (Reference Koenen, Groen and Gengler1999) and Hazel et al. (Reference Hazel, Heins, Seykora and Hansen2014). This could be explained considering that our comparisons are based on age classes (12 months) and not on parities (generally longer than 12 months). Moreover, the majority of cows are slaughtered in the mid or late stages of lactation, when differences among parities are expected to be lower than in early lactation. The farm type heavily affected the BW (P<0.001), and cows kept in loose system farms were nearly 8% heavier than cows kept in tie-stall herds. In addition, the body measurements were greater in culled cows kept in free-stalls compared with those kept in tie-stall farms. These effects could be explained by considering the better management and feeding conditions that characterise the loose system dairy farms, even though cows in these systems should experience greater competition for nutrients between growth and lactation because of their greater productivity (Sturaro et al., Reference Sturaro, Marchiori, Penasa, Ramanzin and Bittante2013).
The BW and body measurements differed according to breed category (dairy or dual-purpose), but we also observed large variations between breeds within each category. Specialised dairy cows tend to be heavier and taller than dual-purpose cows. Within breed categories, HF and SI cows are bigger compared with BS and RE cows, respectively. However, in the case of the two dual-purpose breeds, the difference in body size was associated with a large difference in BW, whereas the two specialised dairy breeds differed in skeletal size, but had similar BW. Despite their heavier BW, SI culled cows were characterised by a shorter withers height than specialised dairy breeds, which indicated a different conformation. There is sparse literature on the body size characteristics of cull cows. Enevoldsen and Kristensen (Reference Enevoldsen and Kristensen1997) reported BW ranging between 574 and 636 kg for HF cows from first to fifth parity, respectively. The heart girth of HF cows found in this study was comparable with the results reported by Berry et al. (Reference Berry, Horan and Dillon2005) for different strains of HF, whereas Yan et al. (Reference Yan, Mayne, Patterson and Agnew2009) and Hazel et al. (Reference Hazel, Heins, Seykora and Hansen2014) reported lower BW and body measurements for HF cows. De Haas et al. (Reference De Haas, Janss and Kadarmideen2007) reported a greater BW and body size in HF than in BS cows.
Body condition and fleshiness scores
Although the relationships between farm type and BCS or fleshiness score have rarely been investigated, the better values observed for both traits in cows culled from free-stall compared with tie-stall dairy farms might be related to the aforementioned better management and feeding of loose-housing farms. Concerning breed effects, the average BCS found in the present study was lower than that previously reported for the same breeds in large-scale observational studies in HF (Gallo et al., Reference Gallo, Carnier, Cassandro, Dal Zotto and Bittante1996), BS (Tiezzi et al., Reference Tiezzi, Maltecca, Cecchinato, Penasa and Bittante2013), SI (Frigo et al., Reference Frigo, Samorè, Vicario, Bagnato and Pedron2013) and RE cows (Gallo et al., Reference Gallo, Carnier, Cassandro, Mantovani, Bailoni, Contiero and Bittante1998). The BCS found for HF in this study was comparable with that found in HF cull cows slaughtered without a previous finishing period (Vestergaard et al., Reference Vestergaard, Madsen, Bligaard, Bredahl, Rasmussen and Andersen2007; Yan et al., Reference Yan, Mayne, Patterson and Agnew2009; Hazel et al., Reference Hazel, Heins, Seykora and Hansen2014). The greater BCS observed in dual-purpose than in dairy cows was consistent with previous findings (Minchin et al., Reference Minchin, Buckley, Kenny, Keane, Shalloo and O’Donovan2009; Hazel et al., Reference Hazel, Heins, Seykora and Hansen2014). The progressive increase in BCS with increasing Calv_Cull is consistent with the pattern of change in BCS observed during lactation (Gallo et al., Reference Gallo, Carnier, Cassandro, Dal Zotto and Bittante1996 and Reference Gallo, Mantovani, Carnier, Cassandro and Bittante2001). The fleshiness scoring of lactating and culled cows has been rarely studied. Traits related to cow muscularity are included in the selection index of dual-purpose breeds in both Italian SI and RE (Frigo et al., Reference Frigo, Samorè, Vicario, Bagnato and Pedron2013; Mazza et al., Reference Mazza, Guzzo, Sartori, Berry and Mantovani2014). The fleshiness scores exhibited a pattern similar to BCS throughout lactation, which suggests that culling should be conducted as late in the lactation stage as possible to improve the cull cow condition and carcass price.
Carcass traits and overall carcass value
Cull cows kept in free-stalls resulted in carcasses with a 21% greater economic value than those kept in tie-stall farms because of the greater carcass weight (+11%) and higher price (+9%) paid for carcasses exhibiting better conformation and fatness scores. It should be noted that the feeding costs were not taken into account in this study, and consequently, the greater overall carcass value does not necessarily imply greater overall cull cow profitability. The literature describing the effect of farm type on the carcass traits and price of culled dairy cows is very scarce, whereas more data can be found regarding the effects of breed. The average CW of cull cows in the present study agrees with the values reported by Bazzoli et al. (Reference Bazzoli, De Marchi, Cecchinato, Berry and Bittante2014) for cows of the same breeds, although we found a greater CW in HF and SI cows and a lower CW in RE cows. The carcass price in the present study was nearly 20% greater for HF and BS cows and nearly 30% greater for SI cows than the average prices reported by Bazzoli et al. (Reference Bazzoli, De Marchi, Cecchinato, Berry and Bittante2014) for the same breeds in the period between 2003 and 2011, whereas the price paid per kg of carcass from RE cull cows was nearly the same. Overall, the carcass value was 25% to 35% greater for dairy breeds and SI cows, but 6% lower for RE cows compared with the previous study (Bazzoli et al., Reference Bazzoli, De Marchi, Cecchinato, Berry and Bittante2014). In a large-scale Irish survey, McHugh et al. (Reference McHugh, Fahey, Evans and Berry2010) reported average total values of HF and SI cows similar to those found in the present study, although in their study, the cows were sold alive and were partly intended to be used for breeding rather than slaughtering. Compared to HF cows, SI cull cows have been reported to have heavier carcasses, better DP and a greater economic carcass value (Kaufmann et al., Reference Kaufmann, Leuenberger and Künzi1996). Similarly, Minchin et al. (Reference Minchin, Buckley, Kenny, Keane, Shalloo and O’Donovan2009) found that cows sired by late maturing beef breeds (including SI) had heavier carcasses as well as better DP, carcass conformation and fatness than cows sired by HF. In an analysis of the genetic trends in the RE breed from 2000 to 2009, Mazza et al. (Reference Mazza, Guzzo, Sartori, Berry and Mantovani2014) found a deterioration in the genetic merit for fleshiness and concluded that RE cattle are becoming similar to specialised milk-producing animals in their morphology, which may have implications for the breed’s beef output component. This is a risk for native Alpine cattle breeds, where revenue from meat production may partially compensate for their lower milk yield compared with high-milking breeds.
The carcass weight increased with AGE, which was only partly offset by a concurrent slight decrease in the DP. As the carcass price per kg was not affected by AGE, the carcass value followed the same trend as CW throughout the cows’ lifespan. Seegers et al. (Reference Seegers, Bareille and Beaudeau1998) also reported an increase in CW with a parity number that had the highest values at four to six lactations. An increase in Calv_Cull improved all of the carcass traits, notably, the total value and price per kg of carcasses. This is consistent with Seegers et al. (Reference Seegers, Bareille and Beaudeau1998), who observed that cows culled at the end of their current lactation had the greatest CW, as well as with Groenendaal et al. (Reference Groenendaal, Galligan and Mulder2004), who reported an increase in the DP with increasing months in lactation. The effect of Calv_Cull could be ascribed to the increase in feed intake and simultaneous decrease in milk yield with advancing lactation, but it is also possible that some cows culled later in lactation benefited from a finishing period, which can improve the carcass traits and even eating quality (Verstergaard et al., Reference Vestergaard, Madsen, Bligaard, Bredahl, Rasmussen and Andersen2007). However, no detailed information is available for the feeding regimen of cull cows in this study. Except for cows slaughtered under emergency conditions, farmers are expected to cull cows with a negative marginal profit regarding daily milk production, which generally occurs towards the end of lactation. However, in this study, cows appeared to be culled throughout the entire milking period, and nearly 19% of the cows in this study were culled within the first 100 days after calving. These results support a reconsideration of the culling decisions of dairy herds in view of improving the carcass value of cull cows.
Conclusions
In conclusion, cull cows represent a supplementary source of income for dairy herds, but the carcass value of cull cows exhibited a large variation according to farm type, breed, age and days in milk at slaughter. Therefore, the decision of when to cull cows, at least for those that are voluntarily culled, should also take into account such variations in an effort to improve the carcass price of cows. In particular, increasing Calv_Cull led to an increase of BCS, CW, carcass conformation and fatness scores; markedly improved the carcass price; and therefore supports the delay of slaughter whenever possible. However, the profitability of such a strategy will also depend on the extra costs related to the decision of delaying culling events, which needs to be assessed in further studies.
Acknowledgements
The Authors would like to thank the Province of Trento for funding this research. The authors also thank the Provincial Federation of Breeders of Trento and Dr Ilario Bazzoli, Roberto Ducati, Roberto Chimetto, Lorenzo Giorato and Valter Giraldo for the support of data collection.