INTRODUCTION
The vertical travel accuracy of the treatment table is an important issue especially for patients aligned at a table height different from the height at which the treatment is given. Normally, the alignment is carried out by matching external markers on the patient immobilisation system or the skin of the patient to the sagittal, coronal and vertical laser lines. If the isocentre of the treatment is planned to be inside the patient, the table is moved to bring the planned isocentre inside the patient to coincide with the isocentre of the accelerator. For isocentric treatments, the image-based verification for correct patient position is preferably performed at the position used for the treatment. Treatments planned at large source-skin distances (SSD), the image-based verification of the patient position become inconvenient due to limited space and the risk of collision with the image system and the patient. For large SSD treatments, the image verification must be carried out at another tabletop position than the position at which the treatment is delivered. Therefore, the position at which the patient actually is treated at large SSD depends on the travel accuracy of the treatment table. A quality assurance procedure on regular basis is required to verify the precision and stability of the vertical travel. The procedure should include a description of how to improve the vertical travel by adjustments. However, the development of the procedure requires a general understanding of the features and limitations of the treatment table performance. As a first step, we present a new experimental method to evaluate and optimise the vertical travel accuracy of the treatment table. Previously, a simple and efficient method to measure the inclination of the treatment table axis against the vertical axis has been investigated using a three-axis gaugeReference Karger, Hartmann, Heeg and Jäkel1. The vertical room laser lines were used as reference.
This publication describes an optical method based on a digital USB-microscope as the detector and a vertical wire as the reference. The experimental setup is simple and the measurements are easy to perform. The position of the tabletop is extracted from analyses of the acquired images of the wire. The uncertainty in the position detection method has a standard deviation around 0.02 mm.
MATERIALS AND METHODS
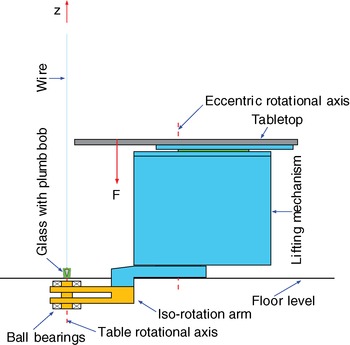
Two Elekta (Elekta®, Sweden) Precise Tables installed at accelerator 1 (Ac1) and 4 (Ac4) at our hospital were included in the study. The tables were identified as product no. MRT 5071, serial no. 12 5624 (Ac1) and 12 5783 (Ac4). Both tables were installed in a shallow pit concrete cavity. The tabletops were a product of Medical Intelligence Medizintechnik GmbH (Elekta®, Sweden), iBEAM®evo Couchtop EP, P10105-148, serial no. 02 1506 (Ac1) and 02 2982 (Ac4). The vertical reference was created by a 200 g plumb bob hanging in a wire (a fishing line) with the diameter Ø0.35 mm attached via a magnet to a crane bar of steel situated in the ceiling of the treatment room. A glass filled with washing-up liquid to prevent oscillations of the plumb bob was placed on the floor. The gantry arm of the accelerator was turned away from 0° to give room for the wire. Also, the gantry angle was adjusted if necessary to allow a full vertical travel of the treatment table in each setup. In Figure 1 the setup of the wire relative to the treatment table is shown. The effect caused by the patient was simulated by applying an external force to the tabletop in terms of weights to 0, 40 and 80 kg.
Schematic diagram showing the treatment table and the reference system defined by the wire. The plumb bob is seen immersed into the liquid in the glass. The tabletop is shown at isocentre height z = 0.0 cm approximately 125 cm above floor level. The longitudinal position of the tabletop was 30.0 cm. The wire was positioned within a few millimetres from the table rotational axis. The distance between the wire and the superior end of the tabletop was 7 cm. A force F was applied 38 cm from superior end of the tabletop. The figure is based on Figure 14 at doi: 10.1088/0031-9155/55/24/014. Reproduction was permitted by IOP Publishing Ltd.

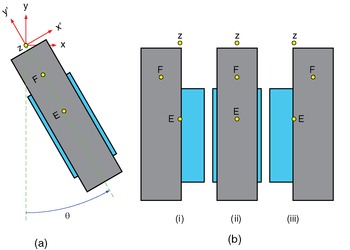
A fixed room (x, y, z) and a rotated table (x′, y′, z′) coordinate system are introduced in agreement with IEC 612172. The table coordinate system is rotated by the turntable angle θ relative to the room system. The origin of both systems is located on the table rotational axis at the isocentre height z = 0.0 cm. The definition of the two coordinate systems and turntable angle is shown in Figure 2(a). The table height z was varied over the full travel of 110 cm. At turntable θ = 0°, the vertical travel of the table was investigated at the lateral positions −25.0, 0.0 and 25.0 cm. The definition of the lateral positions of the tabletop is displayed in Figure 2(b). Also, the vertical travel was examined at turntable θ = −90° and 90° with the lateral position at 0.0 cm.
Lifting mechanism (light-blue) and tabletop (gray) seen from above. The iso-rotation arm is not displayed. The quantity E denotes the eccentric rotational axis. The force F was acting in the longitudinal and vertical symmetry plane of the tabletop. The distance between the z- and E-axes is 100 cm. (a) The definition of the coordinate systems (x, y, z), (x′, y′, z′) and the turntable angle θ appear from the figure. The y-axis is towards the gantry. The tabletop is shown at the lateral position 0.0 cm. (b) Three different lateral positions of the tabletop are shown: (i) –25.0 cm, (ii) 0.0 cm and (iii) 25.0 cm.

A reference point was chosen nearby the wire on the superior end of the tabletop at the position  relative to the table system with
 cm,
 cm < 0.0 cm and
 cm. The position of the reference point at any height is denoted r′ = (x′, y′, z′). Hence, the vertical travel of the table is defined as the relative change given as Δr′ = r′ − r′R. Furthermore, the rotation of the reference point around the z-axis as function of the table height z is assumed to be negligible. Thus, the movements of the reference point would be the same as if the reference point virtually was positioned on the wire at
 cm.
A USB-microscope was used previously in experimental studies of treatment tables.Reference Riis and Zimmermann3,Reference Riis, Zimmermann and Riis4 This work was based on the same microscope and the same method of image analyses as described in previous studies. The measuring system included a vertical wire positioned at the rotational axis (z) of the table and a USB-microscope attached to the tabletop. An image of the wire at large field of viewReference Riis, Zimmermann and Riis4 was acquired at different table configurations. In order to achieve Δx′ and Δy′ data, two orthogonal positions of the USB-microscope were used: (1) image plane parallel to the (x′, z′)-plane and (2) image plane parallel to the (y′, z′)-plane. The acquired images were calibrated and position data of the tabletop were extracted. The self-consistent calibration correction methodReference Riis, Zimmermann and Riis4 was applied in the calibration process of the images.
THEORY
Rotational symmetry of the mechanical structure is assumed. The lateral position of the tabletop is 0.0 cm. Thus, the alignment of the iso-rotation base frame can be made to fulfil the properties

and

However, (1) and (2) are inadequate to ensure a vertical travel. From an ideal point of view, the vertical travel should obey
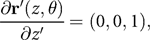
for all θ and z. This requirement given in (3) cannot be fulfilled due to deviations from a linear travel and hysteresis effects. A linear approximation of the vertical travel of the table around the reference height z = z R is our suggestion to an alignment criterion of the table. This criterion is formulated in (3) by replacing z with z R.
Let the position Δr′ = (Δx′, Δy′, Δz′) turn into  after adjustment of the iso-rotation base frame with the angles
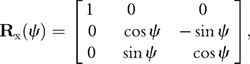
 and Φ representing rotation around the x- and y-axes, respectively. The adjustment is described by three rotations in terms of three matrices. These are given by
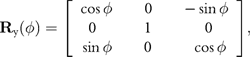
and
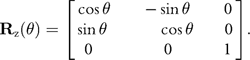
The relation between Δr′ and Δ is given by

Assuming ψ and Φ are small angles, sin ψ ≅ ψ, sin Φ ≅ Φ, cos ψ ≅ 1 and cos Φ ≅ 1, then (7) reduces to

where δr′ = (ΦΔz′, ψΔz′, 0). The angles that the iso-rotation base frame has to be adjusted to achieve alignment at the turntable angle θ is calculated from the projection on the x′- and y′-axis of the partial derivative with respect to z′ of Rz(θ) · Δr′. The result is given by

and

where the values of and depend on the turntable angle θ. By using (9)–(10), the corrections necessary to be done in order to fulfil the symmetry conditions (1) and (2) at the two θ angles −90° and 90° are calculated. The corrections are found as the mean values of and at the two θ angles to give

and

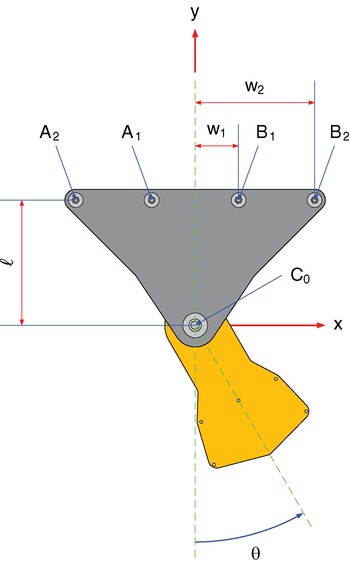
In (11) and (12), it was assumed that the partial derivatives are small, i.e., tan x ≅ x. For an optimal aligned treatment table, one will find using (11) and (12) that ψopt = 0° and Φopt = 0°. The alignment criteria stated in (11) and (12) deviates from the one given in the Elekta Precise Table Installation Manual. According to the manual, the iso-rotation arm is levelled using a spirit level along x′- and y′-axes at the turntable angles θ = −45° and 45°. Then the base frame is attached to the foundation, after which the lifting mechanism is mounted on the iso-rotation base frame, see Figure 3. The two methods are equivalent if a symmetry around θ = 0° in the elastic properties of the attachment of the iso-rotation base frame to the foundation and the foundation itself is present.
Iso-rotation base frame seen from above. The gray part (base frame) is fixed to the foundation with double M20 nuts at each four positions denoted A 2, A 1, B 1 and B 2. Levelling of the unit is performed by adjusting the nuts. According to the Elekta Precise Table Installation Manual, the A 2 and B 2 nuts are tighten to 160 Nm while A 1 and B 1 are tighten to 10 Nm. The edge C 0 is standing on the bottom of the pit. The orange part is called the iso-rotation arm. This part is also shown in Figure 1. The rotation of the arm is limited to θ = [−100°; 100°]. The lengths are w 1 ≅ 200 mm, w 2 ≅ 550 mm and ℓ ≅ 578 mm.

The rotation angles ΩA and ΩB of the nuts at the positions A 2, A 1, B 1 and B 2 to adjust the iso-rotation base frame are given by

where + and – refer to A and B side, respectively, s = 2.5 mm/360° is the thread pitch of the M20 nuts, the values of w 1, w 2 and ℓ are given in the figure caption of Figure 3. If the values of ψ and found using (9) and (10) are inserted in (13) perfect alignment is achieved at one particularly turntable angle θ. By applying (11) and (12) instead results in a compromised alignment.
RESULTS AND DISCUSSION
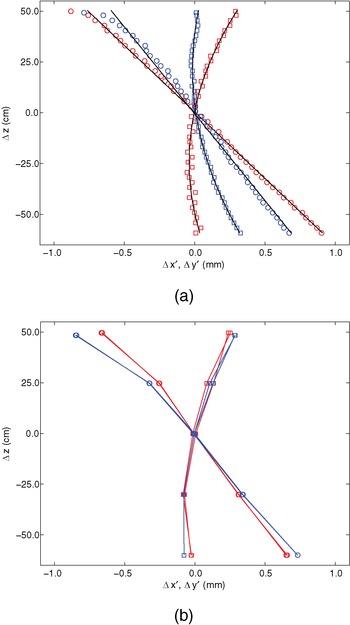
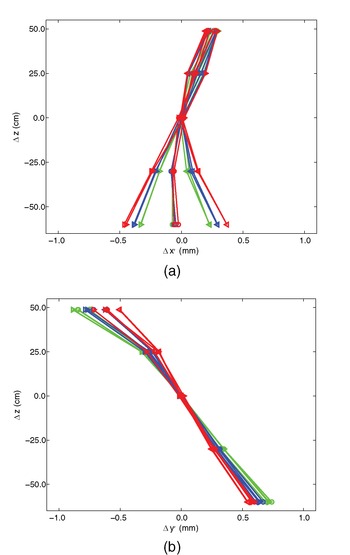
Table data for turntable angle θ = 0° with no external load applied are shown in Figure 4(a). The data were measured for both tables on 14 February, 2011. The position was measured over the full vertical travel of the table in small steps of 2.5 cm in downward direction starting at maximum height 49.5 cm (Ac1) and 48.8 cm (Ac4) down to −60.0 cm. Both tables seem to perform equally. The main difference originates in the alignment of the iso-rotation base frame. The Δx′ data have a characteristic bending while the Δy′ data are linear apart from the table height z in the region around 47.5 cm to maximum height.
Measured data of the tabletop movements relative to the wire at different table heights Δz. The turntable angle was held at θ = 0° and no external loads were applied. The red and blue curves denote Ac1 and Ac4 data, respectively. The markers  and
 denote Δx′ and Δy′ values, respectively. (a) The data represent upward tabletop movements only. The black curves are polynomial fit of first and second degree. All displayed data were measured on 14 February, 2011. (b) Data for both upwards and downwards movements of the tabletop are shown. The displayed data were measured on 7 October, 2008 (Ac1) and 2 July, 2008 (Ac4).

The data shown in Figures 4(b) and 6(a) were measured on 7 October, 2008 (Ac1) and 2 July, 2008 (Ac4). In these measurements, the tabletop was moved both upward and downward. Straight lines connect the data points in each series of measurements, Figures 4(a) and 6(b). The table heights were varied in large steps as z = (−60.0, −30.0, 0.0, 25.0, z max) cm with z max found to be 50.0 cm (Ac1) and 48.8 cm (Ac4). A comparison of the data shown in Figure 4 concludes that Δx′ data of Ac1 are unchanged. Other data are slightly different. According to our files, the iso-rotation base frame had been adjusted on Ac4 in September 2010. The adjustment was carried out by using the cross wire generated by the light field of the accelerator as reference. No adjustments of the iso-rotation base frame of Ac1 have been performed. We believe that the difference in the Δy′ data of Ac1 is due to a drift in the attachment of the four bolts to the foundation. This effect is mainly caused by the net weight of the table unit (832.5 kg) attached to the iso-rotation arm. In conclusion, the shape of the curves was stable over almost a period of three years.
In Figure 5(a) the Δx′ values are displayed for different values of the lateral tabletop position and load. The Δx′ data representing the lateral position 0.0 cm seem to be independent of the external load. The data measured at ±25.0 cm in the lateral position are symmetrical around the data found at the lateral position 0.0 cm. The shift in the shape of the Δx′ data is caused by a change in the weight distribution of the table. When a movement of the tabletop in the lateral direction is carried out, the weight of the longitudinal/lateral carriage assembly (≅200 kg) is moved accordingly. The displacement in the Δx′ data due to the weight of the carriage and the external applied load is in good agreement with the linear theory of elasticity.
Tabletop movements relative to the wire at different table heights Δz. The displayed data were measured on Ac4 on 2 July, 2008. Curves representing 0 kg (green), 40 kg (blue) and 80 kg (red) are shown at the lateral table positions −25.0 cm (  ), 0.0 cm (
 ), and 25.0 cm (
 ). (a) The x′-direction. (b) The y′-direction.

Measurements of Δy′ are shown in Figure 5(b). An external applied load courses a negative rotation around the x′-axis of the vertical travel of the table. The Δy′ data were expected to be equal at the lateral positions −25.0 cm and 25.0 cm. The asymmetric effect might be due to an asymmetric construction of the lifting mechanism.
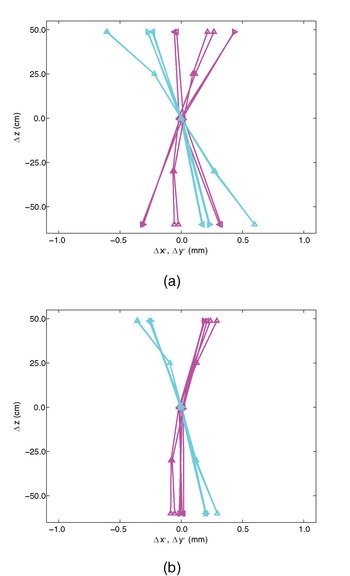
Measured data describing the vertical travel of the tabletop for turntable θ kept at −90°, 0° and 90° are shown in Figure 6(a). In Figure 6(b), the result after an optimal adjustment of the iso-rotation base frame is displayed. In the figure caption the correction values of ψopt and Φopt are given. The vertical travel data after the adjustment is calculated via (7) or (8). The adjustment of the nuts is calculated by using (13). After an optimised table alignment, the Δx′ and Δy′ data become equal at turntable angles −90°, 0° and 90° and (1) and (2) are obeyed. This feature was observed for both tables.
The data are displayed as Δx′ (magenta) and Δy′ (cyan) at turntable angles θ = −90° ( ), θ = 0° (  ) and θ = 90° ( ). The external load was 80 kg and the lateral position was 0.0 cm. For θ ≠ 0°, position data were measured at only three heights. (a) Tabletop movements measured at Ac4 on 2 July, 2008. (b) The results after optimisation of the data in Figure 6(a) by using ψopt=−0.029° and Φopt=0.003° in (7).

CONCLUSIONS
The mechanical structure inside the lifting mechanism is asymmetric around the y′-axis. The asymmetry includes the bars the mechanism is built of and a two-stage asymmetric spindle system moving the table up and down. The asymmetry causes a nonlinear vertical travel in lateral direction of the table. The effect is enhanced if the lateral position of the tabletop is moved towards the negative direction of the x′-axis. The variations of the position data for up and down movements are small and comparable with the uncertainty in the measurements. Therefore, a hysteresis effect of the tables was not detectable.
Generally, the vertical travel of the two treatment tables was found to have the same characteristics in the Δx′ and Δy′ data. We believe that the data presented here represent the general characteristic of the Elekta Precise Table. We found deviations less than 0.5 mm from a straight line in all our experiments. In conclusion, the lifting mechanism of the table performs well with the capability to fulfil the tolerance of 2 mm as stated in the AAPM TG–40 reportReference Kutcher, Coia, Gillin, Hanson, Leibel, Morton, Palta, Purdy, Reinstein, Svensson, Weller and Wingfield5.
By adjusting the iso-rotation base frame, a vertical travel with little inclination is achievable. The inclination adjustment of the Ac1 and Ac4 tables could be further improved by using shims between the table support system and the iso-rotation arm. This would compensate for rotation around the x′- and y′-axes. This method of compensation is time consuming and should only be carried out if there is a clear need from a clinical or technical point of view.
Often the quality assurance of the vertical travel of the treatment table is based on a visual and subjective method relative to light field projection of the cross wire of the accelerator on the tabletop. In this work, an objective method has been proposed to detect the vertical travel accuracy of the table. Also, the possibility and the limitations of improvements of the inclination have been discussed.