INTRODUCTION
China is the second largest maize producing country in the world after the United States (FAO 2010) and accounts for nearly 0·20 of the global population; therefore it is important to study how climate affects maize yields in China. However, few studies have examined the impact of climate factors on crop yields in China, partly because data are scarce, difficult to obtain and of varying quality. Nevertheless, as a basis for understanding current and future climate risks, it is important to increase knowledge about the relationship between existing weather records and crop yields.
Many studies have investigated climate effects on crop yields in various regions using different methods, including plant simulation models (Vučetić Reference Vučetić2011). Most statistical approaches, however, have employed simple correlations or estimated a relationship that is either linear or quadratic (Almaraz et al. Reference Almaraz, Mabood, Zhou, Gregorich and Smith2008; Chen et al. Reference Chen, Lei, Deng, Qian, Hoogmoed and Zhang2011). For example, Li et al. (Reference Li, Takahashi, Suzuki and Kaiser2011) regressed maize yields on climate variables distinguished by whether they affected the planting or growing periods, using both linear and quadratic forms of these variables. Another relevant study by Chen et al. (Reference Chen, Lei, Deng, Qian, Hoogmoed and Zhang2011) examined the impact of weather on maize yields in three provinces (Heilongjiang, Jilin and Liaoning) located along the northeast coast of China; they found that the minimum temperature deviations for May and September had a strong positive effect on maize yield, where yield in a given year was also measured as differences from average yield over the 44 years from 1965 to 2008 for which data were available. Separate regressions were estimated for each province, and for the three provinces combined, with intercept terms included only in regressions for Heilongjiang and Liaoning provinces and not for Jilin province or the aggregated regression. Not unexpectedly, temperatures in May had a stronger impact on yield than temperatures in September.
Chen et al. (Reference Chen, Lei, Deng, Qian, Hoogmoed and Zhang2011) sought only to find the climate factors correlated with maize yields and did not attempt to provide agronomic insights into their results. Maize is planted in early May and a high minimum May temperature is desirable in the study region used by Chen et al. (Reference Chen, Lei, Deng, Qian, Hoogmoed and Zhang2011); moisture is not a limiting factor in May and temperatures are not high enough to adversely impact early growth. Maize is harvested during September (with dates varying according to latitude); since high minimum temperatures are indicative of frost-free days, higher minima contribute to higher quality harvests and yields.
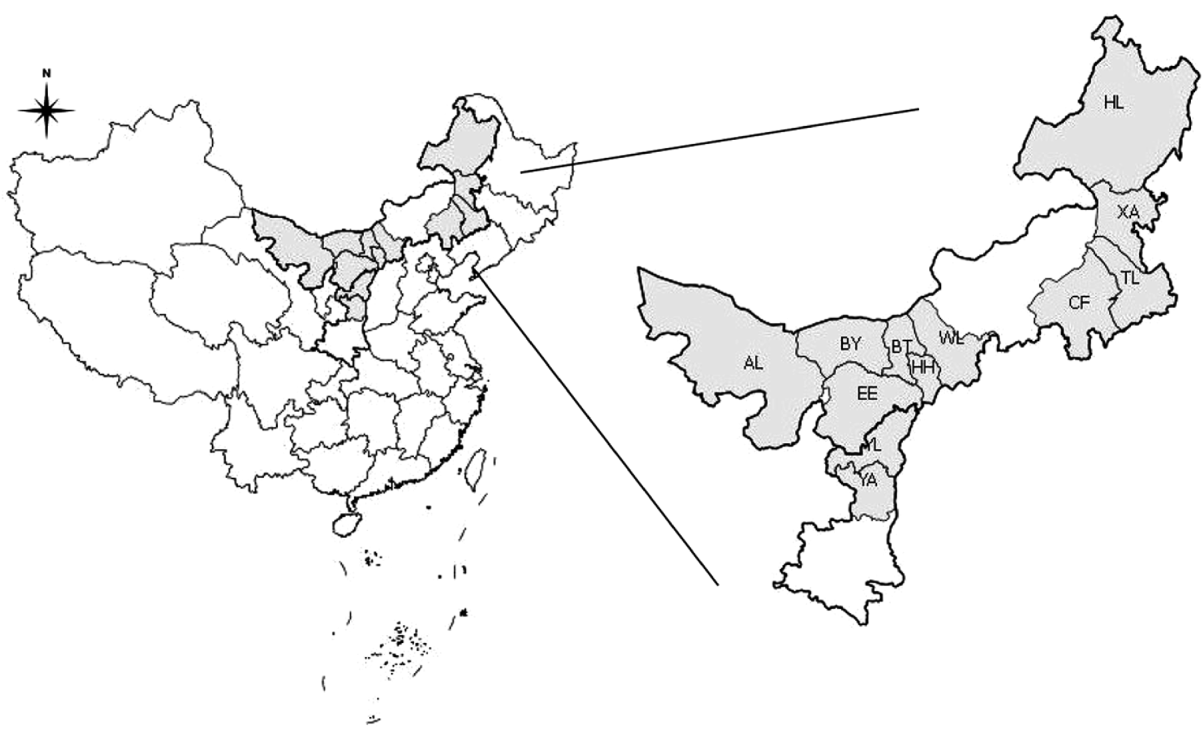
In the present paper, the work of Chen et al. (Reference Chen, Lei, Deng, Qian, Hoogmoed and Zhang2011) is extended in several directions. First, the focus is on a partially adjacent region to the west, the provinces of Inner Mongolia and Shaanxi, which are part of the main maize growing regions of China (Fig. 1). These provinces, respectively, accounted for 0·083 and 0·030 of China's total maize production in 2010 (National Bureau of Statistics of China 2011). Thus, they provide some indication regarding the impact that climate factors might have on the availability of maize in China under projected climate change. Second, district-level data for the two provinces were employed (10 districts in Inner Mongolia and two districts in Shaanxi). Since data in the present research are disaggregated to a greater extent than those used by Chen et al. (Reference Chen, Lei, Deng, Qian, Hoogmoed and Zhang2011), only district-level data for the period 1989–99 (11 years) for Inner Mongolia and 1989–2001 (13 years) for Shaanxi could be employed. However, since disaggregated weather data and panel regression were used, regression models in the present paper have 136 observations compared with only 44 observations used by Chen et al. (Reference Chen, Lei, Deng, Qian, Hoogmoed and Zhang2011).
Study area showing 12 districts in two provinces (Source: Data Sharing Infrastructure of Earth System Science from 1977–96). YL: Yulin; YA: Yanan; HL: Hulunbeier; XA: Xinganmeng; TL: Tongliao; CF: Chifeng; WL: Wulanchabu; HH: Huhehaote; BT: Baotou; EE: Eerduosi; BY: Bayannaoer; AL: Alashanmeg.

Third, the data used in the present paper only cover the period following the agricultural reforms that were completed by 1983 (Lin Reference Lin1988, Reference Lin1992) and more broad-based economic reforms in place by 1989 (Huang et al. Reference Huang, Rozelle, Martin, Liu, Anderson and Martin2009). Another structural change occurred around 2001–02 when China joined the World Trade Organization (WTO). Chen et al. (Reference Chen, Lei, Deng, Qian, Hoogmoed and Zhang2011) covered a period that spanned years on both sides of these important events, but failed to test for potential structural breaks in yields. That is, given the potential impact of socio-economic factors on crop yields, this should perhaps have been taken into account. This problem is avoided in the present paper because the data do not span the events in question.
Finally, there is no reason to think that crop yields are a linear or quadratic function of climate variables. Rather, the relationship is more complicated. For example, Schlenker & Roberts (Reference Schlenker and Roberts2006) specified a highly nonlinear relationship between temperature and yields, employing daily temperature information (Schlenker & Roberts Reference Schlenker and Roberts2006, Reference Schlenker and Roberts2008). In the current paper, therefore, a nonlinear flexible functional form is used rather than the linear one employed by Chen et al. (Reference Chen, Lei, Deng, Qian, Hoogmoed and Zhang2011). Instead of relying on daily maximum and minimum temperatures, however, growing degree days derived from daily temperature information are employed – the number of observations available on yield in the present study is simply too few to permit the use of non-aggregated daily temperature data. These aspects are discussed further below.
MATERIALS AND METHODS
Methods
The research was conducted at the Department of Economics, University of Victoria, Canada. Schlenker & Roberts (Reference Schlenker and Roberts2006, Reference Schlenker and Roberts2008) made the case that crop yields depend on climate factors in a nonlinear fashion and that crop growth depends on cumulative heat throughout the growing season. That is, if soil moisture availability is generally not a constraint during the growing season, then crop growth is not specifically dependent on one or several periods of warm weather but, rather, a function of the total sum of warm days during the growing season. In the present study, tests on the parameters of the interaction between precipitation and temperature turned out to be statistically insignificant. However, extreme temperatures above 36 °C, for instance, may have an adverse impact on crop yield (Dupuis & Dumas Reference Dupuis and Dumas1990), as might lack of soil moisture during the growing season. In the present study, hot days (with maximum temperatures above 36 °C) accounted for <0·03 of all days in the dataset and >0·80 of these occurred in one district. Further, although we would expect the associated district dummy variable to account for hot days, it was found that the ‘number of hot days’ variable was statistically insignificant in any variant of the regression model.
Schlenker & Roberts (Reference Schlenker and Roberts2006, Reference Schlenker and Roberts2008) began by postulating that plant growth is cumulative over time and that yield is directly dependent on plant growth. Let T represent temperature and y jt represent the log of plant growth in region j in year t. Then, assuming yield growth is given by g(T), the natural logarithm of crop yield is determined by the following relationship:
 $$y_{\,j,t} = \int_{\underline{T}} ^{\bar T} {g(T)\Phi _{\,j,t} (T){\rm d}T + \sum _i \alpha _i z_{i,j,t} + \theta _j D_j + {\rm} \varepsilon _{\,j,t}} $$
where  $\bar T$ and T refer to the upper and lower bounds that observed temperatures can take; Φ j,t(T) is the cumulative distribution function of temperatures (heat) over the growing season in region j during year t; z i,j,t are i other factors (precipitation, technology, fertilizers, etc.) that affect crop growth in region j during time t; α i and θ j are parameters to be estimated; D j are time-invariant region-fixed effects; and ε j,t∼N(0, σ j,t) are identical independently distributed error terms.
The issue of concern relates to the growth function. Schlenker & Roberts (Reference Schlenker and Roberts2006) employed a flexible mth-order Chebychev polynomial evaluated at the m midpoints of the intervals between  $\overline T$ and T. Unfortunately, while Schlenker & Roberts (Reference Schlenker and Roberts2006) had 87 619 observations on maize yields for the period from 1950 to 2004, data used in the present research were severely limited as discussed below. Therefore, an alternative flexible functional form is employed. When observations are limiting, Schlenker & Roberts (Reference Schlenker and Roberts2006) recommended that, at the very least, growing degree days during the growing season and the square of growing degree days be used as explanatory variables in the regression model instead of temperatures per se (Schlenker & Roberts Reference Schlenker and Roberts2006). The quadratic function can capture at least one nonlinear aspect, although they found many more nonlinearities using midpoints of intervals or dummy variables representing number of days that temperatures fall within certain bounds during a growing season. As noted, they were afforded this luxury by their large data sets.
Temperature is the primary variable of interest, similar to what was assumed and confirmed by Schlenker & Roberts (Reference Schlenker and Roberts2006, Reference Schlenker and Roberts2008), although precipitation may be important at certain times of the year. For example, too much rainfall in September may delay harvests, reduce grain quality, or even reduce overall yield. Likewise, if fields are too wet in the autumn, harvesting may be delayed and yields may actually decline due to decay; or if fields are too wet in spring the delay in planting leads to reduced exposure to heat, or exposure to heat at the wrong time in the growing cycle, and thereby lower yields according to Eqn (1). In contrast to Schlenker & Roberts (Reference Schlenker and Roberts2006, Reference Schlenker and Roberts2008), precipitation effects for each month, rather than the growing season as a whole, were considered in the present research, and quadratic effects of monthly precipitation were also considered since it was not obvious that the effect of precipitation on crop yield was linear.
Growing degree days (denoted by G) were employed in the present research and, because the mth-order Chebychev polynomial of Schlenker & Roberts (Reference Schlenker and Roberts2006, Reference Schlenker and Roberts2008) was not used to represent the effect of heat on crop yields, the method of fractional polynomials (Royston & Altman Reference Royston and Altman1994) was adopted to model the nonlinear relation between crop yield and G. The use of G and G 2 as explanatory variables is thus considered a special case of the more general mth-order fractional polynomial regression.
Royston & Altman (Reference Royston and Altman1994) began by defining a fractional polynomial of degree m written as
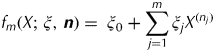 $$f_m (X;\,\xi, \,{\bi n}) = \; \xi _0 + \mathop \sum \limits_{\,j = 1}^m \xi _j X^{(n_j )} $$
where the parentheses on the power term on X signify the following transformation:
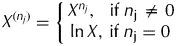 $$X^{(n_j )} = \left\{ {\matrix{ {X^{n_j} {\rm,}\hfil \tab\hskip4pt {\rm \; if\;} n_{\rm j} \ne 0} \hfil \cr {\ln X,\hfil \tab {\rm if\;} n_{\rm j} = 0} \hfil \cr}} \right.$$
For m=2 and n={n 1, n 1}, Eqn (2) can be written as
 $$F_{\rm 2} (X;\xi, \,{\bi n}) = \xi _0 + (\xi _{\rm 1} + \xi _{\rm 2} )\,X^{(n 1)} $$
which is nothing more than a fractional polynomial of degree 1.
Rewrite Eqn (4) as
 $$f_{\rm 2} (X;\,\xi, \,{\bi n}) = \xi _0 + \xi _{\rm 1} X^{(n 1)} + \xi _{\rm 2} X^{(n 1)} X^{(n{\rm 2})-(n{\rm 1})} -\xi _{\rm 2} X^{(n 1)} + \xi _{\rm 2} X^{(n 1)} $$
Rearranging gives
 $$\eqalign{f_2 (X;\xi, {\bi n}) =\tab \xi _0 + \xi _1 X^{(n1)} + \xi _2 X^{(n1)} (X^{(n2) - (n1)} - 1)\cr\tab + \xi _2 X^{(n1)} $$
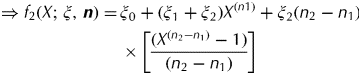 $$\eqalign{ \Rightarrow f_2 (X;\,\xi, \,{\bi n}) = \tab \xi _0 + (\xi _1 + \xi _2 )X^{(n1)} + \xi _2 (n_2 -n_1 )X^{(n 1)} \hskip-42pt\cr \tab \times\left[ {\displaystyle{{(X^{(n_2 - n_1 )} - 1)} \over {(n_2 - n_1 )}}} \right]} $$
As n 2→n 1, the last term in parentheses in Eqn (7) becomes lnX. Then, upon rearranging:
 $$\scale98%\eqalign{f_{\rm 2} (X;\,\xi, \,{\bi n}) = \xi _0 + (\xi _{\rm 1} + \xi _{\rm 2} )\,X^{(n 1)} + \xi _{\rm 2} (n_{\rm 2} -n_{\rm 1} )\,X^{(n 1)} {\rm ln}X$$
Letting ζ 0=ξ0, ζ 1=ξ 1+ξ2 and ζ 2=ξ2(n 2−n 1), Eqn (8) can be written as
 $$f_{\rm 2} (X;\,\xi, \,{\bi n}) = \zeta _0 + \zeta _{\rm 1} X^{(n 1)} + \zeta _{\rm 2} \,X^{(n 1)} {\rm ln}X$$
This can then be generalized in the same way to m>2 (Royston & Altman Reference Royston and Altman1994):
 $$f_m (X;\,\xi, \,{\bi n}) = \zeta _0 + \zeta _1 X^{(n{1})} + \mathop \sum \limits_{\,j = 2}^m \zeta _j X^{(n_1 )} {\ln}\,X^{\,j - 1} {\rm \;} $$
Notice that, much like a Taylor series expansion occurs about a particular point, the flexible functional form Eqn (10) is obtained by expanding around the power n 1. This is clear from the way that Eqn (9) is derived. Therefore, the fractional polynomial function is generalized further:
 $$\eqalign{f_m (X;\,\xi, \,{\bi n}_k ) = \zeta _0 + \mathop \sum \limits_{k = 1}^K \left[ {\zeta _{1,k} X^{(n_k )} + \mathop \sum \limits_{\,j = 2}^m \zeta _{\,j,k} X^{(n_k )} \ln X^{\,j - 1}} \right]{\rm \;} $$
where the number of potential powers equals K. Essentially there are an infinite number of functions that can be considered, but, in practice, the powers are limited to n k values that are integers between −2 and +3, with ±0·5 (1/√X and  $\sqrt X $) included, although higher powers are not ruled out.
The notation and method are illustrated for identifying a regression model with several examples. Consider the fractional polynomial for variable X and let K denote powers of X and m the maximum number of terms of a particular power of X; in these examples, an intercept term and terms involving other variables are excluded (although treated as a single variable in the text, explanatory variable X could just as well be considered a vector of variables). For example, if K=3 and m=3, there would be three powers of X with one power having three terms, although there might be other powers of X whose terms do not exceed m. Consider {X, (−0·5, 0, 1, 1, 1)}. This leads to the following regression equation:
 $$f_3 (X;\,\xi, \,{\bi n}_{\rm 3} ) = \zeta _0 + \zeta _1 \displaystyle{1 \over {\sqrt X}} + \zeta _2 \,{\rm ln}\,X + \zeta _3 X + \zeta _4 X\,{\rm ln}\,X + \zeta _5 X\,{\rm ln}\,X^2 $$
Likewise, {X, (0, 0, 1, 1, 1, 2, 3)} leads to
 $$\eqalign{F_{\rm 3} (X;\,\xi, \,{\bi n}_4 ) = & \zeta _0 + \zeta _{\rm 1} \,{\rm ln}\,X + \zeta _{\rm 2} \,{\rm ln}\,X^2 + \zeta _{\rm 3} X + \zeta _{\rm 4} X\,{\rm ln}\,X \hskip-35pt\cr & + \zeta _{\rm 5} X\,{\rm ln}\,X^2 + \zeta _{\rm 6} X^2 + \zeta _{\rm 7} X^3} $$
One final note regards the definition of power zero, which is set equal to lnX as is clear from Eqns (12) and (13).
In the current application, the regression model is specified as
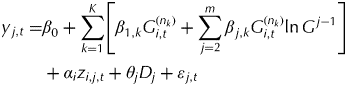 $$\eqalign{y_{\,j,t} = & \beta _0 + \mathop \sum \limits_{k = 1}^K \left[ {\beta _{1,k} G_{i,t}^{(n_k )} + \mathop \sum \limits_{\,j = 2}^m \beta _{\,j,k} G_{i,t}^{(n_k )} {\rm ln}\,G^{\,j - 1}} \right]\cr & + \alpha _i z_{i,j,t} + \theta _j D_j + \varepsilon _{\,j,t}} $$
where the dependent variables (y j,t), z i,j,t, αi, θj, εj,t and D j were defined in conjunction with Eqn (1), and, importantly, the second term in square brackets in Eqn (14) disappears if m=1. In Eqn (14), βs are parameters to be estimated and G i,t refers to total degree days in region i during growing season t. Further, only functional forms with powers n 8∈{−2, −1, −0·5, 0, 0·5, 1, 2, 3} were explored, although Schlenker & Roberts (Reference Schlenker and Roberts2006, Reference Schlenker and Roberts2008) used a sixth power in their function but did not employ fractions and natural logarithms. Higher polynomials and fractions could also be employed, but the powers in the present paper are limited to those indicated. Finally, technological change is represented by a time variable.
Data
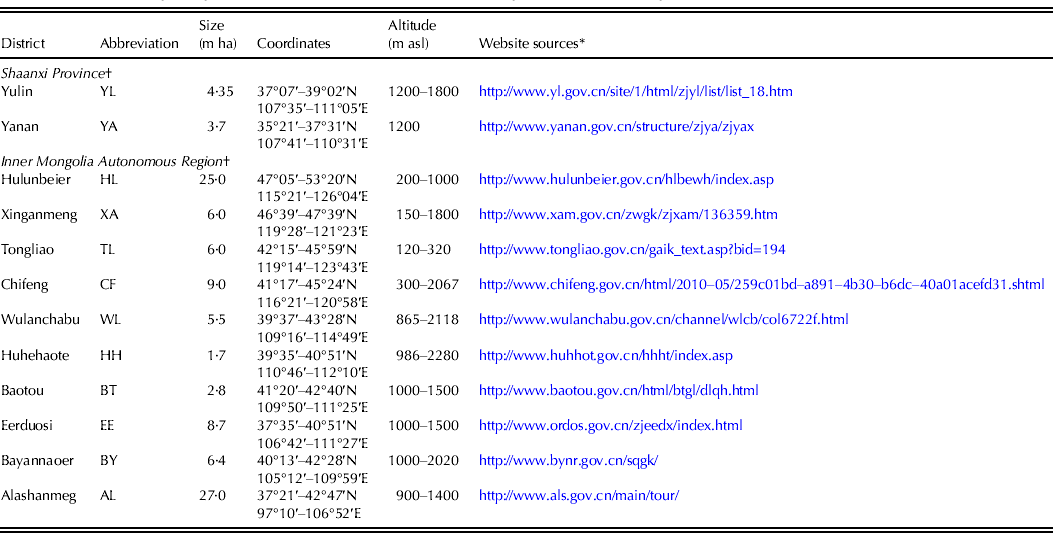
As already noted, the study area consists of 12 districts in two provinces in northwestern China (Fig. 1). The northernmost district (Yulin (YL)) in Shaanxi Province is adjacent to Inner Mongolia and constitutes 4·35 million ha (Government of Yulin 2012), while the one to the south (Yanan (YA)) is 3·7 million ha (Government of Yanan 2012); these are part of China's Loess Plateau. Inner Mongolia spans three distinct Chinese administrative units, i.e. Northeast China, North China and Northwest China. Inner Mongolia is the third largest province, with a land base of 118·3 million ha which accounts for 0·12 of China's total land area. Of this, 0·53 of the land is plateau, 0·21 is mountainous and 0·008 is covered by water (Government of Inner Mongolia 2010). Inner Mongolia consists of 12 districts, but because requisite data were missing, only 10 districts were considered in the analysis. District-level details are provided in Table 1. Maize yield data were collected from available annual year books for the Inner Mongolia Autonomous Region and for Shaanxi province; yield data were available for Inner Mongolia only for the period 1989–99 (Inner Mongolia Bureau of Statistics 1990–2000) and for Shaanxi for the period 1989–2001 (Shaanxi Bureau of Statistics 1990–2002). Weather data were from the Ecological Environment Database of the Loess Plateau. There were 50 weather stations in Inner Mongolia for which data were available, but only 38 had weather data for a period comparable with the period for which yield data were available. In addition, records from seven weather stations in northern Shaanxi were available from the database. The maize growing season in the study area is from late April or early May to September. Therefore, weather records from May to September were used.
Information regarding districts in Shaanxi Province and Inner Mongolia Autonomous Region
* Websites were all verified on 8 February 2013.
† Districts for Shaanxi are listed from North to South in Fig. 1, while those for Inner Mongolia are listed from East to West.
While yield data were available beyond 2001 for Shaanxi province, the same richness of weather station data for the period after 2001 was lacking; no maize yield data were available for Inner Mongolia after 1999. However, as noted earlier, data prior to 1989 or after 2001 might be affected by socio-economic factors that are not likely to be a significant explanatory factor in the period considered in the present paper.
For each district, the weather stations in the district were used to determine the temperature and precipitation associated with the crop yields. If there was no weather station in a given district, then the temperature and precipitation data for the nearest weather station to the central point (centroid) of the district was used as a proxy. If there was only one weather station in the district, the data from that station were used. Finally, if there were two or more weather stations in a district, weighted averages of the precipitation and temperature data were calculated for the centroid of the district.
To make the required calculations, a Geographic Information System (GIS) model was built using the Quantum GIS (QGIS) tool. After plotting district centroids, the distances between centroids and weather stations were measured using the GIS tool, and then the inverse of these distances were used to calculate weighted coefficients for weather readings. The following formula was used:
 $$T_j = \mathop \sum \limits_{k = 1}^{n_j} [T_{k,j} + 0 {\cdot} 006({\rm e}_{k,j} - {\rm e}_j )]\left[ {{\textstyle{{(1/d_{k,j} )} \over {\sum\nolimits_{k = 1}^{n_j} {(1/d_{k,j} )}}}}} \right]$$
where T j is the region j centroid temperature, T k,j is the temperature reading and e k,j is the elevation at weather station k in district j; there are n j weather stations in region j; e j is the mean elevation at the centroid of district j, which is used to eliminate elevation differences among stations in the district; 0·006 (measured in °C) corrects for elevation; and d k,j is the distance between the centroid in district j and weather station k, with
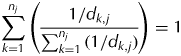 $$\sum\limits_{k = 1}^{n_j} {\left( {\displaystyle{{1/d_{k,j}} \over {\sum\nolimits_{k = 1}^{n_j} {(1/d_{k,j} )}}}} \right)} = 1$
In China, cumulative temperatures in excess of 10 °C are usually used to measure heat conditions for crop growth (Bai et al. Reference Bai, Li, Bai, Zhang and Xie2011). The same temperature is also used in the UK as the basis for calculating growing degree days (Bunting Reference Bunting1979). In the present study, therefore, daily growing degree days were calculated as
 $$G_{d,j,t} (T_{d,j,t} ) = \left\{ {\matrix{ {T_{d,j,t} - 10,} \hfill & {\; {\rm if}\; T_{d,j,t} \gt 10\; {^{^\circ}} {\rm C} \hfill }\cr {0,} \hfill &\!\! {{\rm if}\; T_{d,j,t} \le 10\; {^{^\circ}} {\rm C}\hfill} \cr} \matrix{ \; \cr \; \cr}} \right.$$
and total seasonal growing degree days as
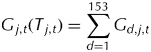 $$G_{\,j,t} (T_{\,j,t} ) = \mathop \sum \limits_{d = 1}^{153} G_{d,j,t} $$
In the preceding equations, G d,j,t(T d,j,t) refers to the number of growing degree days on day d in region j in year t, as a function of the average temperature on day d in region j (T d,j,t); and G j,t(T j,t) is total growing degree days in region j during the growing season of 153 days (May through September) in year t.
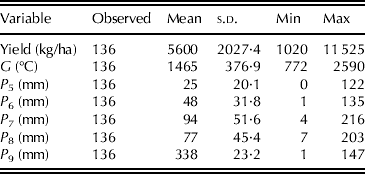
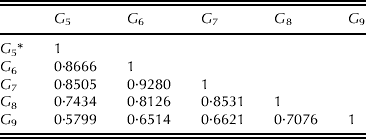
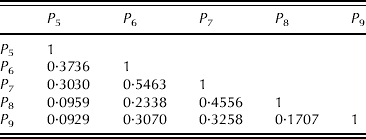
Evidence suggests that when pollinated spikelets are exposed to temperatures above 36 °C, maize yields may be negatively impacted (Dupuis & Dumas Reference Dupuis and Dumas1990). In the current study, average temperatures were used. These rarely exceeded 32 °C, although this did not preclude some periods of maximum temperatures exceeding 36 °C. From a statistical standpoint, therefore, the possibility that temperatures might be too high is assumed to be captured by the district dummy variables (as discussed earlier). For the response variables, the distribution of unadjusted yields was found to be closer to a normal distribution than either the distributions of the logarithm of yields or the square root of yields. Summary statistics for the variables used in the model are provided in Table 2. Correlations among monthly growing degree days were strong, as shown in Table 3; thus, to avoid multicollinearity problems, growing degree days accumulated over the entire growing season were employed in the regressions rather than separate monthly values. This was not the case for precipitation (Table 4), so monthly precipitation values were employed.
Summary statistics for variables*
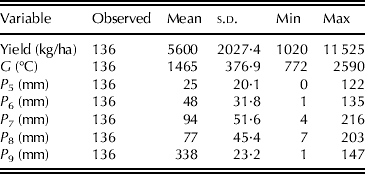
* G: growing degree days; P: precipitation, with subscripts indicating the month (e.g. 5=May).
Correlations of monthly growing degree days (G)
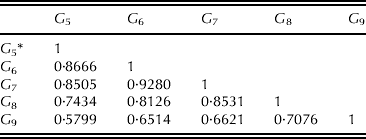
* Subscripts refer to the month (e.g. 5=May).
Correlations of monthly precipitation (P)*
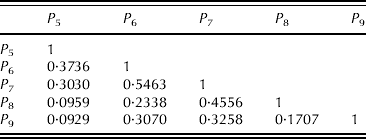
* Subscripts denote the month in the growing season (e.g. 5=May).
RESULTS
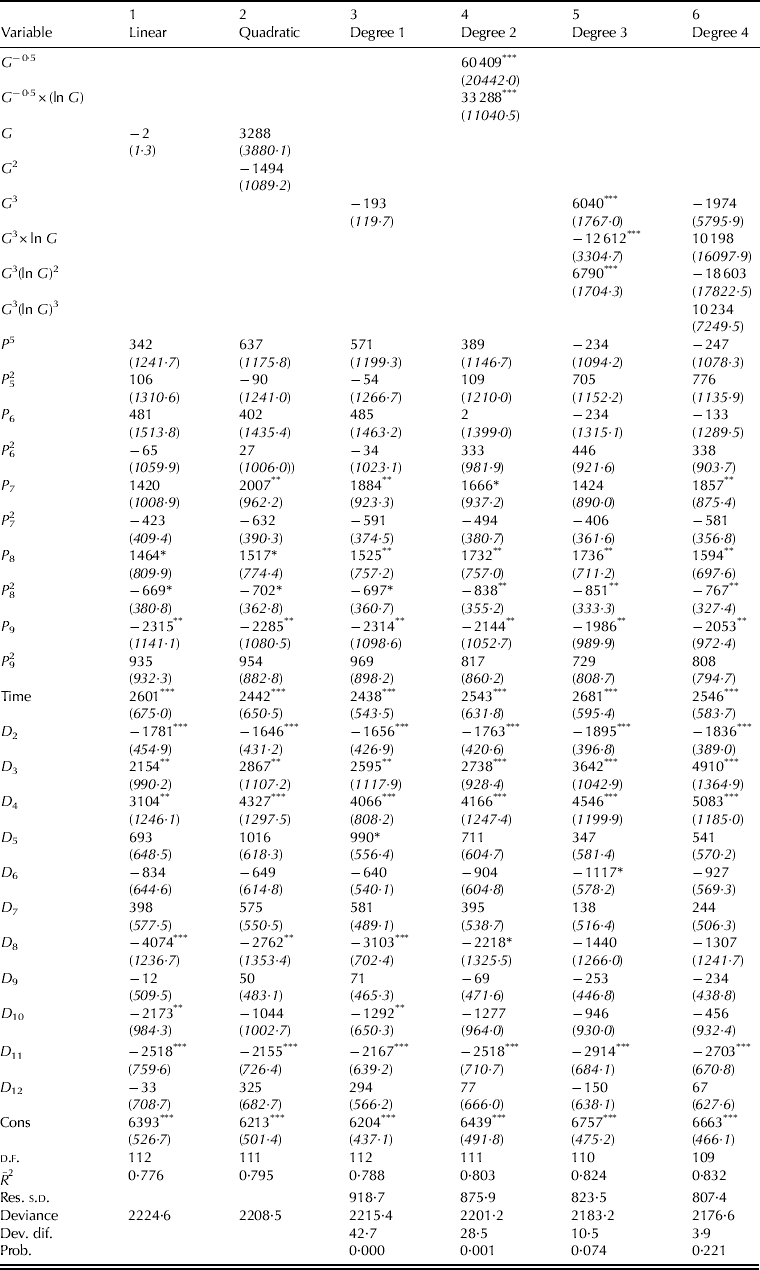
Estimation results are provided for the linear, quadratic and the four higher order terms for seasonal growing degree days (G); these are represented by Eqns (1)–(6), respectively (Table 5). In each of the models, dummy variables were used to capture district fixed effects. With some exceptions, unexplained differences among districts were found to be important in explaining differences in maize yields across the study region.
Fractional polynomial regression in different degrees†
* P<0·1, **P<0·05, ***P<0·01.
† G: growing degree days; P: precipitation, with subscripts indicating the month (e.g. 5=May). D: district dummy variable, with subscripts indicating each of the 11 districts out of 12. Time is the variable representing technological change. G, P and time are standardized in the regressions. Coefficients and standard errors (in parentheses) are listed for each variable.
For Eqns (1), (2) and (3) (models with linear, quadratic and degree−1 terms of G), the estimated parameters were not statistically significant. As the degree on the growing degree days variable increased from 1 to 4 for Eqns (3)–(6), the model fit improved as indicated by  $\bar R^2 $, while the level of statistical significance of the deviance difference statistic equalled 0·01 for Eqn (3) and 0·01 and 0·10 for Eqns (4) and (5), respectively; however, for Eqn (3), the estimated parameters on G were not statistically significant. For Eqn (6), the deviance difference was not statistically significant, which indicated that the functional form led to an ‘over fitting’ of the model; this was also indicated by the lack of statistical significance on any of the estimated parameters on G.
Based on deviance differences that are statistically significant at P⩽0·1, the best models are, therefore, Eqns (4) and (5). These explain 80·3 and 82·3% of the variation in maize yields, respectively. A modification to the Akaike information criterion (AIC), namely, the quasi-likelihood independence model criterion (QIC), was used to test the goodness-of-fit of the generalized estimation equations represented by the two models (Pan Reference Pan2001). The QIC criterion corresponding to Eqn (5) is smaller than that of Eqn (4), so that, from a statistical standpoint, the functional form of Eqn (5) provides the best fit of the data.
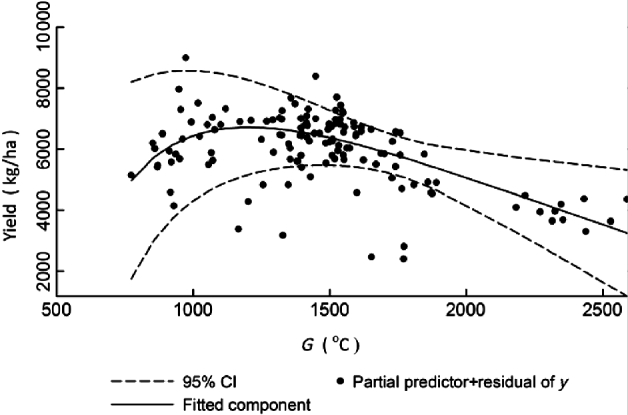
For Eqn (4), fractional polynomial terms for growing degree days consisted of combinations of  $1/\sqrt G $ and
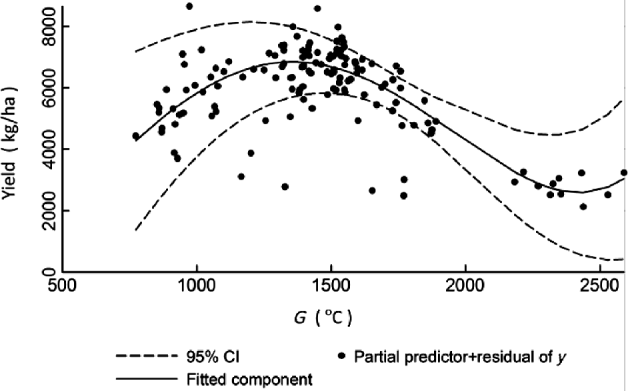
 $\left( {{\textstyle{1 \over {\sqrt G}}} \times {\rm ln}\,G} \right)$, with the relationship shown in Fig. 2. For Eqn (5), fractional polynomial terms of growing degree days consisted of G 3, G 3×ln G, and G 3×(ln G)2, with this estimated function plotted in Fig. 3. As indicated in the figure, growing degree days were found to be an essential determinant of maize yield, but other factors not captured in the figure also came into play, and too much heat caused yields to decline, all other things being equal.
Fractional polynomial of G, of degree 2 with powers (−0·5, −0·5).
Fractional polynomial of G, of degree 3 with powers (3, 3, 3).
In Eqns (4) and (5), higher levels of precipitation in July (Eqn 4) and August (Eqns 4 and 5) have a positive effect on maize yields, but too much precipitation in any given month would reduce yields as indicated by the negative coefficient on the rainfall squared term (although it is insignificant for July precipitation). Precipitation in September negatively affects crop yields, probably because this is the harvest period; additional rainfall is no longer needed for crop growth and, indeed, rainfall could disrupt harvesting operations causing some crop loss or cause maize yields to decline as precipitation might damage the crop. As expected, the time variable has a strong positive impact on maize yields. This indicates that farmers were adopting new technologies, whether these were improved varieties of maize, more fertilizer, better or newer equipment, or some other improvement.
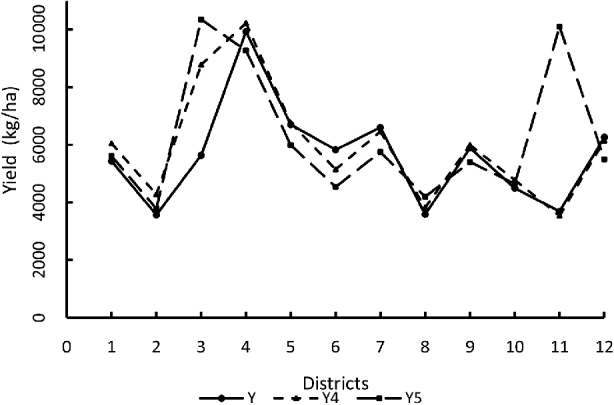
As a final check on the model, the estimated parameters for Eqns (4) and (5) were employed in a Monte Carlo simulation (with sampling from distributions about the estimated parameters using the estimated standard errors as well as the overall standard error of the estimated model) to determine average maize yield for each of the 12 districts. These are provided in Fig. 4. In the figure, estimated yields (Y 4) derived from Eqn (4) are close to actual yields (Y), with the exception of district 3, and estimated yields (Y 5) from Eqn (5) are close to actuarial yields (Y), except for districts 3 and 11. Overall, in contrast to the QIC criterion, Eqn (4) appears to better predict maize yields than Eqn (5) and thus also the other models.
DISCUSSION
In the present study, the impact of climate variables on maize yields in northern China was investigated. The most important result was that accumulated heat throughout the growing season (as measured by seasonal growing degree days) was probably the most important weather variable influencing maize yields. However, the relationship between growing degree days and maize yields was subtle and could not be captured adequately by a linear or quadratic functional relation. Rather, the relationship was much more complicated, requiring the use of a flexible functional form, and had to be estimated as a highly nonlinear regression model.
Not surprisingly, precipitation was also important but added to crop yields primarily during the peak of the growing season, indicating that it was of less importance than heat units, i.e. moisture was important for the study region, but there was probably enough soil moisture that rainfall in mid-summer simply provided a boost to yields that declined rapidly with higher levels of rainfall. Given the size of the estimated parameters, district fixed effects and adopted technical advances were also important factors explaining crop yields.
Finally, the two best-fitted models, Eqns (4) and (5) captured 80% or more of the variation in maize yields. In that case, the estimated regression models could potentially be used as a basis for developing weather-indexed insurance products in this study area. For example, farmers in western and central China have expressed interest in weather-indexed insurance to mitigate weather risks (Turvey et al. Reference Turvey, Kong and Belltawn2009; Liu et al. Reference Liu, Li, Guo and Shan2010); therefore, the current work could be extended to develop weather-indexed insurance using the relationship between growing degree days and yields to establish actuarially sound premiums. The model can also be used to predict potential maize yields under future climate scenarios, providing some indication of the potential damage from global warming; however, such scenarios would neither take into account adaptation by landowners (e.g. planting different crops) nor agricultural infrastructure improvements made by government (e.g. irrigation works) and technological changes that lead to greater adaptation to climate changes in the agricultural sector. Further research is needed to examine the effect of climate factors on crop yields, and how this information can be used to develop weather-indexed crop insurance and other financial weather derivatives and strategies for adapting to climate change in the agricultural sector.
The authors are grateful for research support from the LEARN-ERCA network of Agriculture and Agri-Food Canada and the Canadian Social Sciences and Humanities Research Council.