1. Introduction
In many developing countries, fisheries play a vital role in providing income, food and employment. However, the authorities have often little control over their activities. Due to high population growth and few alternative employment opportunities for the fishing population, this has resulted in overfishing in many coastal and ocean areas. The fishery is frequently of the open-access type, and it can be difficult to avoid what Hardin (Reference Hardin1968) called ‘the tragedy of the commons’. In this paper, we draw attention to the organization of the fisheries supply chains in general and to the role of middlemen in particular, and we demonstrate that under certain conditions the presence of middlemen may reduce the degree of overfishing and contribute to economic rent creation.
Since the 1960s, various solutions have been proposed to remedy the possible market and management failures of open-access fisheries. One solution has emphasized the need for government regulation. To manage the resources, the authorities have to define and enforce rules regarding participation, effort use, where and when fishing can take place, and how much can be fished. Taxes can be a part of the solution (Flaaten and Schulz, Reference Flaaten and Schulz2010; Flaaten, Reference Flaaten2018). Another solution has been to introduce private property rights to fishing quotas. It is argued that by privatizing rights and making them transferable (ITQs), incentives for overfishing will be removed (Hannesson, Reference Hannesson2000). A third solution favors co-management, which implies that different stakeholders should take joint responsibility for managing the resources (Ostrom, Reference Ostrom1990).
All three solutions can be difficult to implement, especially in developing countries. The governments may lack the resources and capacity to set science-based quotas and to introduce effective measures to regulate fishing. Market-based solutions, such as fishing rights being auctioned off, also require significant monitoring, control and enforcement, and the social costs can be prohibitively high. Similarly, co-management rests on many institutional preconditions that are not present everywhere (Ostrom, Reference Ostrom1990; Reference Ostrom2009). This raises the question of whether there are other mechanisms that may contribute to sustainable development and combine the goals of resource conservation, economic efficiency and social equity.
It is well known that middlemen abound in the fish trade in many developing countries. Their efficiency and social role has been discussed for decades, and the opinions diverge. Some regard middlemen as purely exploitative and maintain that by bypassing the middlemen, the leakage of benefit would be reduced along the supply chain (Masters, Reference Masters2008; Anderson et al., Reference Andersen, Cheng, Frandsen, Kuyvenhoven and Braun2009). Others point out that middlemen are indispensable and perform important functions, including selling fish to the processing industry, grading or processing fish themselves, and selling to the world market (Crona et al., Reference Crona, Nyström, Folke and Jiddawi2010; Arya et al., Reference Arya, Loffler, Mittendorf and Pfeiffer2015). Additionally, middlemen reduce the time and effort needed by fishermen to marketing their products. In fact, fishermen often cannot perform these tasks on their own due to limited education and knowledge in the fields of trade and negotiation. Fishermen may also rely on financial guarantees provided by the middlemen during fishing periods, notably in periods with low catches.
While acknowledging these functions, others again emphasize the power asymmetry between fishermen and middlemen. The fishermen offer a perishable good and have few alternative outlets. They also have limited information about prices, and they often have to accept the price offered by the buyers. Hence, the middlemen can strongly influence the ex-vessel price, the price that fishermen receive when selling their harvest, and the price in the downstream markets tends to be defined by the price in the upstream markets. Few studies, however, have elaborated on these relationships and analyzed the effects of market structure on resource exploitation and economic rent in fisheries (WTO, 2010).
In this paper, we take a new look at the role of middlemen as the intermediaries in the fisheries supply chains. What are the economic and biological effects of middlemen in the supply chains? Given that a first-best solution may be unattainable, can the presence of middlemen with market power be a second-best solution that may help to achieve more sustainable management? According to second-best theory, correction of a market imperfection in one area does not necessarily lead to an improvement in efficiency at the global level (Kronbak et al., Reference Kronbak, Squires and Vestergaard2014). For example, by removing the imperfection associated with the market power of middlemen, which hampers competition in the value chain, the fishing pressure might be increased.
This indicates that it is necessary to study the situation and the implications of various measures in more detail. The role of middlemen is seldom accounted for in fisheries governance in developing countries. Three classical studies that discuss the linkages between the harvesting and processing sectors – Crutchfield and Pontecorvo (Reference Crutchfield and Pontecorvo1969), Clark and Munro (Reference Clark and Munro1980) and Schworm (Reference Schworm1983) – all argue that monopsonistic processors may improve the efficiency of the utilization of a common pool resource. In this paper, we take the analysis one step further by explicitly incorporating the middlemen into the open-access model. The theoretical discussion considers various market structures at the intermediary level (competitive, oligopsony and monopsony) and also includes heterogeneous fishermen in the harvesting sector. Two case studies from Vietnam elucidate the theoretical discussion.
The findings of the paper demonstrate that middlemen with market power can help protect marine resources from depletion by implicitly ‘taxing’ the harvest, leading to lower ex-vessel price. Therefore, the problem of open-access fisheries – attracting too much fishing effort and dissipating resource rent – may be avoided, fully or partly, when there are middlemen with market power. It transpires that intervention by the government is necessary only if this market power is too weak or too strong. The former may lead to excessive effort and the latter to underutilization of the fishery resources.
The remainder of the paper is structured as follows. First, in section 2 we formulate a basic model of the relationship between the final market price and the ex-vessel price, taking into account the degree of market power among middlemen. Next, in section 3 the effects on the ex-vessel price, fish stock, and rents of fishermen and middlemen in the supply chain of a price change in the final market are analyzed. In section 4, the theoretical findings are applied to two cases – the supply chains of offshore skipjack tuna (Thunnus albacares) and inshore anchovy (Stolephorus commersonnii, Stolephorus tri, Stolephorus indicus) in Vietnam. Finally, the main findings are discussed in section 5 and summarized in section 6.
2. The basic model
The supply chain links the final fish market and the ex-vessel market. In developing countries, there are essentially three market segments that define this supply chain: the first stage market, the intermediary market and the final stage market. The middlemen receive the final market price for the fish and then offer an ex-vessel price to fishermen. The fishermen and the middlemen are part of an integrated chain of economic functions and linkages across geographic boundaries (Gudmundsson et al., Reference Gudmundsson, Asche and Nielsen2006; Nielsen, Reference Nielsen2006), and both of them are affected by the final market price. The economic interests of fishermen and middlemen may differ, but ultimately their income depends on the consumers' willingness to pay for the fish. In this paper, the point of departure is a pure open-access fishery, which is common in many developing countries. Vessels are, by assumption, heterogeneous, as this is typical in most fisheries, and vessels may vary with respect to labor use and technological characteristics, such as size, engine power and gear-type (Flaaten, Reference Flaaten2018).
In what follows, the natural growth of the fish stock is given by the peak-valued Gompertz-Fox function. This model also yields a shape similar to the backward-bending curve in fisheries (Thuy and Flaaten, Reference Thuy and Flaaten2013), and thus helps link fisheries trade and fish stock. The natural growth is hence defined by:

where X is stock (measured as biomass), r is the intrinsic growth rate and K is the carrying capacity. The harvest is given by the standard Schaefer function:

with E as fishing effort, and q as the productivity (‘catchability’) coefficient. In biological equilibrium, harvest equals natural growth, H = G(X), or:

and this yields E = r/qlnK/X. With P as the ex-vessel price of raw fish, the total revenue is:

Vessels are heterogeneous and we assume the aggregate cost function is increasing and convex (Clark, Reference Clark2007: 163):

where γ is the marginal cost of effort parameter. In bioeconomic equilibrium under open-access, the average revenue of effort equals the marginal cost of effort, AR(E) = MC(E) (Copes, Reference Copes1972), which implies PqX = γ E. This yields

In addition, the ex-vessel market supply price elasticity, defined as ε = ∂H/∂P · P/H · ∂H/∂P, is found by taking the derivative of equation (3), ∂H/∂P = r(lnK/X − 1) · ∂X/∂P. When next inserting ∂X/∂P from equation (5), ∂X/∂P = −q 2X 2/γ r(lnK/X + 1), the supply elasticity reads:

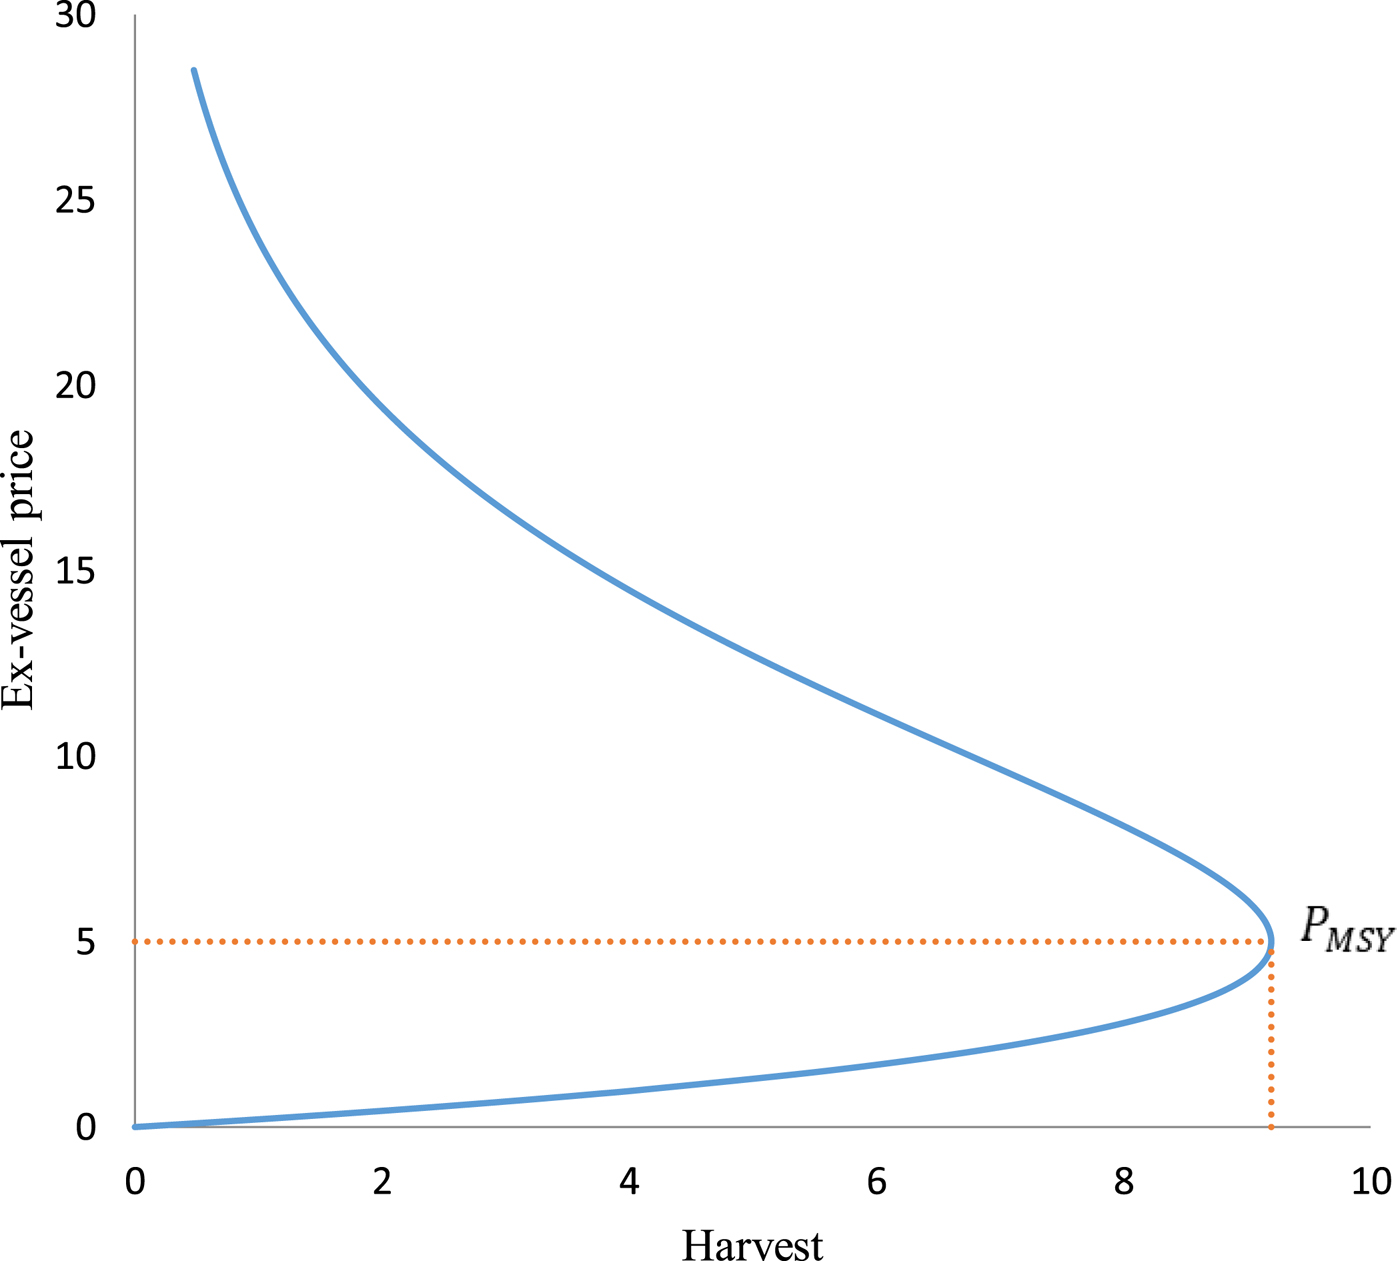
It is observed that ε > 0 for > K/e, ε < 0 for X < K/e, and ε = 0 for X = X MSY = K/e (X MSY; the maximum sustainable yield (MSY) stock). The maximum sustainable harvest follows then as H = H MSY = rK/e.
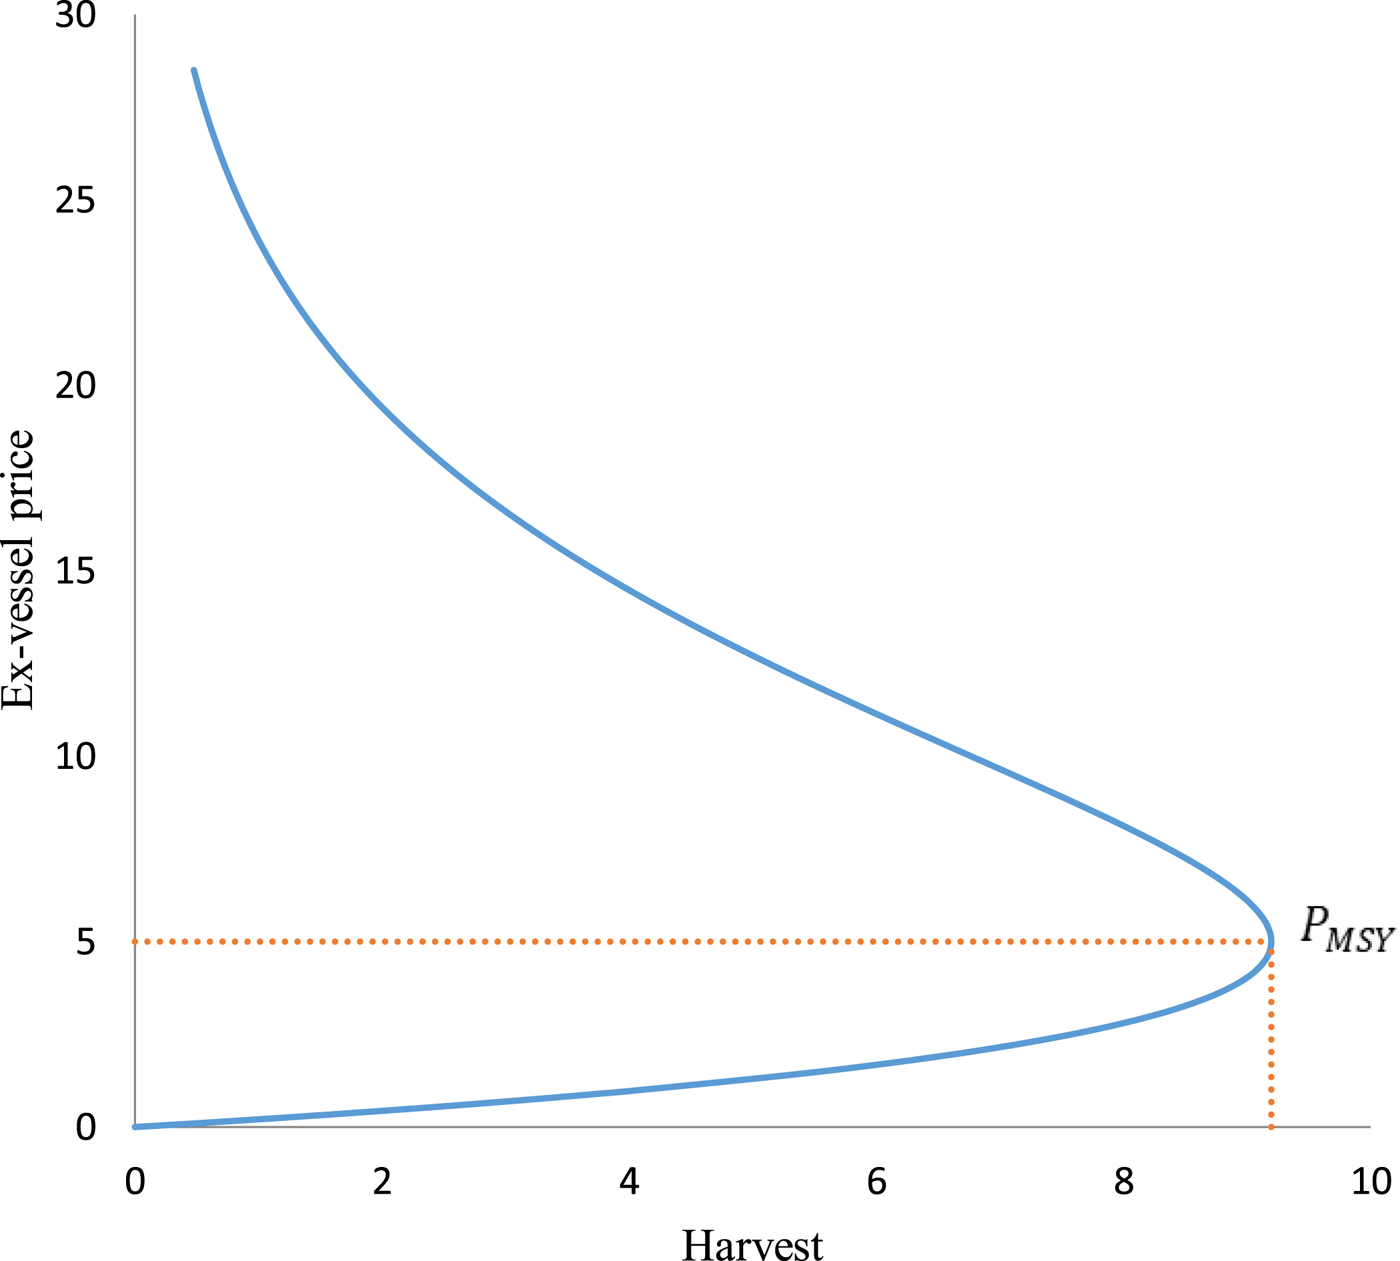
Equation (5) can be used to discuss the linkage between prices and biological effects from the fisheries trade. Prices might also affect fishermen's behavior and hence their harvesting strategies. Therefore, equation (5) implicitly hints at the backward-bending supply curve in fisheries, introduced by Copes (Reference Copes1970) (see figure 1). In the short run, the supply of fish increases with the price, but in the long run, which is the focus of this paper, it is constrained by the limited growth of the stock. If the fish price is relatively low, the incentive to fish is weak. This implies that few fish are caught and the fish population is abundant and near its carrying capacity level. For a very low price, no fishing takes place at all due to the cost. For a moderate fish price, more effort is attracted into fishing, more fish are caught and the fish population is reduced. For a very high fish price, still more effort goes into fishing, but fewer fish are caught due to the depleted stock. Consequently, supply decreases with increased price when P > P MSY.
The backward-bending supply curve in fisheries.
The profit of middleman i is defined by the remainder of revenue after all operating costs:

where P n denotes the final market price of processed fish; c i is the average production cost per unit of processed fish, excluding the cost of raw fish; and h i is the amount of raw fish bought by the middleman i. The conversion of raw fish to processed fish is assumed to be 1.
Given that the middleman's objective is to maximize profit, the first-order condition $d\pi _m^i/d{h^i} = 0$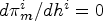 implies that:

Assuming n middlemen operating in the ex-vessel market, the total harvest bought in the ex-vessel market is, accordingly, $H = \sum\nolimits_{i = 1}^n {{h^i}}$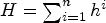 . Rewriting equation (7) leads to the following simplified equation:

where the elasticity μ i = ∂H/∂h i · h i/H indicates the market power for middleman i.
For simplicity, we now assume that the middlemen have identical cost structures, i.e., c i = c for all i = 1, …, n. Then μ i will be similar for all the n equally-sized middlemen, μ i = μ, and the ex-vessel price P can thus be expressed as

The market power parameter is restricted as 0 ≤ μ ≤ 1. If μ = 0, the middlemen are perfectly competitive.; if μ = 1, there is only one monopsonistic middleman, whereas intermediate values of μ imply varying degrees of oligopsonistic competition.
With the above assumptions leading to equation (9), the ex-vessel price varies depending on the maximum affordable price that the middlemen can pay the fishermen, i.e., the final market price after deducting production costs, P n − c, the degree of market power of the middlemen, μ, and the price elasticity of supply, ε.
3. Final market price change effects
3.1 Ex-vessel price
Based on the above theoretical model, we now focus on to what extent a final market price change is transmitted to the ex-vessel market. In this transmission, the effects of market power of the middlemen are highlighted.
Proposition 1. 1.1 An increase in the final market price implies an increase in the ex-vessel price, but the more market power the middlemen have, the less the increase will be; that is:

1.2 The price transmission between the final market and the ex-vessel market is perfect (∂P/∂P n = 1) under perfect competition, μ = 0, and it is imperfect (∂P/∂P n < 1) if competition is imperfect, 0 < μ ≤ 1.
1.3 Middlemen with market power will keep the ex-vessel price below the level that produces MSY (P < P MSY).
Proof: See online appendix.
Proposition 1.1 specifies the effect of the final market price and market power on the ex-vessel price. It is clear that as the final market price increases, the ex-vessel price increases as well. However, this increase is hampered by the middlemen's market power, and if the degree of market power is strong, a higher final market price will have less impact on the ex-vessel price.
Proposition 1.2 indicates that the proportionality of the ex-vessel price to the final market price depends on market power. When the middlemen remain competitive, i.e., when the middlemen have no market power, the final market price is transmitted perfectly to the ex-vessel price. In other words, a shift in the final market price is entirely reflected in the ex-vessel price. When the middlemen have market power, they are able to keep the price paid to the fishermen down, and thus the price transmission occurs imperfectly.
Proposition 1.3 is based on the rule that no middlemen will lose from selling fish if market power prevails. They tend to offer a smaller ex-vessel price P than the maximum affordable price, P n − c. This keeps the ex-vessel price below the level that induces MSY.
3.2 Fish stocks
We next consider the effects of the final market price on the fish stock.
Proposition 2. 2.1 An increase in the final market price implies a higher exploitation pressure, but the existence of middlemen with market power dampens the pressure on the stock; that is:

2.2 The negative fish stock effect is greater when the middlemen are competitive than when they are non-competitive: ∂X/∂P|μ=0 < ∂X/∂P n|0<μ≤1 < 0.
2.3 Middlemen with market power will keep fish stocks above the level that produces MSY, while competing middlemen can deplete fish stocks below that of the MSY level:

Proof: See online appendix.
Proposition 2.1 yields the impact of the final market price and the degree of market power among the middlemen on the equilibrium fish stock in the open-access fishery. When the final market price goes up, the middlemen offer a higher ex-vessel price to the fishermen. This motivates the fishermen to increase fishing efforts to obtain higher profit, again leading to a reduced fish stock. However, the market power has an offsetting influence. If imperfect competition exists, the reduction in fish abundance is smaller. As the degree of market power rises and the ex-vessel price falls, fishing is discouraged and the fish stock is preserved to a greater extent. This statement is also supported by Halsema and Withagen (Reference Halsema and Withagen2008).
Proposition 2.2 compares changes in the fish stock from a shift in the final market price under competitive market conditions and non-competitive market conditions at the intermediary level. It is clear that the pressure on the fish stock will be greater under perfect than under imperfect competition. A middleman with market power is able to reduce fish extraction. This is because, within certain limits, middlemen can decide how much to pay for raw fish. They tend to prefer a low ex-vessel price to save costs. From the fishermen's perspective, a low price discourages them from fishing, and some might stop fishing or even exit the fishery. Consequently, at equilibrium, a smaller fishing effort relieves pressure on the fish stocks.
Proposition 2.3 indicates how middlemen with and without market power encourage or discourage fishermen from preserving resources. When perfect competition prevails, there is a race for fish among the middlemen and they are willing to pay a higher price to the fishermen to obtain more raw fish. A higher ex-vessel price encourages fishermen to intensify the harvesting pressure, ultimately leading to overexploitation of the fish stock. When the ex-vessel price rises above the level that yields MSY, a further price increase no longer provides the middlemen a larger supply of fish. Under imperfect competition, few middlemen are in the market and determine the ex-vessel price. They will set the price such that P n − c > P, indicating that the offered price is always below the price that keeps the stock above that of X MSY.
3.3 Economic rent
Generally, economic rent is any payment to a factor of production in excess of the cost needed to bring that factor into production. In classical economics, economic rent is any payment made (including imputed value) or benefit received for non-produced inputs. In neoclassical economics, it also includes income gained by beneficiaries of other contrived exclusivity, such as labor guilds and corruption. When considering natural resources, the current economic rent equals the value of capital service flows rendered by the natural resources or their share in the gross operating surplus; its value is given by the value of extraction. In other words, it consists of two components: resource rent and intra-marginal rent. Under open-access fisheries, the resource rent is normally dissipated through excessive levels of fishing effort (Gordon, Reference Gordon1954; Hardin, Reference Hardin1968; Munro and Scott, Reference Munro, Scott, Knesse and Sweeney1985; Homans and Wilen, Reference Homans and Wilen1997, Reference Homans and Wilen2005). However, intra-marginal rent still accrues to vessels that are more cost efficient than marginal ones. In other words, intra-marginal rent exists whenever vessels are heterogeneous in terms of capital and labor (Copes, Reference Copes1972; Coglan and Pascoe, Reference Coglan and Pascoe1999; Duy et al., Reference Duy, Flaaten, Kim Anh and Ngoc2012b; Flaaten, Reference Flaaten2018).
3.4 Fishermen's rent
The rent gained by fishermen in the open-access fishery model, the intra-marginal rent, is defined by the revenue in excess of costs, and yields πf = PH − γ/2(H/qX)2 when using the cost function equation (4) and the harvest function equation (2). Substituting H from equation (3) and P from equation (5), and rearranging somewhat, gives

Therefore, to what extent the harvesting sector obtains rent depends not only on the cost parameter γ, but also on catchability q and the stock size X, which in turn is influenced by fishermen's price P, and the carrying capacity K and the intrinsic growth rate r.
3.5 Middlemen's rent
Following equations (6) and (8), the maximized rent flow of a representative middleman can be expressed as $\pi _m^i = {\mu ^i}/\varepsilon \,\,\,P{h^i}$ . Noting that $H = \sum\nolimits_{i = 1}^n {{h^i}}$
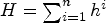 , the total rent of the intermediary sector is accordingly:

3.6 Total rent
The total industry rent is found by summarizing equations (10) and (11), which yields:

Proposition 3. 3.1 Although there is no economic rent for the competitive middlemen, the fishermen still gain a rent increase from a final market price increase; that is: $\partial {\pi _m}/\partial {P_n} = 0\ \textrm{and}\ \partial {\pi _f}/\partial {P_n} \gt 0$ .
3.2 The existence of middlemen with market power generates higher rents for both fishermen and middlemen from a final market price increase; that is:

3.3 Middlemen with market power can partly transfer some rent from the fishermen to themselves; that is, when the degree of market power is higher, the fishermen will receive less rent and the middlemen will gain more rent:

Total rent will also increase more than in a perfect market:

Proof: See online appendix.
Proposition 3.1 shows that, in an overexploited fishery, the fishermen still gain more rent from a final market price increase, but the middlemen receive zero profit. High competition among the middlemen induces them to pay fishermen a higher price in order to purchase more fish. However, if the ex-vessel price becomes too high, some middlemen will sustain a loss and therefore leave the market. The same scenario holds for the fishermen. In the early stage of overfishing, they stay in the market and continue fishing because they observe a relatively high price. Nevertheless, after a while, less fish are available and the harvest will eventually be reduced. Those fishermen who face a loss will stop fishing. However, the stock is not recovered to above that of the MSY level. The reason is that some cost efficient fishermen can stay and make a profit even in the overexploited fishery.
Proposition 3.2 captures the importance of imperfect competition among the middlemen. When this is the case, increased final market prices will be translated into higher rent for both the fishermen and the middlemen. With imperfect competition, the middlemen can control the ex-vessel price below and the stock above the levels that provide MSY. Thus, the effect of the final market price on the total economic rent of the fishermen and the middlemen is always greater than zero.
While the presence of market power always promotes rent for the middlemen, it dissipates rent for the fishermen. Part of the fishermen's rent will be transferred to the middlemen, as pointed out in proposition 3.3. If there is no market power among the middlemen, the rent of the fishermen will be determined entirely by the shift in the ex-vessel price which in turn is equal to the shift in the final market price. If market power exists, increasing market power implies that the importance of the final market price is tempered; the rent of the fishermen drops and more accrues to the middlemen. The middlemen can collect the rents for themselves by keeping the price paid to the fishermen below the level that provides MSY. The total rents of the industry will be increased and can even become higher than those in the perfect market. However, most of the profits are captured by the middlemen.
4. Examples
To illustrate how the theoretical results may fit in reality, we consider two examples from Vietnamese fisheries: (1) the anchovy supply chain, in which anchovy is harvested by inshore purse seine vessels and supplied to the domestic market; and (2) the skipjack tuna supply chain, in which the skipjack tuna is provided by offshore gillnet fisheries for the international market. The characteristics of middlemen are different in these two supply chains; while processors are the key middlemen who bring skipjack tuna to the international market, the anchovy arrives in the domestic market mainly through traders.
4.1 The anchovy supply chain
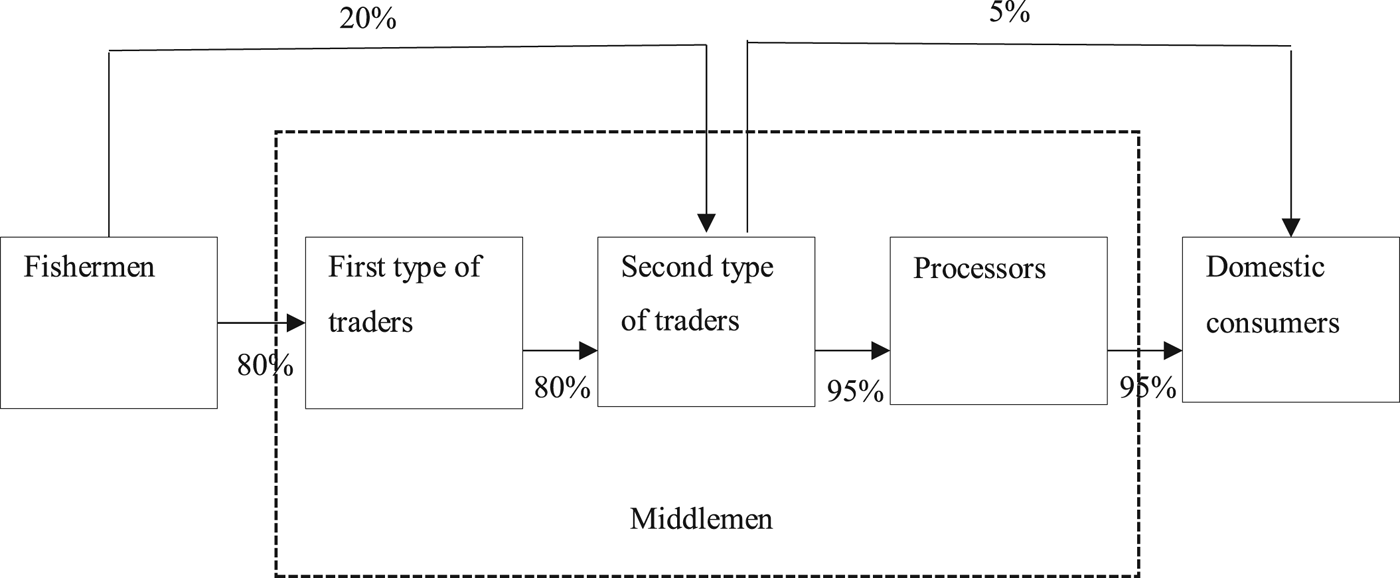
The anchovy supply chain is presented in figure 2. Typically, all harvest is sold to middlemen before being transferred to final consumers. Middlemen here are defined as processing companies and/or traders. The first type of traders are those purchasing the harvest from several small fishing vessels at sea and selling the fish to the second type of traders operating on land. The latter provide fish for the processing companies and the domestic consumer market. The existence of the first type allows fishing vessels to stay at sea continuously for longer periods, thus reducing fuel consumption and operating costs. The second type of traders normally have better equity financing than the first type, and can implement and negotiate larger transactions. These traders are usually better educated and qualified than fishermen and the first type of traders to deal with the many documents required when selling to the processing sector.
The anchovy supply chain in Vietnam.

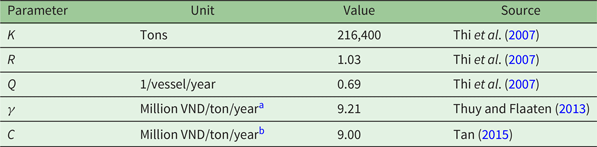
With varying domestic market price during the period 2005–2017, this example aims at illustrating what the estimated ex-vessel price, anchovy stock, and rent of the supply chain would be. Data includes actual ex-vessel prices and actual domestic market prices. These prices are all adjusted to the price level of 2017, using the consumer price index. Some parameter values are from three previous studies on anchovy fisheries in Vietnam: Thi et al. (Reference Thi, Bat, Nguyen, Anh, Nghia, Ha and Thanh2007), Tan (Reference Tan2015) and Thuy and Flaaten (Reference Thuy and Flaaten2013) (see table 1).
Parameters for illustration of the anchovy supply chain case, 2005–2017

a The average cost of the years 2005, 2008, and 2011.
b The average cost for the period 2010–2015.
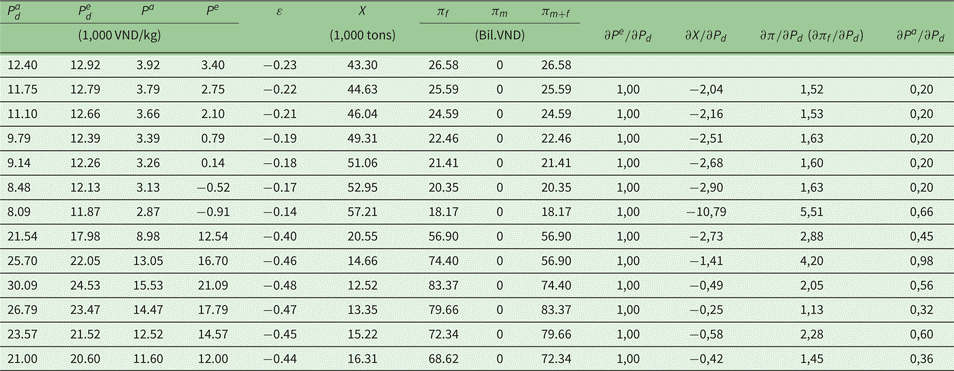
The estimation is achieved using numerical approaches. Particularly, we estimate the anchovy stock from equation (5), ex-vessel price from equation (8), the rent from equations (10)–(12) and their marginal changes according to the propositions (see detailed results in table A1 in the appendix). The comparison between the actual prices and the estimated ones allows examination of the purchasing and market power of middlemen in the supply chain.
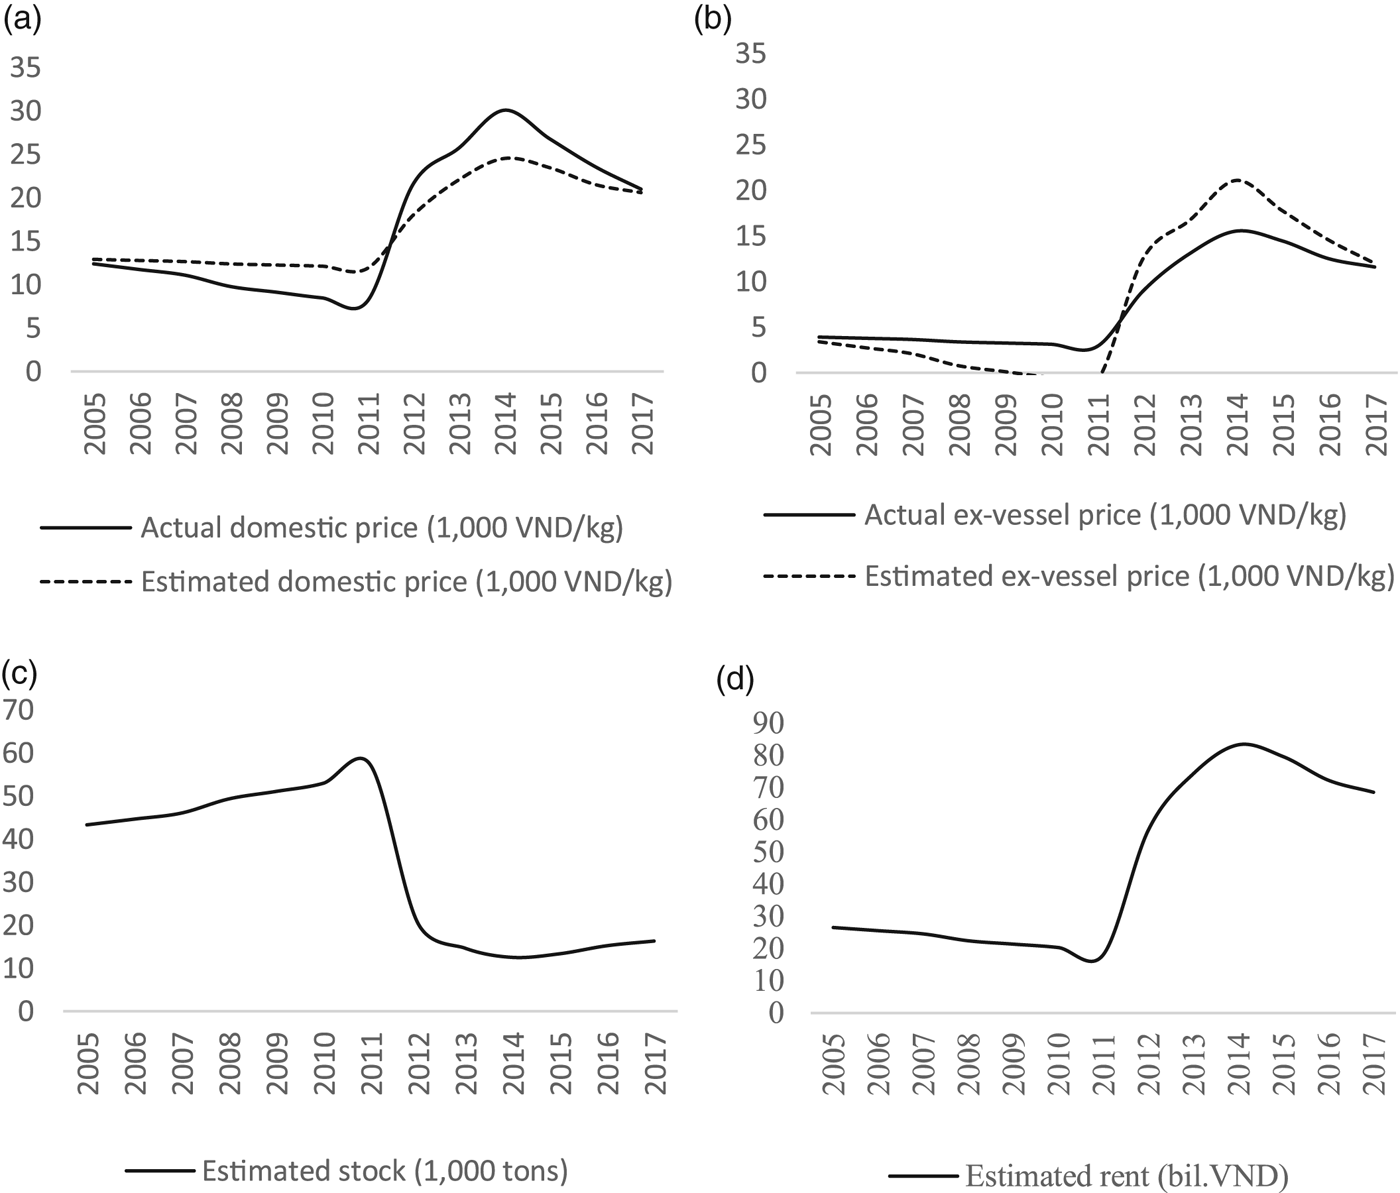
The linkages between the domestic price and the ex-vessel price, the stock and the rent for the anchovy case are presented in figure 3. Figures 3 (a), (c) and (d) show that with increasing domestic price, the ex-vessel price and the rent increase and the stock is reduced (as in propositions 1.1, 2.1, and 3.1). Note that in the anchovy case, it is the domestic market price that represents the exogenous final market price. The elasticity of supply is found to be negative for all the observed positive ex-vessel prices, implying that μ must be equal to zero (based on equation (8)). Thus, there is neither oligopsonistic nor monopsonistic power for the middlemen and the anchovy stock is being overexploited (based on proposition 2.3). Overfishing in the anchovy fishery has also been established by Thi et al. (Reference Thi, Bat, Nguyen, Anh, Nghia, Ha and Thanh2007) and Thuy and Flaaten (Reference Thuy and Flaaten2013). Thus, middlemen gain no rent in this chain (based on proposition 3). Furthermore, as the estimated prices are rather close to the actual ones, this indicates that the results derived from the model fit with reality (figures 3 (a) and (b)). Figure 4 shows that marginal changes of the estimated ex-vessel prices and rent over the actual domestic prices are always positive, whereas those of stock are always negative.
Anchovy supply chain: (a) Time path of domestic actual and estimated final prices; (b) Time path of actual and estimated ex-vessel prices; (c) Time path of estimated stock; (d) Time path of estimated rent.

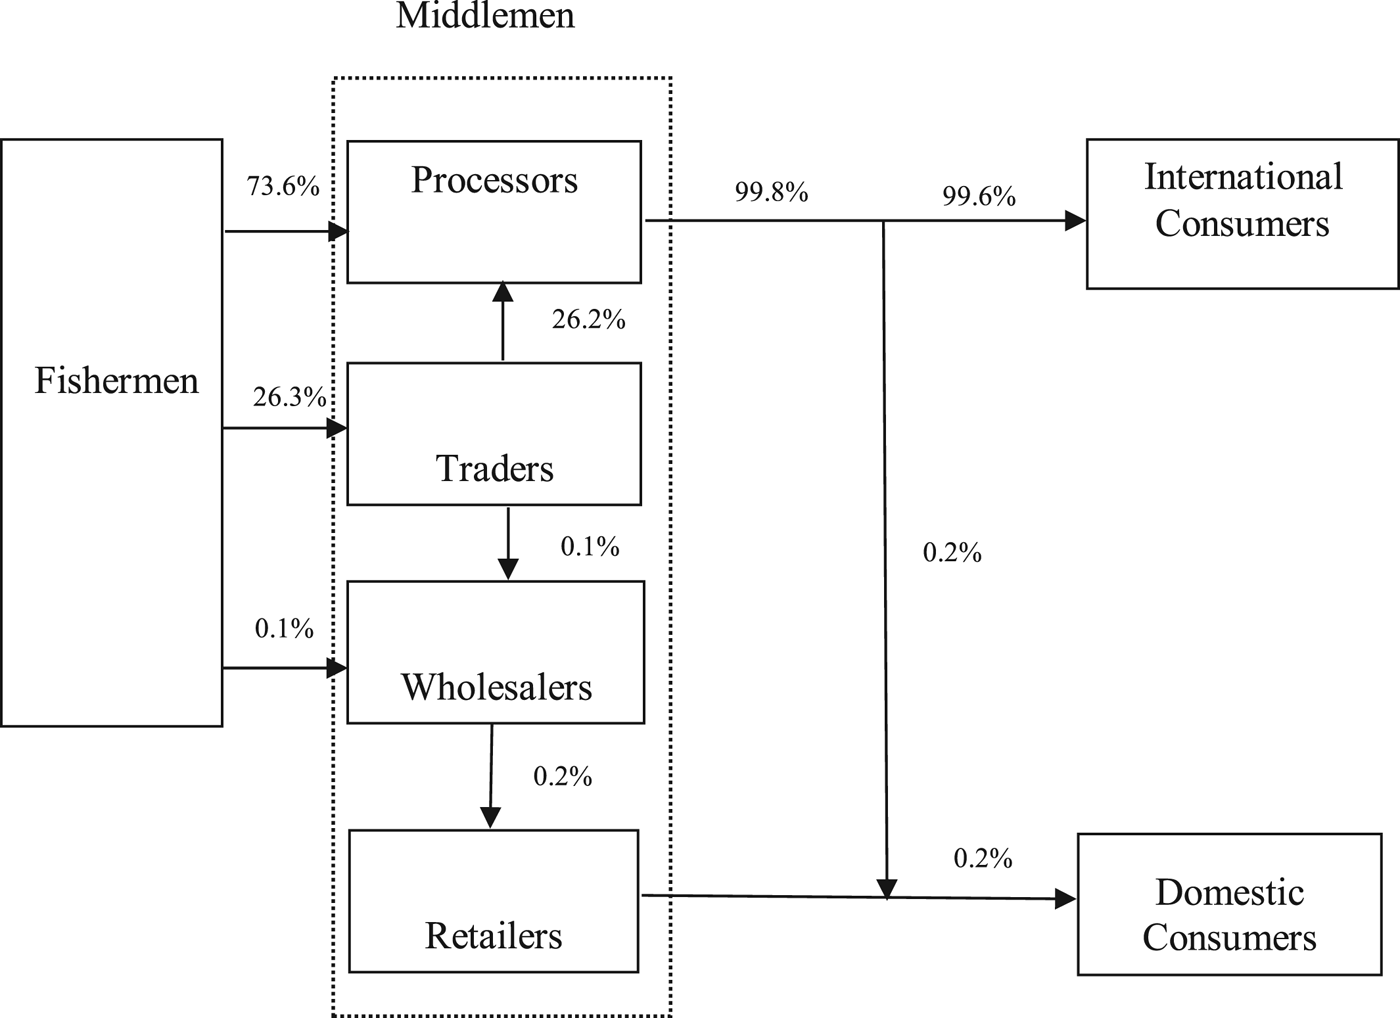
The skipjack tuna supply chain in Vietnam.

4.2 The skipjack tuna supply chain
Like the anchovy supply chain, the skipjack tuna enters the final market through the contribution of two types of middlemen: processors and traders. However, traders in the offshore skipjack tuna fisheries are supplementary in linking the fishermen to the processing companies, to whom they sell almost all their fish. The supply chain of skipjack tuna is depicted in figure 4.
There are several products included in the skipjack tuna supply chain. However, only the fresh fillet tunaFootnote 1 is included in this analysis. We explore the effects of its export price on the ex-vessel price and the stock. The market structure is also tested to identify if middlemen have any power to adjust prices in the chain. However, due to lack of data, the harvest data is used to discuss possible effects only on the stock, and the effects on the rent are not considered. The quarterly data for the period 2009–2017 were used in the analysis.
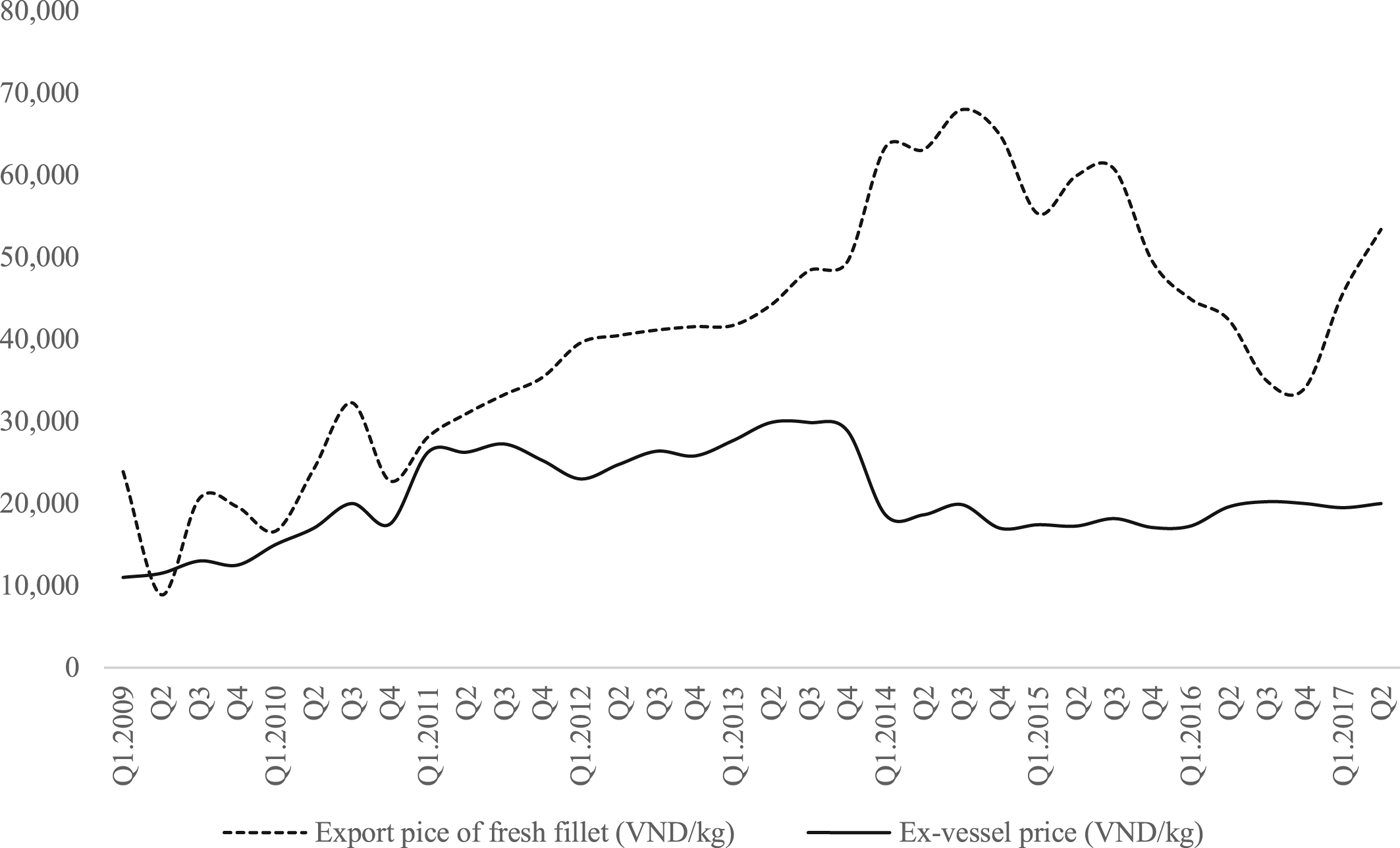
Figure 5 reveals that the ex-vessel price and the export price move quite closely up to 2011. However, later, the export price moved upward, then fluctuated from 2014, whereas the ex-vessel price stayed more or less constant. This indicates an asymmetric price transmission from the export price to the ex-vessel price. Indeed, an imperfect market structure is expected in the skipjack tuna supply chain, since the number of middlemen is relatively small compared to the number of fishermen. The quality of the skipjack tuna deteriorates soon after harvest. Therefore, middlemen may gain market power over fishermen when the fishing ground to shore distance and time often force fishermen to sell their catch quickly. Furthermore, many fishermen are bound by credit arrangements and reciprocal agreements with the middlemen, adding to the oligopsonistic power of the middlemen.
Fresh fillet tuna supply chain: Quarterly export price and ex-vessel price, 2009–2017.

Different techniques can be applied to examine price transmission in seafood commodity markets (Asche et al., Reference Asche, Flaaten, Isaksen and Vassdal2002, Reference Asche, Jaffry and Hartmann2007; Sapkota et al., Reference Sapkota, Dey, Alam and Singh2015). The researcher's choice may depend on the questions asked, the data available and the assumptions to be made. The error correction model (ECM) is considered an appropriate specification for testing asymmetric price transmission. The ECM model employed is as follows:

where P t−i and P w,t−j are the ex-vessel price and the export price of fresh fillet tuna at quarter t-i and t-j, respectively, and n is the lag order of P w and P t. Furthermore, d(ln P t) and d(ln P w,t−j) represent their changes, measured on a quarterly basis, and a 0 is a constant term that captures transportation costs and quality differences. The estimated coefficient a 1i examines whether the ex-vessel prices from the past quarter(s) can have any impacts on that of the current period. The short-term price transmissions from P w,t−j to P t are measured by a 2j. The transmission is either perfect or imperfect, depending on a 2j = 1 or 0 < a 2j < 1. u t−1 is an error term, which implies speed of adjustment to long-term equilibrium while ε t is the residual (white noise).
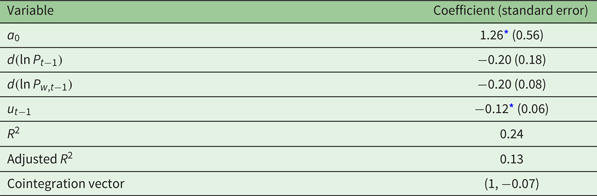
The results of the ECM model are given in table 2.Footnote 2 The variable d(lnP w,t−1) is insignificant at the 5 per cent level, meaning that there was no short-term causality between the export price of fresh fillet and ex-vessel price of skipjack tuna. The coefficient of u t−1 is negative (−0.12) and significant. This shows that 12 per cent of disequilibrium is corrected within one quarter for reaching a long-term equilibrium state. In other words, only 12 per cent of the difference between long-term and short-term ex-vessel prices is adjusted within 3 months. More importantly, the estimated cointegration vector confirms that, given a 1 per cent increase in the export price of the fresh fillet tuna, the ex-vessel price will increase by 0.07 per cent in the long run; this implies that the export price leads the ex-vessel price, which is consistent with the fact that middlemen have a stronger position in negotiating prices. In short, market power prevails in the intermediary sector of the chain and middlemen may abuse their market power to slow down an increase in ex-vessel price to reap their profit margin.
OLS parameter estimates of ECM

* Significant at the 5% level.
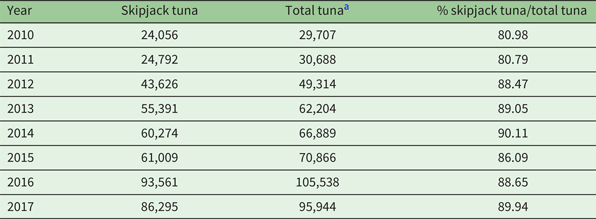
An interesting question then is if the stock is above the level that produces the MSY, as claimed in proposition 2.3. In fact, this seems to be true for the skipjack tuna case. The total catch of tuna has been recorded to increase substantially during the period 2010–2017 (table 3). The catch is also evaluated as far below MSY (MARD, 2018). This indicates that tuna fishing is currently not overexploited and the stock is above that of the level that produces MSY.
Total tuna catch in Vietnam's Exclusive Economic Zone, 2010–2017 (in metric tons)

a Includes skipjack tuna, yellowfin tuna and bigeye tuna.
Source: MARD (2018).
To summarize, the empirical results indicate that there is perfect competition among middlemen in the anchovy supply chain, where the anchovy stock is overexploited. In contrast, in the skipjack tuna supply chain, middlemen with their market power have contributed to keeping the stock above the MSY level.
5. Discussion
Our findings indicate that middlemen have the potential to contribute to resource sustainability. They can partly offset overfishing caused by the open-access nature of the fishery, and they can assure that fishermen and middlemen share the rent increase when the final market price rises. At the same time, those with market power will take most of the rent.
The market power of middlemen has a similar effect as a harvest tax imposed on the fishermen. The government could, alternatively, have levied this or introduced an export tax. It is clear that the implementation of a harvest tax requires management costs that are not free. The middlemen, who exist as a consequence of the functioning of the market, contribute to conservation of the fish stocks, and the government does not have to pay any fee for that. From a management point of view, this can be seen as an advantage, since management costs can make up a considerable percentage of landed value (Wallis and Flaaten, Reference Wallis, Flaaten, Schrank, Arnason and Hannesson2003). Furthermore, introducing the correct harvest tax on the fishermen is challenging. One question to ask is who receives the rents and who pays the costs. When an industry generates economic rent, there may be a race to capture the rent. In the bioeconomic models, it has usually been assumed that the rent accrues to the fishermen. However, rent could be captured by middlemen, as demonstrated above.
Middlemen can therefore also be part of the problem in the management of fisheries resources. A market with a few powerful middlemen can have efficiency disadvantages. Fish stocks may be excessively conserved and not utilized in a rational economic way. Middlemen may exploit their power and take most of the rent to the detriment of fishermen. A welfare economic optimum will not be achieved, since in this scenario the rent mainly accrues to a few middlemen. It is obvious that there are still trade-offs and difficult balancing problems, and these need to be addressed by the authorities. But managing a limited number of middlemen or processors is probably easier and less costly than managing a large number of fishermen. Therefore, allowing middlemen to operate the market and capture the rent, and then imposing a tax on them, may be a second-best policy option. In Vietnam, from an economic efficiency point of view, it would be better to prioritize management measures in the anchovy fisheries rather than in the tuna fisheries.
This study confirms that positive rent can be generated in open-access fisheries as intra-marginal rent, due to the heterogeneous cost of vessels. Both the number of vessels entering the fishery and their cost structure will determine the size of the rent. Fishermen stay in the fishery for the rent in relation to their opportunity costs that may include different types of social cost and their individual valuation of leisure time, and they stay in the fishery as long as the net benefit is positive. Of course, there may be dissimilarities between the short and the long term. In the short term, it is sufficient for the vessels to cover their operational costs, whereas in the long term vessels have to operate on a full-cost coverage basis. If the overall objective of the fisheries' policy is rent maximization, including resource rent and intra-marginal rent, the optimal sustainable yield may in some cases become closer to the MSY (Copes, Reference Copes1972; Béné et al., Reference Béné, Hersoug and Allison2010). This can be achieved by establishing an intermediary sector, consisting of middlemen with a moderate degree of market power.
Different types of surplus can be generated in open-access fisheries (Flaaten et al., Reference Flaaten, Heen and Matthíasson2017). The economic rent computed above consists of resource rent, intra-marginal rent and producer surplus in the harvest and the processing industries. Quaas et al. (Reference Quaas, Stoeven, Klauere, Petersen and Schiller2018) pointed out that input owners of the harvesting sector can also create a surplus, and Thurman and Easley (Reference Thurman and Easley1992) argued that total surplus can be greater if substitute inputs and characteristics of the final consumers are taken into account. These aspects are not discussed here since we focus on the intermediary sectors in developing countries where input owners are normally small-scale operators and hardly have any market power. It is not easy for middlemen to switch trading from one species to another due to high investment costs of processing or preserving equipment and pre-defined contracts for certain species. The same applies to the retail sectors. However, in high income developed countries, increasing market power of the modern retail sector seems to be the case, but this is outside the scope of this study.
The total cost function applied in this study is a simple polynomial function of degree two, which gives a linear marginal cost function. In fact, it could be generalized as a polynomial form with a degree greater than two, depending on how elastic the effort–cost relationship is. However, even though the mathematical results would be more complicated, the qualitative findings would in principle be the same.
In the real world, seafood supply chains tend to be complex. They involve numerous interlinked activities performed by multiple intermediary actors located in different regions of a country, or even in various countries around the globe. Thus, to bring the theory closer to the real world, the analysis of the effects of the final market price on the basic biological and economic factors of open-access fisheries in a developing country could take into account the diverse intermediaries and the complex supply chain.
6. Conclusion
The issue of rent creation in open-access fisheries has not received much scholarly attention. Rather, it has generally been assumed that the economic rent will dwindle as an inevitable consequence of the open-access characteristics. This study enriches the literature by addressing the possibility of positive rent in open access fisheries. It also identifies opportunities to enhance rent without overexploitation of fish stocks by organizing the intermediary market through middlemen with market power. Middlemen may play an important role and act as a functional equivalent to a harvest tax that helps ensure resource conservation. However, unlike a harvest tax – which can be costly to implement – middlemen, as discussed above, operate as a constitutive part of the market. Nevertheless, having too few middlemen is a problem when it comes to rent distribution and social equality. Even though middlemen can create more rents for the supply chain, these rents mainly benefit the middlemen. Hence, collecting tax from middlemen is important and could prove beneficial, since it is easier than including a large number of fishermen. The middlemen institution in the case of Vietnam, and probably also in many other countries, has developed through the functioning of the market without governmental participation. Allowing the middlemen to operate the market (e.g., through licensing) and to capture the rent – and then taxing them – could be a second-best policy to apply. However, this necessitates further research.
Supplementary material
The supplementary material for this article can be found at https://doi.org/10.1017/S1355770X19000196
Acknowledgement
This paper has benefited substantially from valuable comments given by two anonymous reviewers and by Peter Arbo.
Appendix
Anchovy supply chain: summary of estimated domestic price, stock and rent