Introduction
Harmful algal blooms (HABs) can cause mass fish kill events and seafood contamination, posing economic as well as human health threats (e.g., Berdalet et al. Reference Berdalet, Fleming, Gowen, Davidson, Hess, Backer, Moore, Hoagland and Enevoldsen2015). These events have become more frequent and intense in many places around the world (e.g., Lim et al. Reference Lim, Usup and Leaw2012), being driven by an increase in anthropogenic eutrophication (e.g., Le et al. Reference Le, Billen, Garnier and Chau2015, Pedde et al. Reference Pedde, Kroeze, Mayorga and Seitzinger2017). In tropical East Sabah, Malaysia, anthropogenic input has displaced regional monsoon drivers as the major component of coastal nutrients (Mohammad-Noor et al. Reference Mohammad-Noor, Sing and Anwar2012). Human-driven regimes create sharper fluxes of environmental nutrients, which allow more adaptable and tolerant species to thrive. In addition to eutrophication patterns, globalised shipping routes have also increased connectivity between coastal waters and allowed several HAB species to become more widely distributed (Azanza & Taylor Reference Azanza and Taylor2001, Tang & Gobler Reference Tang and Gobler2012). This vector has especially favoured phytoplankton that can form dormant cysts and remains viable within ship ballast tanks (Hallegraeff Reference Hallegraeff1998, Wu et al. Reference Wu, Shen, Wang, Aronson, Chen and Xue2019).
Heterosigma akashiwo is a marine raphidophyte found in many places around the world (Kok et al. Reference Kok, Yeo and Leong2015, Engesmo et al. Reference Engesmo, Eikrem, Seoane, Smith, Edvardsen, Horgaard and Tomas2016). It forms recurrent and costly blooms in many temperate waters (e.g., Shikata et al. Reference Shikata, Nagasoe, Matsubara, Yoshikawa, Yamasaki, Shimasaki, Oshima, Jenkinson and Honjo2008, Branco et al. Reference Branco, Menezes, Alves-de-Souza, Domingos, Schramm and Proenca2014), triggering mass fish kill events through ichthyotoxins and other chemical substances (Ikeda et al. Reference Ikeda, Cochlan, Bronicheski, Trainer and Trick2016, Astuya et al. Reference Astuya, Rivera, Vega-Drake, Aburto, Cruzat, Ulloa, Caprile and Gallardo-Rodriguez2018). The species is both eurythermal and euryhaline and can survive on a range of nitrogen sources (Martinez et al. Reference Martinez, Orive, Laza-Martinez and Seoane2010, Kok et al. Reference Kok, Yeo and Leong2015). Cysts are an especially advantageous bloom strategy due to their ability to activate at lower light thresholds, which confers a growth head start over other competitor species such as diatoms (Imai et al. Reference Imai, Itakura, Yamaguchi, Honjo, Yasumoto, Oshima and Fukuyo1996). They tend to be small (8–12 µm) and surrounded by a mucilaginous substance (Imai et al. Reference Imai, Itakura and Itoh1993). They also require a mandatory dormancy period of at least two weeks before activation is possible (Itakura et al. Reference Itakura, Nagasaki, Yamaguchi and Imai1996). Apart from cysts, H. akashiwo also forms “resting cells” which do not require a period of dormancy before activation (Han et al. Reference Han, Kim and Cattolico2002). Resting cells are immobile but retain both flagella (Han et al. Reference Han, Kim and Cattolico2002). They form at low temperatures of <10–15°C in the dark and can be activated at warmer temperatures >12°C (Han et al. Reference Han, Kim and Cattolico2002, Tobin et al. Reference Tobin, Grunbaum, Patterson and Cattolico2013). Cysts have similar responses, with activation rates markedly increasing at >15°C, and germinated cysts subsequently requiring light to survive (Imai & Itakura Reference Imai and Itakura1999, Shikata et al. Reference Shikata, Nagasoe, Matsubara, Yoshikawa, Yamasaki, Shimasaki, Oshima, Jenkinson and Honjo2008). Resting cells and cysts are therefore primarily regulated by light and temperature (Itakura et al. Reference Itakura, Nagasaki, Yamaguchi and Imai1996, Branco et al. Reference Branco, Menezes, Alves-de-Souza, Domingos, Schramm and Proenca2014), although nutrients may have an indirect role. Under natural conditions, nutrient stresses trigger H. akashiwo cells to sink towards cooler and darker waters (Powers et al. Reference Powers, Creed and Trick2012) which are more suitable conditions for cysts and resting cells. Han et al. (Reference Han, Kim and Cattolico2002) also demonstrated that a reduction in nitrate could speed up the rate of resting cell induction, but that nitrate depletion was not necessary for its formation.
Knowledge about the cyst and resting cell conditions of H. akashiwo have largely derived from temperate strains. Cyst formation and activation patterns coincide well with temperate seasonality. Cold winters are unconducive for growth and create cyst accumulations that can undergo mass excystment during the warmer spring or summer to form blooms (e.g., Rensel Reference Rensel2007, Dursun et al. Reference Dursun, Tas and Koray2016). In contrast, we did not find records of H. akashiwo cysts in the tropics, although blooms of this species are well documented in these waters (i.e., Branco et al. Reference Branco, Menezes, Alves-de-Souza, Domingos, Schramm and Proenca2014, Leong et al. Reference Leong, Lim, Chew, Kok and Teo2015, Kok & Leong Reference Kok and Leong2019). Cysts were also not detected in the water column or the sediment during a year-long study of six H. akashiwo blooms in the tropical waters of Brazil (Branco et al. Reference Branco, Menezes, Alves-de-Souza, Domingos, Schramm and Proenca2014). During this period, temperatures throughout the water column averaged 28°C, although other tropical waters such as in Singapore can exceed 30°C (Leong et al. Reference Leong, Lim, Chew, Kok and Teo2015). Based on studies of temperate strains, tropical temperatures are therefore unlikely to support cyst formation. However, it is unclear how tropical strains may have adapted to such warmer temperatures to cause reoccurring blooms within these waters.
This study sought to understand H. akashiwo bloom dynamics within tropical waters by investigating the responses of a tropical strain to two temperature and light conditions, which are representative of cold winter and warm tropical conditions. We also investigated if these responses were affected by intracellular and extracellular signals and identify a possible mechanism for the proliferation of tropical H. akashiwo blooms.
Methods
Culture conditions
The H. akashiwo cultures used in this study were isolated from the East Johor Straits. The nitrogen and growth physiology of this species were previously described by Kok et al. (Reference Kok, Yeo and Leong2015). Cultures were kept at 25°C temperature and a 12:12 hour light/dark cycle using cool-white fluorescent tubes at an irradiance of 350 μmol m−2 s−1. These conditions were maintained by an environmental growth chamber (Panasonic MLR-352-PE). Cells were acclimated to an f/2 media regime (Guillard & Ryther Reference Guillard and Ryther1962), which was made without silicate and using seawater that had been aged in the dark for at least six months. Cells were maintained at an exponential phase following a semi-continuous culture method described by Kok et al. (Reference Kok, Yeo and Leong2018), with cells inoculated into f/2 medium on Day 7 of growth at an initial density of 100 cells mL−1. Cells were acclimated for at least three weeks prior to the experiment.
Experiment cultures were grown in f/2 medium at a starting concentration of ~100 cells mL−1. Treatment conditions were applied to cells that reached either a stationary or a declining growth phase. Pre-experiments demonstrated that stationary growth occurred on Day 8 at a cell density of 4.86 × 10⁴ ± 9 × 10³ cells mL−1 (s.d.), which reduced to 3.29 × 10⁴ ± 7 × 10³ cells mL−1 (s.d.) on Day 10 during the declining phase. The various treatments were therefore applied either at Day 8 or Day 10 of the cultures.
Cyst formation conditions
The cell cultures used for cyst formation studies were obtained on Day 8, during the stationary growth phase. Three treatments were selected: warm-dark (WD), warm-light (WL), and cold-dark (CD). Warm temperatures were provided by the environmental growth chamber at 25°C. Cold conditions of 5°C were provided by placing the samples into the fridge. Light conditions were at a 12:12 hour light/dark cycle with 350 µmol m−2 s−1 irradiance using cool-white fluorescence, whereas cell culture flasks tested under dark treatments were wrapped in aluminium foil. Cells under the WD treatment at 25°C lysed by the seventh day of incubation; changes in cell density were therefore not monitored for this condition. A cold-light (CL) treatment was excluded because such environments are not representative of the tropics. The WL and CD experiments were carried out with four replicates over a one-month period. For cell density quantification and morphology observations, cultures were gently resuspended before sub-samples were decanted for subsequent processing. Where necessary, cells were immobilised and concentrated by a 2200 g centrifugation for 10 minutes. Cell counts were carried out using either a haemocytometer or a Sedgewick rafter. Sub-samples were counted on the same day they were removed. No chemical preservatives were added due to severe morphological changes which have been observed for H. akashiwo cells. Morphological observations were carried out using microscopy methods to observe any changes in cell shape as has been reported in other studies of the species (e.g., Branco et al. Reference Branco, Menezes, Alves-de-Souza, Domingos, Schramm and Proenca2014, Kim et al. Reference Kim, Park, Wang, Kim, Youn and Han2015).
Nitrate (NO3) concentrations were also measured at four time points throughout the WL experiment on Days 8, 22, 32, and 39. These time points were selected through a pre-experiment of the WL treatment and represent stationary (Day 8), late-decline (Day 22), early-recovery (Day 32), and late-recovery (Day 39) stages. Phosphate (PO4) measurements were also carried out at the end of the experiment on Day 39 to check for nutrient limitation. Nutrient samples were obtained by filtering a subsample of the culture through a 0.22 μm mesh. The filtrate was then stored in the dark at −20°C until analysis. Nutrients were analysed using colorimetric methods following Leong et al. (Reference Leong, Lim, Chew, Kok and Teo2015). Each analysis run required 2.5 mL for NO3 and 10 mL for PO4.
Intracellular and extracellular signals
Two additional experiments were carried out on separate WL cultures after pre-experiments indicated a well-regulated decline and recovery response. These experiments were carried out on Day 10 of the WL cultures, during the declining growth phase. The first condition was a dilution with f/2 media (“media-dilution”). The second condition was dilution with its own filtrate (“filtrate-dilution”). For this filtrate dilution treatment, subsamples of the cultures were passed through a 0.22 μm-mesh filter, and the filtrate was used for dilution. In both cases, cultures were diluted to about 5.5%, at a starting cell density of 2.06 × 10³ ± 400 cells mL−1 (s.d.) which was similar to the density at the end of the declining phase. These experiments were carried out in triplicate and were subjected to the WL conditions of 25°C constant temperature and a 12:12 hour light/dark cycle. Cell density was regularly monitored for two weeks using microscopy methods as described earlier.
Statistical analyses
Exponential growth rates were calculated according to the linear regression of loge-transformed cell density values, following the equation:
 $$\mu = {{lo{g_e}\left( {{N_1}} \right)\; - \;lo{g_e}\left( {{N_0}} \right)} \over {{t_1} - {t_0}}}$$
where μ is the growth rate (day−1); t 1 and t 0 are, respectively, the number of days at the end and the start of the exponential growth phase; and N t refers to the cell density on Day t.
Statistical comparisons were made using a one-way ANOVA with Tukey’s multiple comparisons or an unpaired t-test. The data sets were tested for normality with Shapiro–Wilk test and for homoscedasticity using a Brown–Forsythe test. All figures and statistical analyses were carried out using GraphPad Prism (version 8.2.1) software.
Results
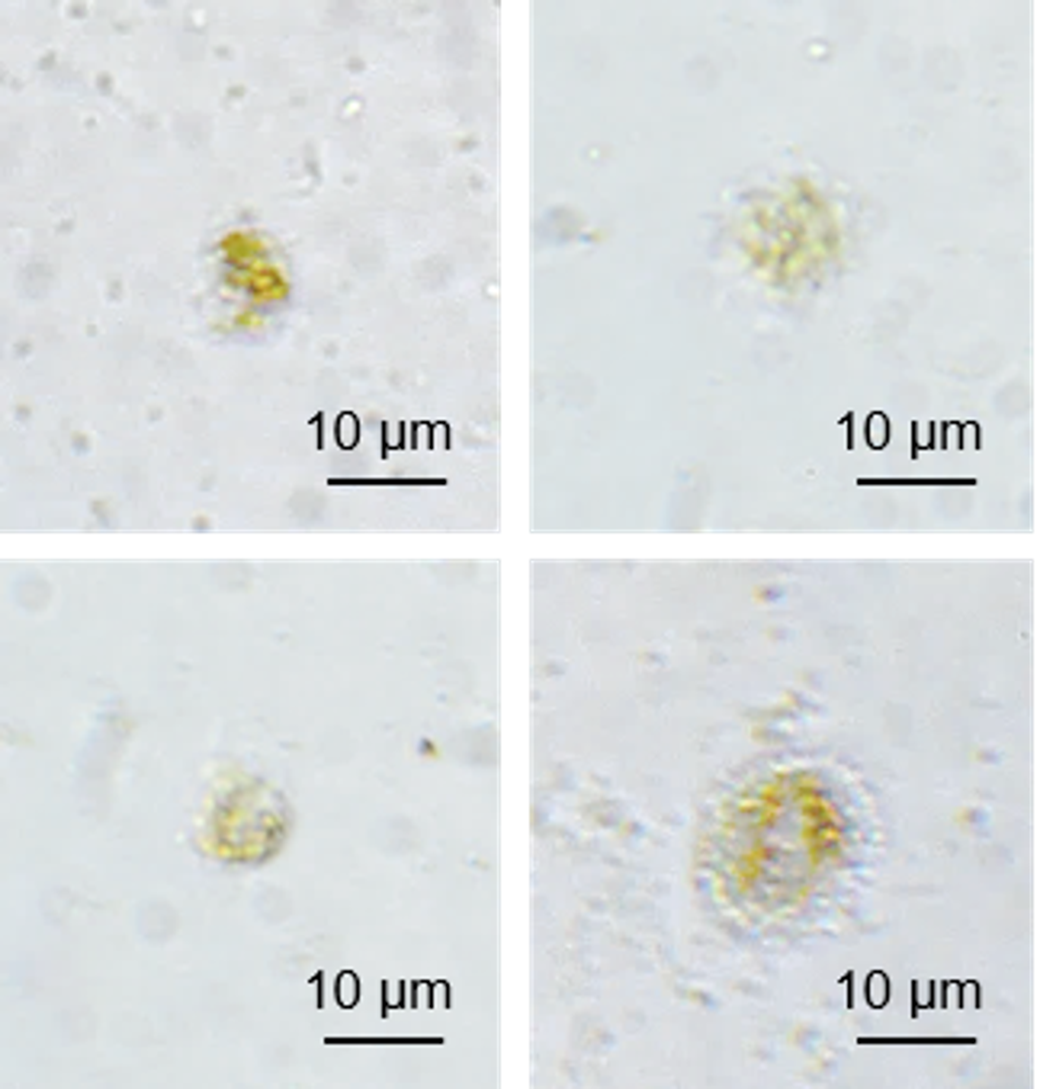
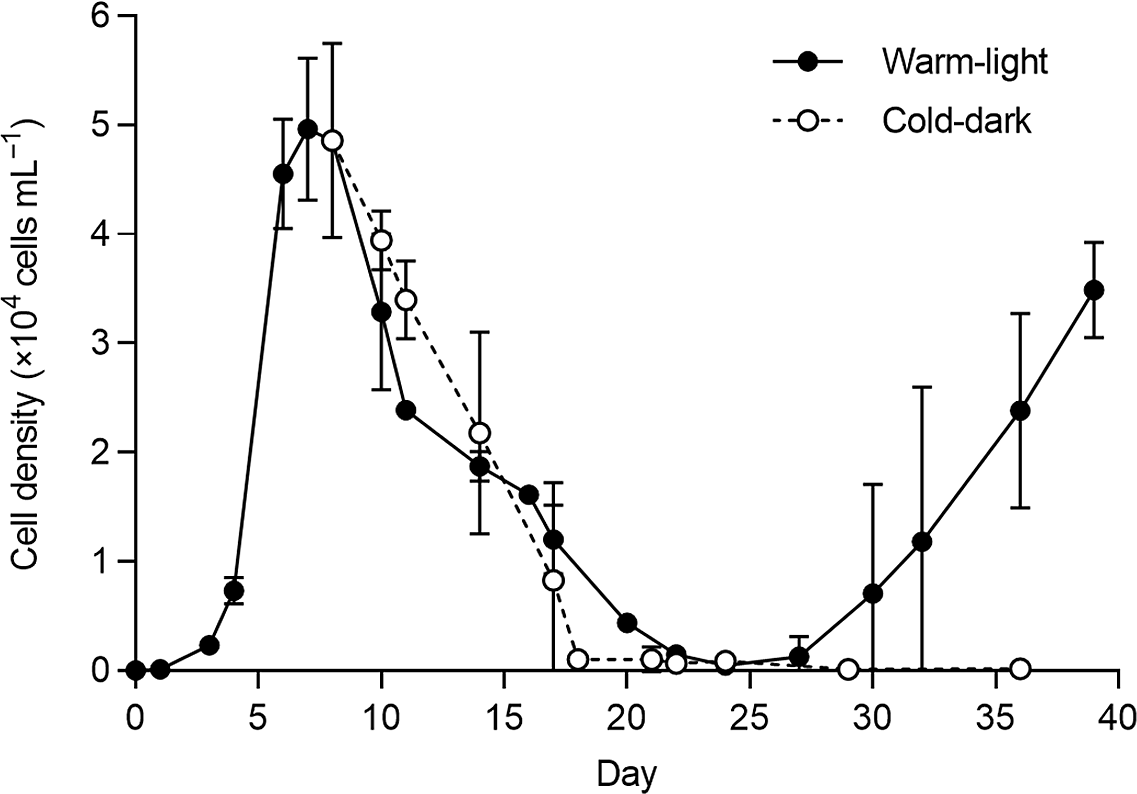
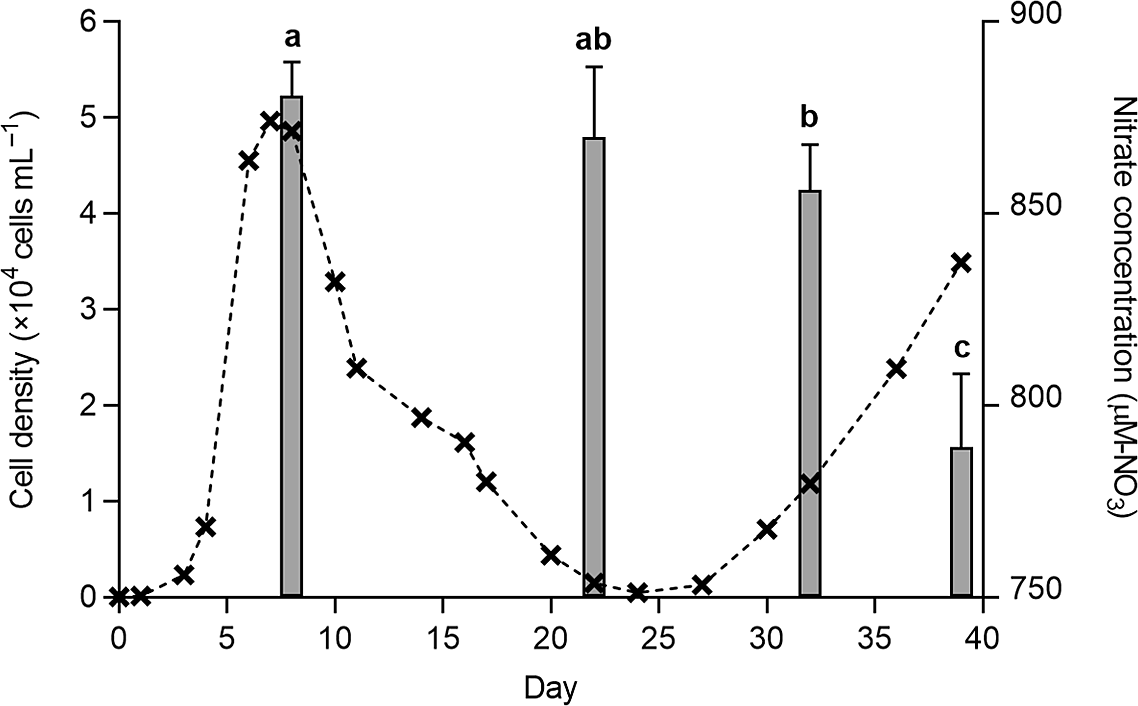
The exponential growth rates of the cultures across Days 0–7 averaged 1.20 ± 0.1 day−1 (s.d.). Stationary cultures incubated under WD conditions were lysed within seven days (Figure 1), but the WL and CD treatments displayed a steady decrease until Days 22–24 (Figure 2). Under the WL treatment, cultures reach a minimum density of 476 ± 100 cells mL−1 (s.d.) on Day 24 (~1.1% of cell densities at stationary phase) and subsequently recovered. For the CD treatment, cell density continued decreasing at a slower rate until maintaining an average density of 132 ± 47 cells mL−1 (s.d.) at Days 29 and 36, at the end of the experiment period. The recovery growth rate under the WL condition was at 0.53 ± 0.05 day−1 (s.d.). Nitrate content was not significantly different between Days 8 and 22, as well as between Days 22 and 32 (P > 0.05, Tukey’s multiple comparisons). Across these three days, the nitrate values averaged 869 ± 15.3 μM-N (s.d.). Nitrate was then reduced to 788 ± 4.6 μM-N (s.d.) at the late-recovery stage on Day 39 (P < 0.05, Tukey’s multiple comparisons) (Figure 3). Phosphate content on Day 39 also averaged 17.4 ± 0.1 μM-P (s.d.).
Representative images showing cell lysis morphology after seven days of incubation in the dark at 25°C, under the WD condition. Scale bar represents 10 µm.

Changes in cell density across Days 0–39 for the warm-light (black) and cold-dark (white) treatments. Both experiments were started on Day 8, during stationary growth phase. Values are means of four replicates. Error bars represent s.d.

Changes in nitrate concentrations (grey bars) for the WL conditions at the four time points—Day 8, 22, 32, 39. Error bars represent s.d. Alphabets represent significance at P < 0.05 (Tukey’s multiple comparisons). Mean cell density values for the WL treatment (black crosses with dotted lines) are also shown for comparison.

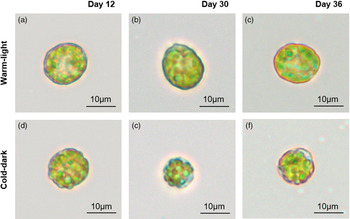
Apart from nutrient and cell density variation, cell morphology also differed under both treatments. Comparatively more ovoid shapes were retained under the WL treatment (Figure 4a–c). For the CD condition, individual pale and round cells were observed by Day 30, which occurred following the decline phase (Figure 4d–f).
Cell photos for the two treatments of (a–c) warm-light and (d–f) cold-dark conditions, taken at three time-points during the incubation period. Scale bar represents 10 µm.

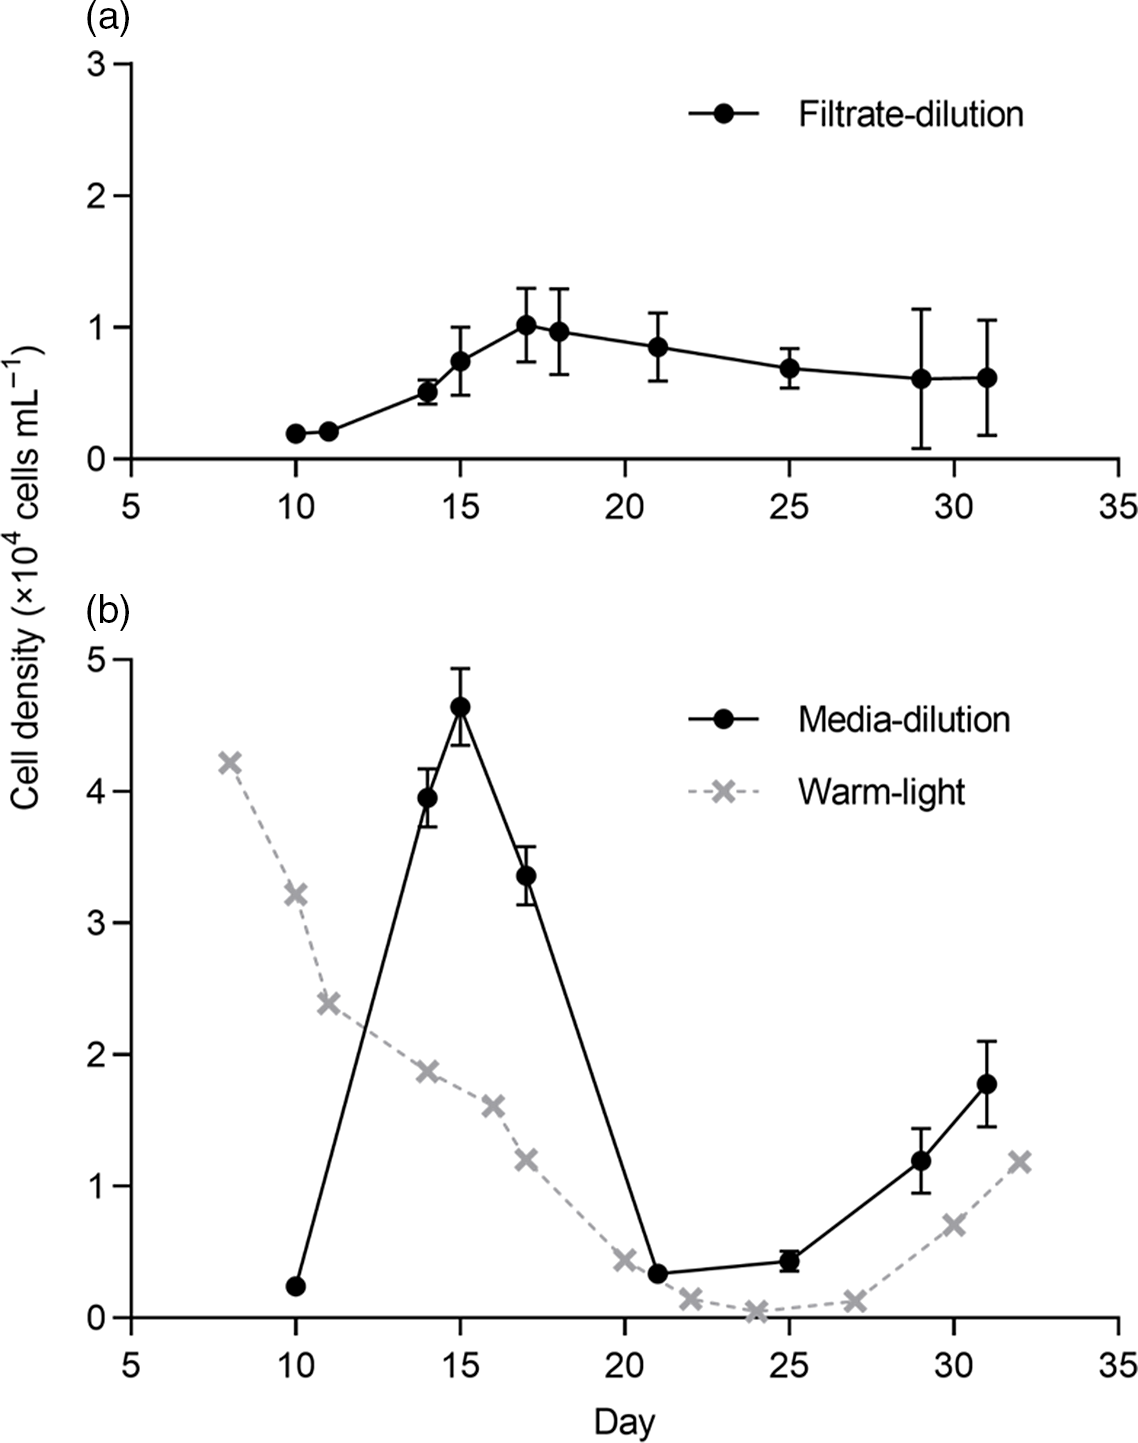
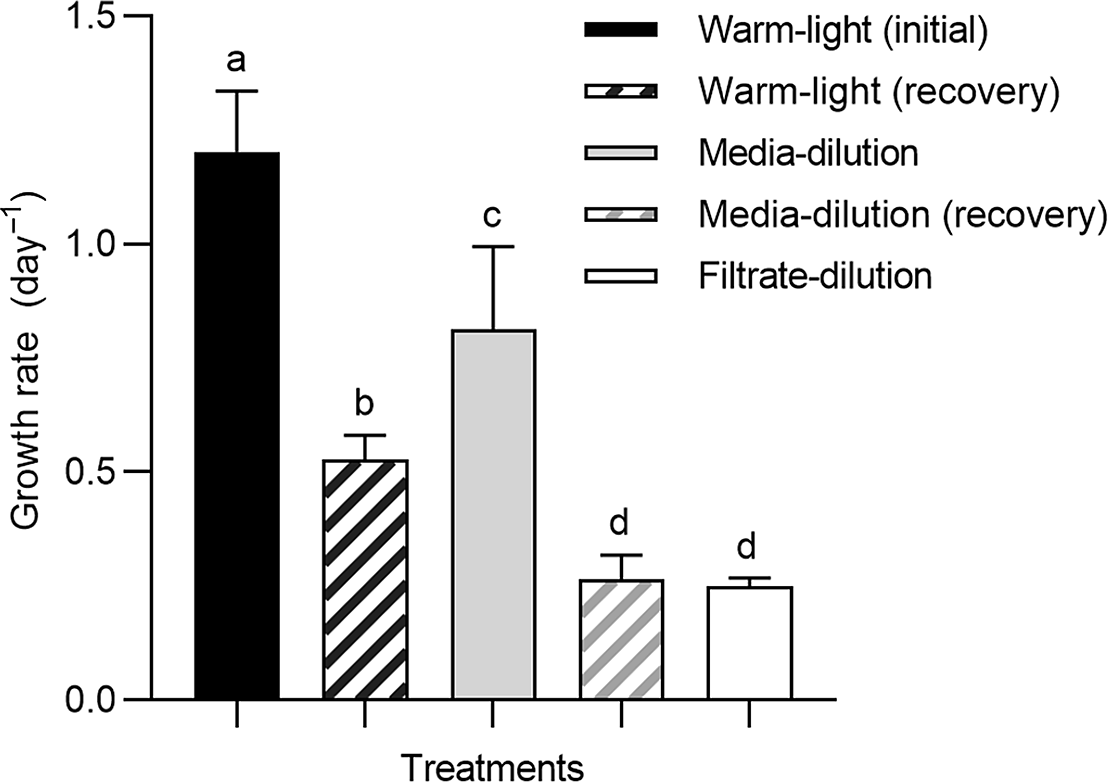
In the experiments to investigate intracellular and extracellular signals, both treatments induced a return to exponential growth. For the filtrate dilution treatment, cultures grew exponentially until Day 17 at a rate of 0.25 ± 0.02 day−1 (s.d.), but this exponential growth was not sustained and was followed by a steady decrease until the end of the experiment period on Day 31 (Figure 5a). Under media dilution, the exponential growth phase lasted for about four days, across Days 10–14 (Figure 5b). The cultures grew at approximately 0.81 ± 0.2 day−1 (s.d.), which was about 67.5% of the growth rates in the initial cultures (P < 0.05; Tukey’s multiple comparisons) (Figure 6). Cells also attained a maximum density of 4.64 × 10⁴ ± 3 × 10³ cells mL−1 (s.d.) on Day 15, which was similar with the Day 8 maximum of the initial cultures (P > 0.05; unpaired t-test). Cell density subsequently decreased to approximately 3.33 × 10³ ± 200 cells mL−1 (s.d.) on Day 21, which was ~7.2% of the Day 15 concentration. This timing coincided with the minimum density of the WL cultures. The media dilution cultures then returned to an exponential growth rate of 0.27 ± 0.05 day−1 (s.d.), which was similar to the growth rate of the filtrate dilution treatments (P > 0.05; Tukey’s multiple comparisons).
Changes in cell density over time for (a) the filtrate dilution and (b) the media dilution treatments. Experiments were started on Day 10, using cells that were in a declining phase. Error bars represent s.d. Media dilution results were compared against mean density values of the WL condition (grey crosses with dotted lines).

Comparison of exponential growth rate values. The WL and media dilution treatments displayed two periods of exponential growth. Alphabets represent significance at P < 0.05 (Tukey’s multiple comparisons). Error bars represent s.d.

Discussion
H. akashiwo has formed HABs in many places around the world. Previous studies have demonstrated a faster maximum growth rate of 1.34 day−1 for tropical H. akashiwo (Kok et al. Reference Kok, Yeo and Leong2015), compared to temperate strains with reported growth rates of 0.89 day−1 (Herndon & Cochlan Reference Herndon and Cochlan2007). However, several records of tropical blooms indicated that H. akashiwo tended to be dominated by Chattonella subsalsa (e.g., Leong et al. Reference Leong, Lim, Chew, Kok and Teo2015, Kok & Leong Reference Kok and Leong2019), which is a slower-growing raphidophyte species that could only attain growth rates of 0.87 day−1 (Kok et al. Reference Kok, Yeo and Leong2018). This study demonstrates that H. akashiwo growth, and therefore bloom patterns, may be regulated by cell signalling patterns. Such mechanisms may prevent prolonged blooms, but subsequent blooms may occur if dispersed cell populations synchronise their recovery of exponential growth. The species therefore poses a bloom threat even if not detected in high densities.
Cyst responses in H. akashiwo are known to be a key driver of blooms within temperate waters. Several laboratory studies have observed the formation of resting cells, which are more temporary forms that do not require a dormancy period (Han et al. Reference Han, Kim and Cattolico2002, Kim et al. Reference Kim, Kim, Wang, Park and Han2016). The conditions that drive cyst formation are less well understood, but similarities between the temperature conditions for cyst germination and resting cell activation indicate possibly similar responses (Itakura et al. Reference Itakura, Nagasaki, Yamaguchi and Imai1996, Branco et al. Reference Branco, Menezes, Alves-de-Souza, Domingos, Schramm and Proenca2014). In this study, the round structures observed under the CD treatment agreed with descriptions for H. akashiwo resting cells (e.g., Kim et al. Reference Kim, Kim, Wang, Park and Han2016). The temperature and light conditions also matched the requirements for resting cell formation, which occurs in the dark at cold temperatures of <10–15°C (Han et al. Reference Han, Kim and Cattolico2002, Tobin et al. Reference Tobin, Grunbaum, Patterson and Cattolico2013). This response was therefore consistent across temperate and tropical H. akashiwo. Amongst closely related raphidophyte species, this temperature requirement is shared by Fibrocapsa japonica, which requires <12°C for cyst formation (De Boer et al. Reference De Boer, Koolmees, Vrieling, Breeman and Van Rijssel2005). However, Chattonella spp. can form cysts at 22–27°C (Nakamura & Umemori Reference Nakamura and Umemori1991, Imai & Yamaguchi Reference Imai and Yamaguchi2012) and have been reported from a tropical mangrove in Indonesia (Nafisyah et al. Reference Nafisyah, Masithah, Matsuoka, Lamid, Alamsjah, Ohara and Koike2018). Apart from temperature and light, replete nutrient conditions used in this study demonstrated that nutrient limitation was not necessary for triggering a decline phase in the cultures and for resting cell formation, which agreed with Han et al. (Reference Han, Kim and Cattolico2002).
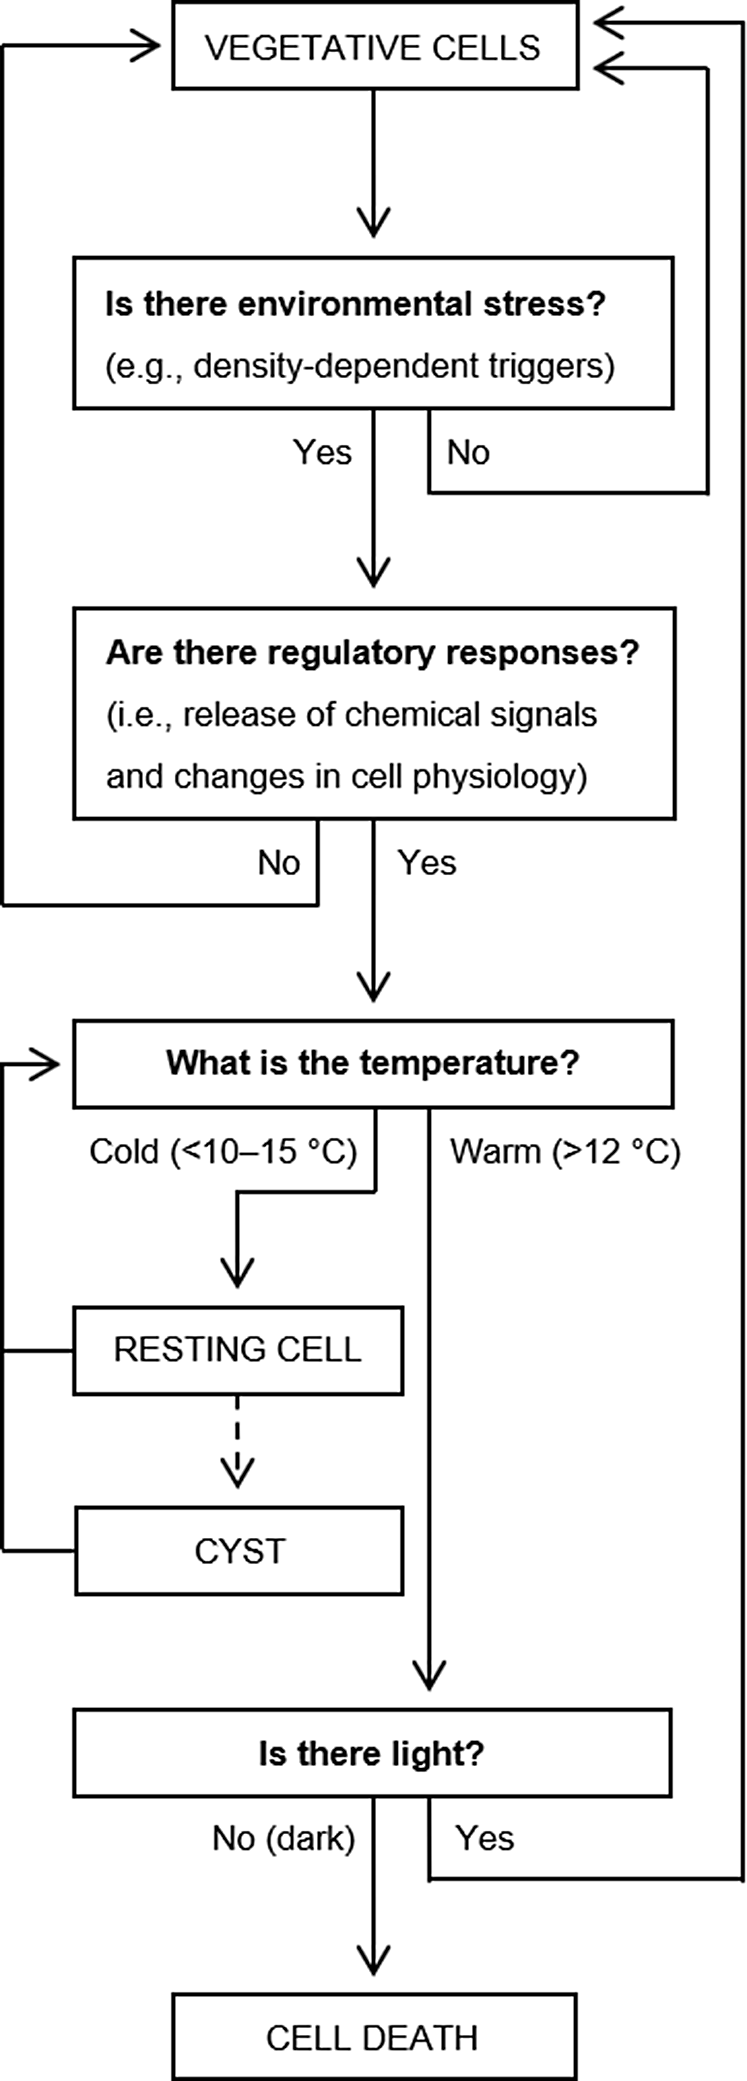
Cell lysis observed under the WD condition agreed with an earlier study by Itakura et al. (Reference Itakura, Nagasaki, Yamaguchi and Imai1996), where vegetative H. akashiwo cells rapidly decreased in cell density within five days of incubation in the dark at 20°C. Although this study did not observe resting cell forms under the WD treatment, studies have highlighted the possibility that incubation at warm temperatures could have induced immediate activation of the resting cells (Imai et al. Reference Imai, Itakura, Yamaguchi, Honjo, Yasumoto, Oshima and Fukuyo1996, Tobin et al. Reference Tobin, Grunbaum, Patterson and Cattolico2013), but dark conditions prevented a full transition to a vegetative state (Shikata et al. Reference Shikata, Nagasoe, Matsubara, Yamasaki, Shimasaki, Oshima and Honjo2007). This study agrees with these findings and contributes towards a broader understanding of the pathways leading to resting cell, vegetative cell, or cell death outcomes in H. akashiwo (Figure 7). In general, resting cells formed at cold temperatures in the dark (i.e., CD conditions). In one study, Tomas (Reference Tomas1978) observed the formation of non-motile resting cells that subsequently aggregated within a gelatinous matrix—which is a cyst characteristic described by Imai et al. (Reference Imai, Itakura and Itoh1993). Resting cells may therefore provide a pre-cursor for cysts, but more study is needed to identify the factors necessary for this transition. Nevertheless, the activation of cysts (Itakura et al. Reference Itakura, Nagasaki, Yamaguchi and Imai1996; Shikata et al. Reference Shikata, Nagasoe, Matsubara, Yamasaki, Shimasaki, Oshima and Honjo2007) and resting cells (Han et al. Reference Han, Kim and Cattolico2002; Tobin et al. Reference Tobin, Grunbaum, Patterson and Cattolico2013) to form vegetative cells are both similar, requiring warmer temperatures coupled with light. Activation conditions provided by WL may also prevent the formation of resting cells. If this requirement can be alleviated, declining cell populations could more rapidly recover to an exponential growth status.
Flowchart summarising the different cell fate pathways for H. akashiwo. The information is taken from results of this experiment, as well as other literature that have been cited in the text. The dashed arrow from “resting cell” to “cyst” indicates a probable process that is not well understood.

In the filtrate dilution cultures, cells grew at a slower growth rate compared to the media dilution treatment. The filtrate used for these treatments was taken from declining-phase WL cultures where phosphate and nitrate were not limiting, suggesting the presence of other factors such as growth-inhibition signals, which may represent self-allelopathy. Allelopathy is known to be important for phytoplankton ecology (e.g., Bidle & Falkowski Reference Bidle and Falkowski2004, Gentien et al. Reference Gentien, Lunven, Lazure, Youenou and Crassous2007). It was initially thought that these chemicals became too diluted in natural waters to be of consequence (i.e., Jonsson et al. Reference Jonsson, Pavia and Toth2009), but dense cell accumulations during a bloom could drive large-scale production of these substances at sufficiently high concentrations to become significant (e.g., Brosnahan et al. Reference Brosnahan, Ralston, Fischer, Solow and Anderson2017, Choi et al. Reference Choi, Brosnahan, Sehein, Anderson and Erdner2017).
In the media dilution treatments, extracellular signals in the culture are diluted and replaced. In the absence of intracellular signals, media dilution would therefore return cells to initial culture conditions (i.e., WL). Observed differences between the media dilution and the WL treatments therefore imply the importance of intracellular factors. Under media dilution, cells returned to an exponential growth rate that was slower than that for the initial cultures. A subsequent decline and recovery coincided with the WL treatment, indicating well-regulated synchronicity so that the recovery period coincided with the control cultures. The decline and recovery patterns under the WL and media dilution treatments occurred at different minimum cell densities, indicating that the subsequent period of exponential growth was not triggered by a concentration threshold. This response may reflect a strategy of partial recovery, which has been previously described for terrestrial plant systems (e.g., Skirycz et al. Reference Skirycz, Claeys, Bodt, Oikawa, Shinoda, Andriankaja, Maleux, Eloy, Coppens, Yoo, Saito and Inze2011). When conducive growth conditions are suddenly available, tropical H. akashiwo cells therefore do not fully recover its exponential growth rates but retain signals that allow for synchronised recovery. Broadly, this behaviour may increase blooms through mass recovery of different cell populations, which can overwhelm resource competitors and predators—a process similar with and more widely known as predator satiation (e.g., Flynn & Mitra Reference Flynn and Mitra2016, Espelta et al. Reference Espelta, Arias-LeClaire, Fernandez-Martinez, Doblas-Miranda, Munoz and Bonal2017). Coastal waters frequently experience rapidly changing environments through dynamic weather and pollution regimes, including eutrophication (e.g., Leles et al. Reference Leles, Souza, Faria, Ramos, Fernandes and Moser2014, Leong et al. Reference Leong, Lim, Chew, Kok and Teo2015). Well-regulated recovery responses would allow different H. akashiwo populations to grow in synchrony and to form blooms within such waters, highlighting a novel strategy that was not previously reported for this species.
Conclusion
Bloom occurrences are often attributed to a combination between cell division rates and the initial seed stock that is available in the environment (e.g., Trombetta et al. Reference Trombetta, Vidussi, Mas, Parin, Simier and Mostajir2019). For H. akashiwo, tropical strains are known to have faster growth rates than its temperate counterpart (Kok et al. Reference Kok, Yeo and Leong2015). However, this has not resulted in H. akashiwo being frequently dominant within tropical waters, with deleterious outcomes instead being more typical of temperate blooms (Kok et al. Reference Kok, Yeo and Leong2015, Engesmo et al. Reference Engesmo, Eikrem, Seoane, Smith, Edvardsen, Horgaard and Tomas2016). Tropical H. akashiwo has nevertheless been shown to have declined and recovery strategies that could gradually lead to an accumulation of latent seed stock, creating increasingly suitable conditions for sudden and massive bloom events. Although tropical blooms of H. akashiwo presently appear relatively benign, this study demonstrates that they may cause more frequent and severe HABs in future. Monitoring especially during nonbloom periods would be important for observing changes in the distribution and accumulation patterns of H. akashiwo, allowing more accurate assessments of the threat posed by such species to tropical waters.
Acknowledgements
We would like to thank A/P Darren Yeo Chong Jinn for his guidance and feedback during this study. The St. John’s Island National Marine Laboratory (SJINML) also provided the facility for conducting the research. SJINML is a National Research Infrastructure under the National Research Foundation Singapore.
Financial support
This work was supported by funds awarded to Dr Sandric Leong through TMSI, NUS.
Conflict of interest
None.