Introduction
Strip-tillage (ST) systems minimize crop yield loss risks associated with cold, wet soils typically associated with no-tillage (NT) systems, while greatly reducing soil erosion compared with intensive-tillage production systems (Hendrix et al. Reference Hendrix, Young and Chong2004; Lauer Reference Lauer2016; Wolkowski et al. Reference Wolkowski, Cox and Leverich2009). ST creates a narrow strip for planting in which soil temperature in the planting zone is greater and soil moisture is less than in NT systems, but similar to those in intensive-tillage systems. ST systems also maintain previous crop residue between the tilled strips for soil protection from water and wind erosion, supporting an important ecosystem service. Recent research in Wisconsin (Lauer Reference Lauer2016) showed that corn (Zea mays L.) yields in most ST systems were greater than in NT systems and did not differ from yields in intensive-tillage systems over 8 yr. The results indicate that ST can overcome cool, wet soils in the spring and has the potential to protect soil from erosion with little impact on corn grain yield compared with intensive tillage. Together with NT soybean [Glycine max (L.) Merr.] production, ST corn production provides a high-residue, conservation-tillage cropping system that is of interest to many growers (Wolkowski et al. Reference Wolkowski, Cox and Leverich2009).
In contrast to these well-documented benefits, we have little information on weed community composition and suppression in ST corn production systems in the northern Corn Belt. Previous research in southern Illinois found that weed emergence patterns, total weed emergence, and corn yield were inconsistent between years among conventional-tillage, ST, and NT systems (Hendrix et al. Reference Hendrix, Young and Chong2004). The authors attributed inconsistencies in weed emergence patterns to differences in soil moisture and temperature between years; differences in soil bulk densities between years may have also been a contributing factor. Weed community dynamics in ST systems are likely complex due to heterogeneous microenvironments across tilled strips, nondisturbed soil between strips, and crop residue on the soil surface between strips (Brainard et al. Reference Brainard, Peachey, Haramoto, Luna and Rangarajan2013). Although weed community dynamics in NT and intensive-tillage systems may explain dynamics in ST systems, interactions across diverse microenvironments in ST systems should be considered (Brainard et al. Reference Brainard, Peachey, Haramoto, Luna and Rangarajan2013; Fernández and White Reference Fernández and White2012; Fernández et al. Reference Fernández, Sorenson and Villamil2015).
Environmental differences between ST in-row (IR) and between-row (BR) zones may influence weed emergence and community composition. Soil moisture retention in both IR and BR zones of ST systems can be greater than in intensive-tillage systems due to surface crop residue in the BR zone (Hendrix et al. Reference Hendrix, Young and Chong2004), which may act as a reservoir for the IR zone (Haramoto and Brainard Reference Haramoto and Brainard2012). Surface crop residues may also change other abiotic factors such as light penetration, physical obstruction, soil temperature, and soil chemical properties (Haramoto and Brainard Reference Haramoto and Brainard2017). On a silty clay loam soil in Illinois, Fernández and White (Reference Fernández and White2012) determined that corn yield in ST was 7.8% greater than the yield under NT management over a 4-yr period. They observed improved nutrient uptake and corn root characteristics under ST, and hypothesized that ST creates a less stressful soil environment compared with NT. Their subsequent research (Fernández et al. Reference Fernández, Sorenson and Villamil2015) found increased soil organic matter content, decreased bulk density, and decreased penetration resistance in ST compared with NT. They found no differences or inconsistent responses in water aggregate stability and infiltration rates between tillage systems and suggested that additional years were likely needed to determine whether these soil properties can be influenced by ST and NT systems.
Weed community composition and densities in ST systems may also be affected by the vertical distribution of seeds in IR and BR zones as a function of burial depth by tillage or lack of tillage, respectively. Winter annuals, biennials, and perennials are typically associated with NT systems because of their affinity for nondisturbed soil environments (Buhler Reference Buhler1995; Buhler et al. Reference Buhler, Stoltenberg, Becker and Gunsolus1994). These species are typically well established at the time of ST operations in fall or spring (Brainard et al. Reference Brainard, Peachey, Haramoto, Luna and Rangarajan2013). Moreover, the vertical distribution of viable weed seeds in the soil profile is shallower in NT systems than in intensive-tillage systems (Cardina et al. Reference Cardina, Regnier and Harrison1991, Reference Cardina, Herms and Doohan2002; Mulugeta and Stoltenberg Reference Mulugeta and Stoltenberg1997b). Weed seeds remaining at or near the surface are more susceptible to predation and disease, which may lower densities and deplete the seedbank over time (Murphy et al. Reference Murphy, Clements, Belaoussoff, Kevan and Swanton2006; Swanton et al. Reference Swanton, Booth, Chandler, Clements and Shrestha2006). Such conditions may contribute to changes in weed community composition over time in ST systems that are reflective of long-term NT systems. This could include more small-seeded, annual broadleaf and grass species (Buhler Reference Buhler1995; Buhler and Daniel Reference Buhler and Daniel1988; Cardina et al. Reference Cardina, Regnier and Harrison1991), wind-dispersed species (Buhler Reference Buhler1995), and increases in weed community richness and diversity (Cardina et al. Reference Cardina, Regnier and Harrison1991; Mulugeta et al. Reference Mulugeta, Stoltenberg and Boerboom2001). Recent research by Haramoto and Brainard (Reference Haramoto and Brainard2017) found that differences in emergence of Powell amaranth (Amaranthus powellii S. Watson) between ST and full-width tillage systems were most pronounced in the BR zone, but also occurred in the IR zone in some cases. However, the authors concluded that the effects of ST on A. powellii were inconsistent, both temporally and spatially. Weed community characteristics could potentially be affected further if IR and BR zones remain in a consistent location or vary in location over years (Brainard et al. Reference Brainard, Peachey, Haramoto, Luna and Rangarajan2013). If strips are in the same location, a greater proportion of weed seeds may remain on the soil surface, causing a change in weed communities in BR zones toward those observed under NT systems.
Our understanding of weed community dynamics and suppression in ST systems is limited, particularly in long-term, well-established systems. We lack information to complement grower interest in ST corn production as an alternative to NT approaches in the northern Corn Belt. Therefore, we conducted research to characterize weed community composition, emergence patterns, and aboveground productivity in an established conservation ST corn/NT soybean rotation compared with an intensive-tillage (chisel-plow, CP) continuous-corn system. Our hypothesis was that weed community composition, densities, and productivity in ST corn/NT soybean system pose no greater production risks than those in the intensive-tillage CP corn system.
Materials and Methods
Field Site and Experimental Design
Experiments were conducted in 2015 and 2016 within the Wisconsin Integrated Cropping Systems Trial (WICST) at the University of Wisconsin–Madison Arlington Agricultural Research Station (43.3°N, 89.35°W) near Arlington, WI, on a deep, well-drained Plano silt loam (Fine-silty, mixed, superactive, mesic Typic Argiudolls). The trial was established in 1989 and has been an active research site since that time (Posner et al. Reference Posner, Casler and Baldock1995; WICST 2017). Plot size is 18-m wide by 156-m long (0.3 ha). The experimental design is a randomized complete block with four replications of three cash-grain systems and three dairy-forage systems. These systems have been designed to be representative of on-farm systems and practices. Consequently, crop species, cropping sequence, and soil, nutrient, and pest management practices vary among systems and have been adapted over time. Each block contains one replication of each phase of each cropping system every year. Research described here was conducted in the two conventionally managed cash-grain systems: (1) continuous corn and 2) corn/soybean rotation.
Field Procedures
Continuous-Corn System
Primary tillage consists of one pass with a disk chisel in the fall followed by one or two passes with a field cultivator in the spring before planting. Since 2007, nitrogen has been applied in the spring, typically in the form of anhydrous ammonia (82-0-0, N-P2O5-K2O) at a rate determined by the Wisconsin preplant (PP) soil nitrate test (Laboski and Peters Reference Laboski and Peters2012), followed by starter fertilizer (5-14-42) applied at planting. In 2015, anhydrous ammonia was applied at 185 kg N ha−1 on April 27, and starter fertilizer was applied at 112 kg ha−1 on May 1. In 2016, starter fertilizer was applied as above on May 3, followed by urea ammonium nitrate (28-0-0) applied side-dress at 205 kg N ha−1 on June 17. The change to urea ammonium nitrate from anhydrous ammonia in 2016 (and subsequent years) was made in response to changes in grower nitrogen management practices and to reduce the potential for early-season nitrate-leaching losses.
Also since 2007, herbicide- and insect-resistant corn hybrids have been planted at a rate of 84,900 seeds ha−1 in a row spacing of 76 cm. Glyphosate-resistant corn hybrids ‘Pioneer PO157AMX’ (Pioneer Hi-Bred International, Johnston, IA) and ‘Pioneer PO339AMXT’ were planted on May 1, 2015, and May 3, 2016, respectively.
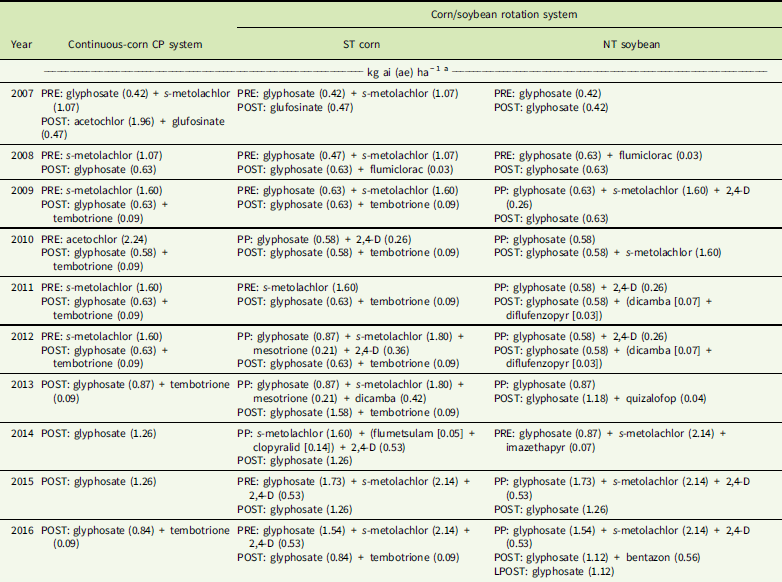
The approach to weed management in the continuous-corn system was a two-pass herbicide program (PRE- followed by POST-applied herbicides) from 2007 to 2012 (Table 1). Since 2013, a one-pass program has been followed in which herbicides have been applied POST only. In 2015, glyphosate (Roundup PowerMax®, Monsanto, St Louis, MO) at 1.26 kg ae ha−1 plus a water conditioner plus drift-control adjuvant (FS Transform PlusTM, Growmark, Bloomington, IL) at 0.3% v/v were applied POST. In 2016, a mixture of glyphosate (Durango® DMA®, Dow AgroSciences, Indianapolis, IN), tembotrione (Laudis®, Bayer CropScience, Research Triangle Park, NC), crop oil concentrate, and urea ammonium nitrate (28-0-0) at 0.84 kg ae ha−1, 0.09 kg ai ha−1, 1.0% v/v, and 3.5 L ha−1, respectively, were applied POST.
Herbicide programs in chisel-plow (CP) continuous-corn and strip-tillage (ST) corn/no-tillage (NT) soybean rotation systems in the Wisconsin Integrated Cropping Systems Trial from 2007 to 2016.

a kg ai ha−1 for acetochlor, bentazon, diflufenzopyr, flumetsulam, flumiclorac, glufosinate, mesotrione, quizalofop, and s-metolachlor; kg ae ha−1 for clopyralid, dicamba, 2,4-D, glyphosate, imazethapyr, and tembotrione; herbicide treatments included recommended adjuvants and additives. Application timings: PP, preplant (burndown); PRE, preemergence; POST, postemergence; LPOST, late postemergence.
Corn/Soybean Rotation
The rotation has two entry points such that both the corn phase and the soybean phase are included in each year. From 1995 to 2006, the primary tillage system was NT for both the corn and soybean phases. In 2007, the NT corn phase was changed to ST. Consequently, 2015 and 2016 represent the 9th and 10th years, respectively, of the ST corn phase. ST operations were conducted in the spring of 2007 and 2008, but since that time have been conducted in the fall. In 2015 and 2016, ST (Blu-Jet®, Thurston Manufacturing, Thurston, NE) was conducted in November after soybean harvest; tilled strips were 15-cm deep and 0.3-m wide (centered on a 76-cm row spacing) and maintained in the same location over years.
In the ST corn phase, nitrogen has typically been applied side-dress in the form of urea ammonium nitrate (as described earlier). In 2015 and 2016, urea ammonium nitrate at 151 kg N ha−1 was side-dressed on June 30 and June 17, respectively. Starter fertilizer was applied in each year as described earlier. Due to low soil-test levels, diammonium phosphate (18-46-0) at 67 kg ha−1 was applied in mid-April of 2015 and 2016, as was potassium chloride (0-0-60) at 84 and 67 kg ha−1 in 2015 and 2016, respectively. Corn hybrids, planting dates, and seeding rates were as described earlier for the continuous-corn system.
From 2007 to 2016, the approach to weed management in the ST corn phase of the rotation has been a two-pass program consisting of herbicides applied PP or PRE followed by POST-applied herbicides (Table 1). In 2015, glyphosate (Roundup PowerMax®, Monsanto), s-metolachlor (Medal® II EC, Syngenta, Greensboro, NC), 2,4-D (Radar™ LV, Growmark), and a water conditioner plus drift-control adjuvant (as described earlier) at 1.74 kg ae ha−1, 2.14 kg ai ha−1, 0.53 kg ae ha−1, and 0.6% v/v, respectively, were applied PRE followed by glyphosate (Durango® DMA®, Dow AgroSciences) at 1.26 kg ae ha−1 plus a water conditioner plus drift-control adjuvant at 0.3% v/v applied POST. In 2016, glyphosate, s-metolachlor, 2,4-D, and a water conditioner plus drift-control adjuvant at 1.54 kg ae ha−1, 2.14 kg ai ha−1, 0.53 kg ai ha−1, and 0.2% v/v, respectively, were applied PRE followed by glyphosate, tembotrione, crop oil concentrate, and urea ammonium nitrate at 0.84 kg ae ha−1, 0.09 kg ai ha−1, 1.0% v/v , and 3.5 L ha−1, respectively, applied POST.
In the NT soybean phase, glyphosate-resistant soybean varieties have been planted at a rate of 556,000 seeds ha−1 in a 19-cm row spacing since 2007. ‘Renk RS213NR2’ (Renk Seed, Sun Prairie, WI) and ‘Renk RS216NR2’ seed was planted on May 14, 2015, and May 9, 2016, respectively. Potassium chloride at 84 kg ha−1 was applied on April 17, 2015. Diammonium phosphate at 67 kg ha−1 plus potassium chloride at 235 kg ha−1 were applied on April 18, 2016.
As in the ST corn phase, a two-pass program consisting of herbicides applied PP or PRE followed by POST-applied herbicides has been followed in the NT soybean phase (Table 1). In 2015 and 2016, herbicides were applied PP as described earlier for the ST corn phase. The POST timing in 2015 included glyphosate at 1.12 kg ae ha−1 plus ammonium sulfate at 2.2 kg ha−1. In 2016, glyphosate, bentazon (Basagran®, Arysta LifeScience North America, Cary, NC), crop oil concentrate, and a water conditioner plus drift-control adjuvant (as described earlier) at 1.12 kg ae ha−1, 0.56 kg ai ha−1, 0.3% v/v, and 0.2% v/v, respectively, were applied POST.
Data Collection
A 4.6-m-wide by 30.5-m-long nontreated (i.e., herbicides not applied) subplot was established in each plot before herbicide application in each year. Four 1-m2 quadrats were established in the nontreated subplot and also in the treated area of each plot for weekly collection of weed species and density data from the time of emergence to crop canopy closure. Wooden markers were placed adjacent to each weed seedling at the time of counting. Different-colored markers were used to track weed emergence over time. Weed shoot biomass was harvested by hand in mid-August from two randomly selected 1-m2 quadrats in nontreated and treated areas in each subplot. Biomass was separated by species, dried at 21 C until constant mass, and weighed. Daily weather data were measured at a meteorological station located within 1 km of the research site (Arlington University Farm, AR station USC00470308).
In-Row and Between-Row Zones
Four 0.3-m-wide by 0.6-m-long quadrats were established in IR and BR zones of nontreated subplots and treated areas of the ST corn phase. Quadrats in the BR zone were located in non–tire track areas. Weed species and density data were collected over time as described earlier.
Statistical Analysis
Analyses were performed using R statistical language software (R software version 3.3.2, R Foundation for Statistical Computing, Vienna, Austria). All data were subjected to ANOVA and transformed when necessary to meet assumptions. Data were pooled when the treatment by year interaction was not significant at P ≥ 0.05.
Cumulative weed density data from nontreated quadrats were used to calculate species richness (S) by summing the number of species in each sample. These data were also used to determine the Shannon’s diversity index (H′) (Ludwig and Reynolds Reference Ludwig and Reynolds1988; Equation 1):
 $$H'{\equals}{\minus}\mathop \sum\limits_{i{\equals}1}^S \left[ {\left( {{{ni} \over n}} \right)\ln \left( {{{ni} \over n}} \right)} \right]$$
where n i is the number of individuals for the ith of S species in the sample, and n is the total number of individuals in the sample. Shannon’s diversity index has two properties that have made it widely used as a measure of species diversity: (1) H′=0 if there is only one species in the sample, and (2) H′ is maximum only when all S species are represented by the same number of individuals, that is, perfectly even distribution of abundances. To quantify the evenness component of diversity, Pielou’s evenness index (J′) (Ludwig and Reynolds Reference Ludwig and Reynolds1988) was calculated (Equation 2).
 $$J'{\equals}{{H'} \over {{\rm ln}(S)}}$$
The Pielou evenness index expresses H′ relative to the maximum value that H′ can obtain when all of the species in the sample are perfectly even with one individual per species, that is, ln S.
Multivariate ordination by nonmetric multidimensional scaling (NMDS; Clarke Reference Clarke1993) was used to determine similarities in weed community species composition among cropping systems and phases. NMDS is considered the most robust and generally applicable ordination method for community data analysis, because minimal distributional assumptions are made about the data (Clarke Reference Clarke1993; Kenkel et al. Reference Kenkel, Derksen, Thomas and Watson2002). Analyses were conducted using the ‘Vegan’ package in R (Oksanen et al. Reference Oksanen, Blanchet, Friendly, Kindt, Legendre, McGlinn, Minchin, O’Hara, Simpson, Solymos, Stevens, Szoecs and Wagner2017).
Cumulative weed emergence was modeled based on thermal time. Accumulated thermal time, measured in growing degree days (GDD), was calculated according to the mean-minus-base method (Equation 3):
 $${\rm GDD}{\equals}\left[ {\left( {T_{{{\rm max}}} {\plus}T_{{{\rm min}}} } \right)\,\hskip-1pt /\,\hskip-1pt 2} \right]-T_{{{\rm base}}} $$
where T max is the maximum daily temperature, T min is the minimum daily temperature, and T base is the base temperature. GDD were calculated using a base temperature of 10 C and an optimum temperature of 30 C. A logistic growth function was used to describe cumulative weed emergence. The function was fit to data using nls and the self-start logistic function SSlogis in R (Equation 4):
 $$Y{\equals}Asym\hskip-1pt\,/\,\hskip-1pt\left\{ {1{\plus}{\rm exp}\left[ {\left( {xmid-{\rm time}} \right)\,/\,scal} \right]} \right\}$$
where Asym is the upper asymptote, xmid is the location of the inflection point, and scal is a numeric scale parameter relating the approximate distance on the x-axis from 50% to 75% of Asym. Biomass data were subjected to ANOVA, and data were transformed to meet assumptions if needed. Mean separation was determined using a Fisher’s protected LSD test at the 5% significance level.
Results and Discussion
Weed Community Composition
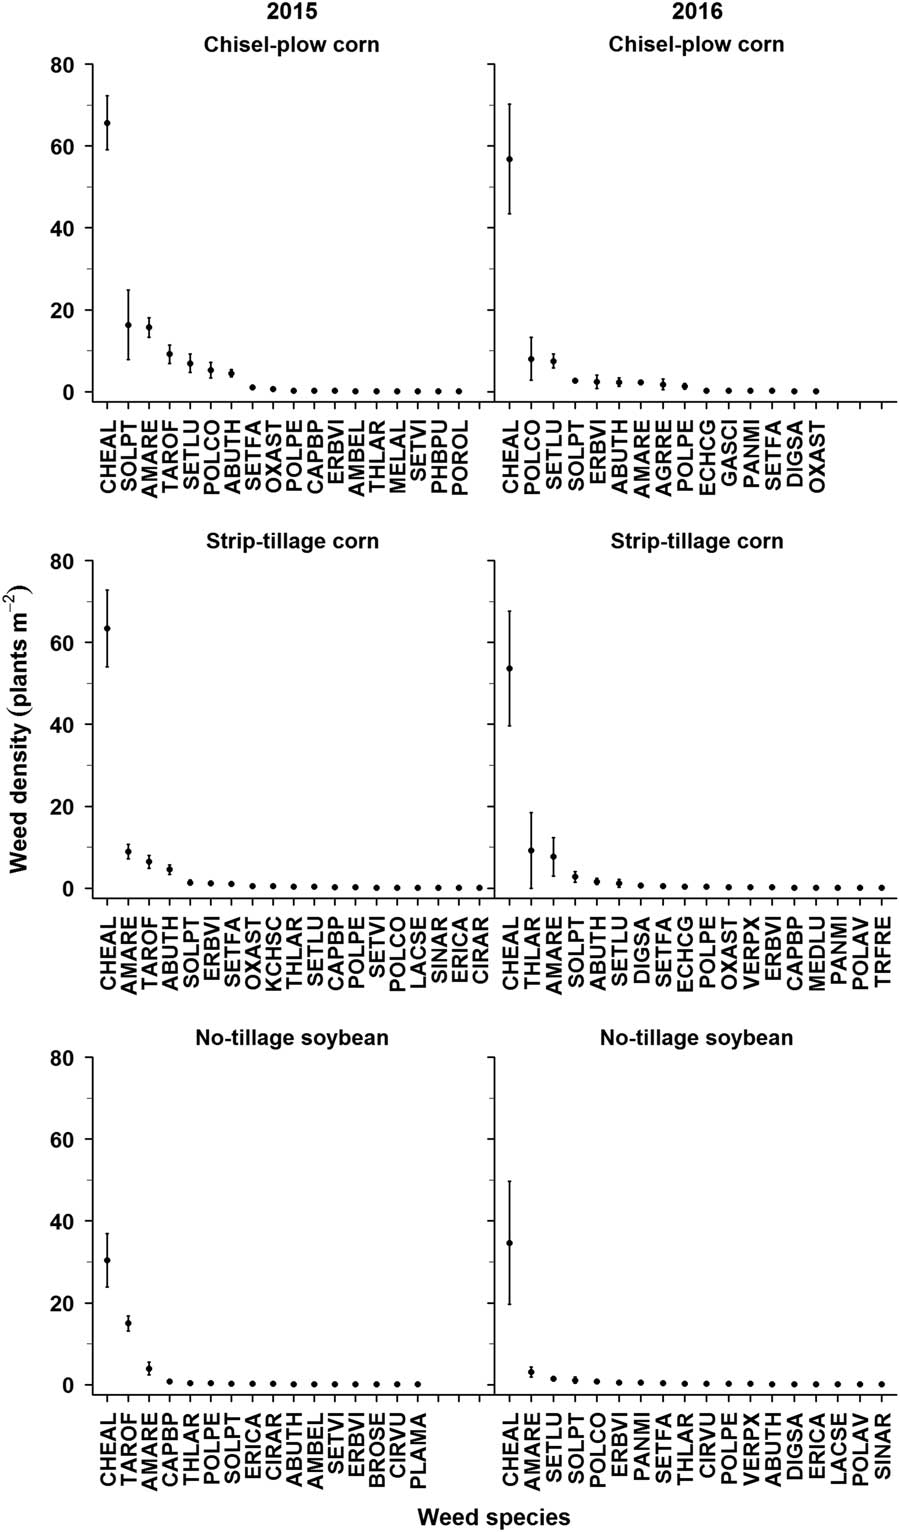
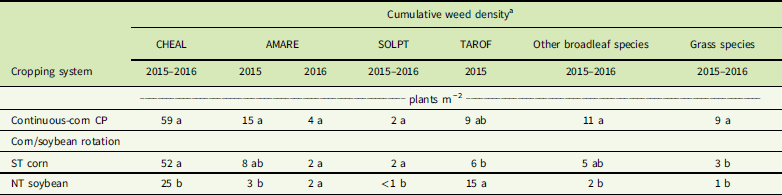
Fifteen or more weed species were identified in nontreated quadrats in each cropping system in each year (Figure 1). Common lambsquarters (Chenopodium album L.) was the most abundant weed species across phases and years. Chenopodium album density was similar between CP and ST corn phases and approximately 2-fold greater than in the NT soybean phase across years (Table 2). Other abundant weed species (mostly summer annuals) occurred at lower densities than C. album. In CP corn, these included eastern black nightshade (Solanum ptychanthum Dunal), redroot pigweed (Amaranthus retroflexus L.), dandelion (Taraxacum officinale F. H. Wigg.), and yellow foxtail [Setaria pumila (Poir.) Roem. & Schult.] in 2015, and wild buckwheat (Fallopia convolvulus (L.) Á. Löve), S. pumila, S. ptychanthum, and barnyardgrass [Echinochloa crus-galli (L.) P. Beauv.] in 2016. In ST corn, the most abundant species other than C. album were A. retroflexus, T. officinale, velvetleaf (Abutilon theophrasti Medik.), and S. ptychanthum in 2015, and field pennycress (Thlaspi arvense L.), A. retroflexus, S. ptychanthum, and A. theophrasti in 2016. Broadleaf weed densities did not differ between CP corn and ST corn, but grass weed densities were greater in CP corn than ST corn (Table 2).
Abundance rankings (mean value ± SE) of weed species based on cumulative density from the time of emergence to crop canopy closure in nontreated chisel-plow continuous-corn and strip-tillage corn/no-tillage soybean systems in 2015 and 2016. Weed species abbreviations: ABUTH, Abutilon theophrasti; AGRRE, quackgrass [Elymus repens (L.) Gould]; AMARE, Amaranthus retroflexus; AMBEL, common ragweed (Ambrosia artemisiifolia L.); BROSE, Bromus secalinus L.; CAPBP, Capsella bursa-pastoris; CHEAL, Chenopodium album; CIRAR, Canada thistle [Cirsium arvense (L.) Scop.]; CIRVU, Cirsium vulgare; CONAR, field bindweed (Convolvulus arvensis L.); DACGL, orchardgrass (Dactylis glomerata L.); DIGSA, Digitaria sanguinalis; ECHCG, Echinochloa crus-galli; ERBVI, woolly cupgrass [Eriochloa villosa (Thunb.) Kunth]; ERICA, Erigeron canadensis; GASCI, hairy galinsoga (Galinsoga quadriradiata Cav.); KCHSC, kochia [Kochia scoparia (L.) Schrad.]; LACSE, Lactuca serriola; MEDLU, black medic (Medicago lupulina L.); MELAL, white campion (Silene latifolia Poir.); OXAST, yellow woodsorrel (Oxalis stricta L.); PANMI, wild-proso millet (Panicum miliaceum L.); PHBPU, tall morningglory [Ipomoea purpurea (L.) Roth]; PLAMA, Plantago major; POLAV, Polygonum aviculare; POLCO, Fallopia convolvulus; POLPE, ladysthumb (Persicaria maculosa Gray); POROL, common purslane (Portulaca oleracea L.); SETFA, Setaria faberi; SETLU, Setaria pumila; SETVI, green foxtail [Setaria viridis (L.) P. Beauv.]; SINAR, Sinapis arvensis; SOLPT, Solanum ptychanthum; SSYOF, hedge mustard [Sisymbrium officinale (L.) Scop.]; TAROF, Taraxacum officinale; THLAR, Thlaspi arvense; TRFRE, white clover (Trifolium repens L.); VERPX, Veronica peregrina ssp. xalapensis.
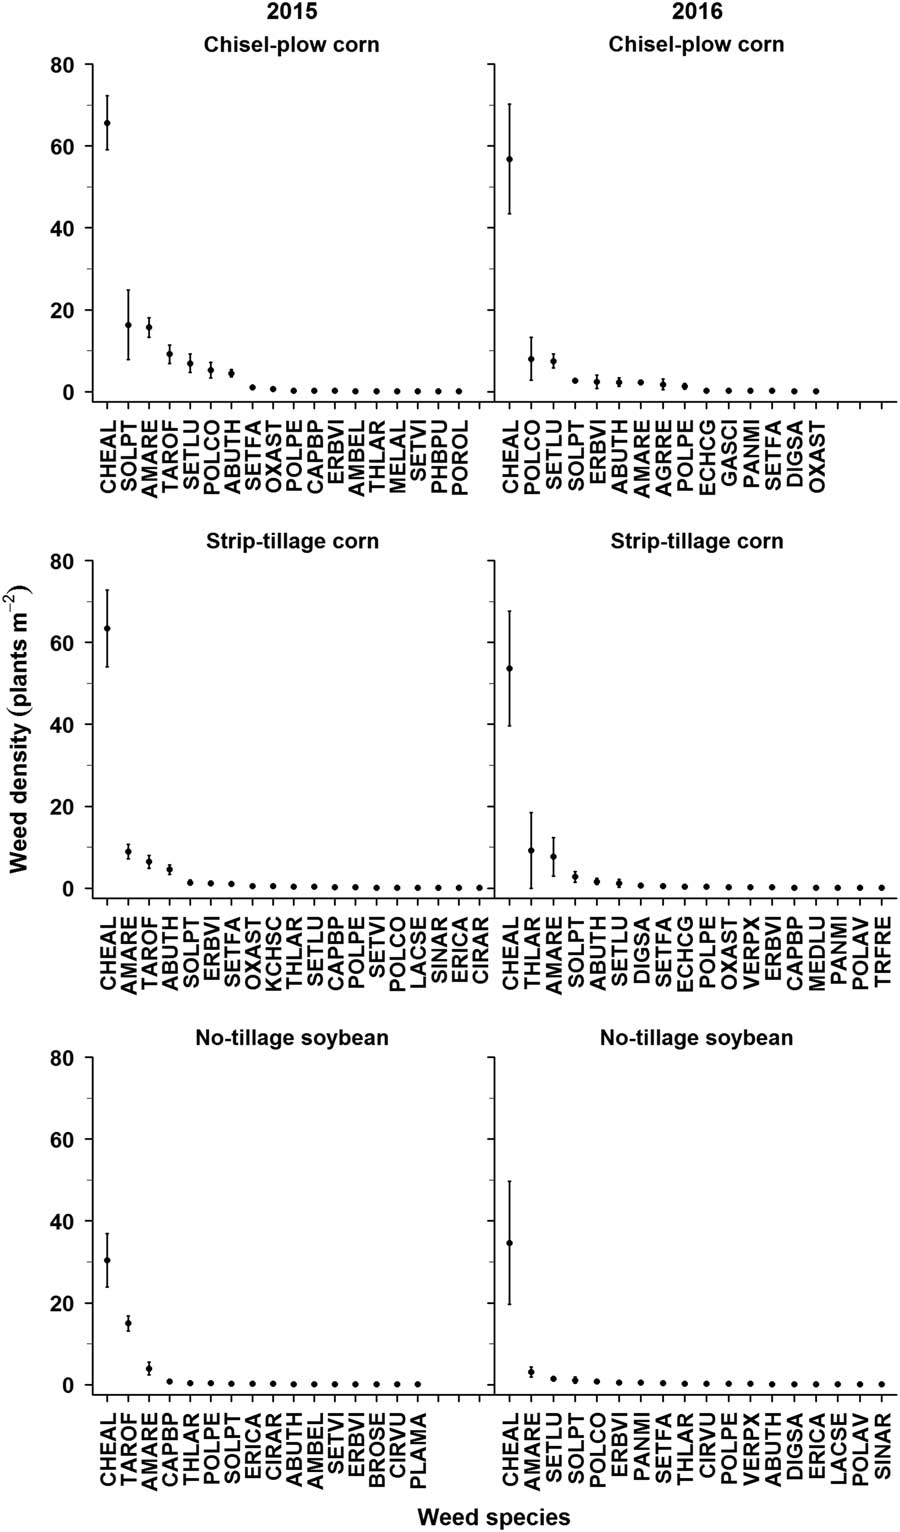
Cumulative weed density in nontreated chisel-plow (CP) continuous-corn and strip-tillage (ST) corn/no-tillage (NT) soybean rotation systems in the Wisconsin Integrated Cropping Systems Trial in 2015 and 2016.

a Data were pooled over years when the year by treatment interaction was not significant at the 0.05 level. Within weed species and year, means followed by the same letter do not differ at the 0.05 level as determined by Fisher’s protected LSD. AMARE, Amaranthus retroflexus; CHEAL, Chenopodium album; SOLPT, Solanum ptychanthum; TAROF, Taraxacum officinale.
In NT soybean, the most abundant species other than C. album were T. officinale, A. retroflexus, shepherd’s-purse [Capsella bursa-pastoris (L.) Medik.], and T. arvense in 2015, and A. retroflexus, S. pumila, S. ptychanthum, and F. convolvulus in 2016 (Figure 1). Amaranthus retroflexus, S. ptychanthum, and other broadleaf and grass weed densities in NT soybean were the same or less than those in ST corn (Table 2). The exception was T. officinale, for which densities were greater in NT soybean than ST corn.
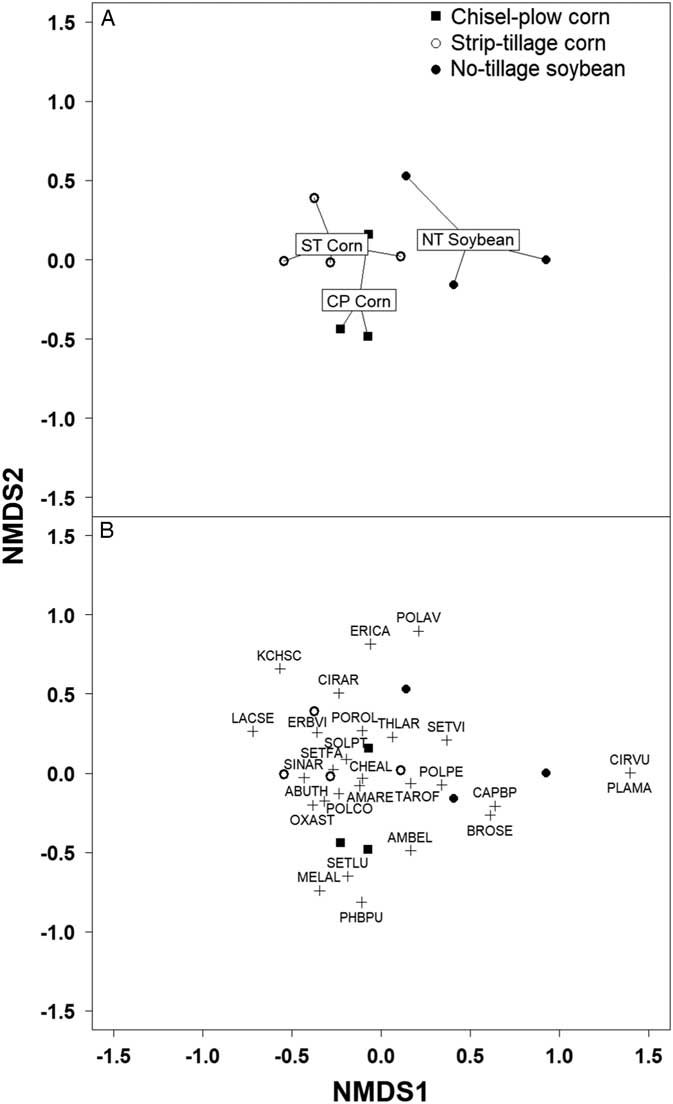
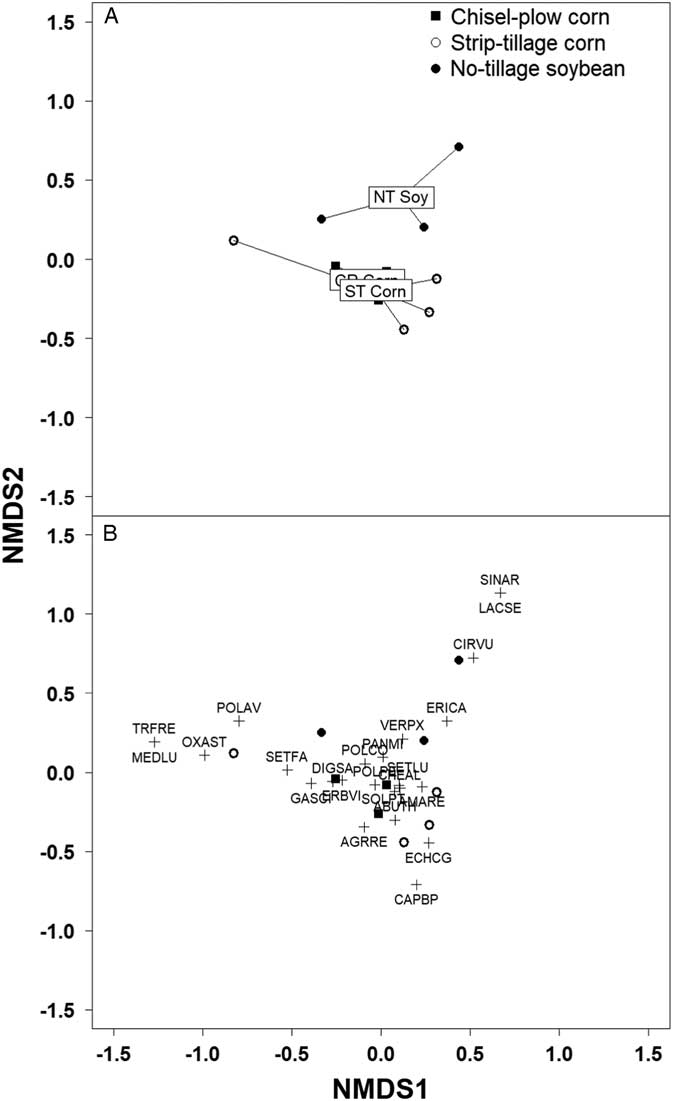
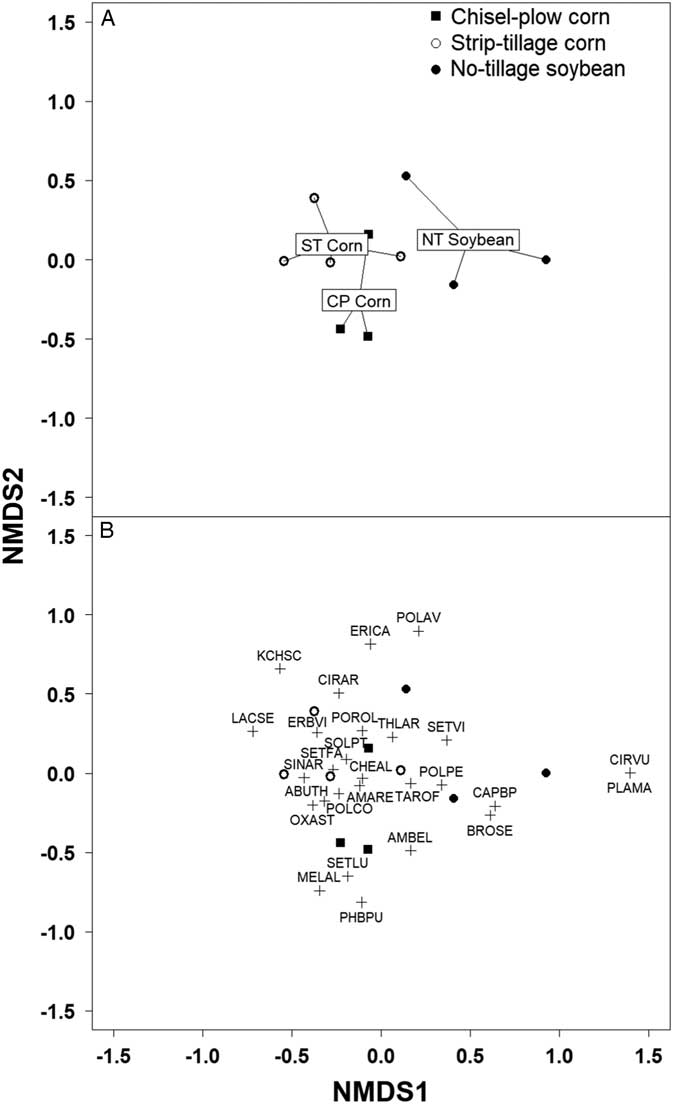
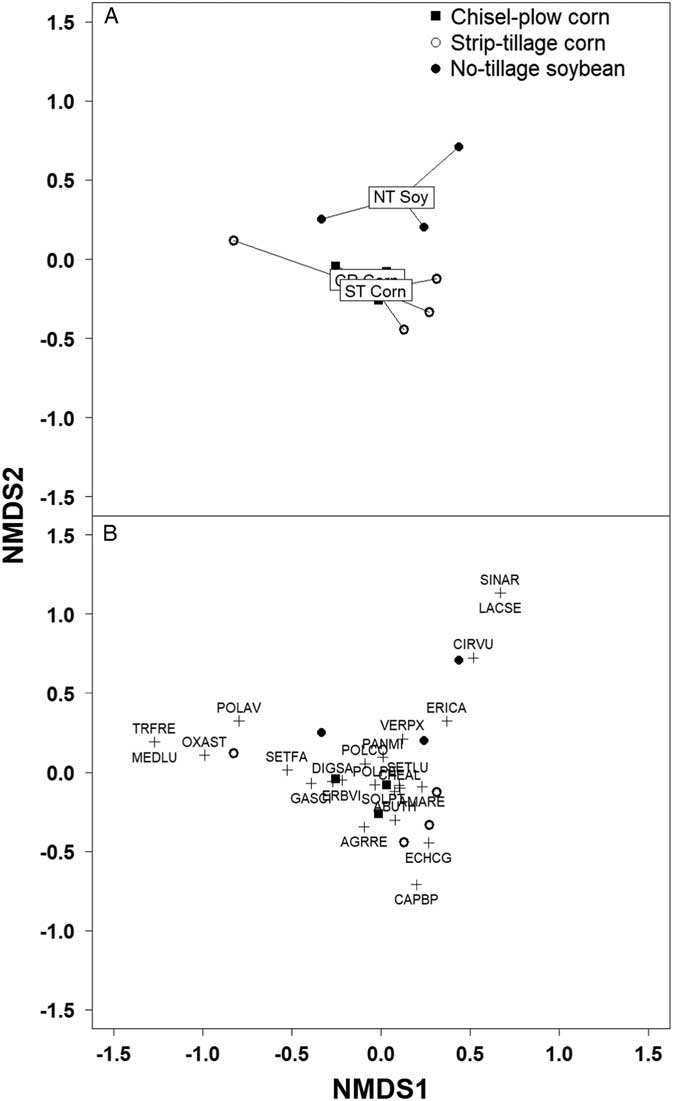
NMDS confirmed that weed communities in CP corn and ST corn were closely associated in both 2015 (Figure 2) and 2016 (Figure 3). In contrast, the weed communities in NT soybean were differentiated from those in the corn phases by the presence of winter annual species [C. bursa-pastoris, horseweed (Erigeron canadensis L.), prickly lettuce (Lactuca serriola L.), and cheat (Bromus secalinus L.)], the biennial species bull thistle [Cirsium vulgare (Savi) Ten.], the perennial species broadleaf plantain (Plantago major L.), and some annual species [prostrate knotweed (Polygonum aviculare L.), wild mustard (Sinapis arvensis L.), and western purslane speedwell [Veronica peregrina L. ssp. xalapensis (Kunth) Pennell]].
Nonmetric multidimensional scaling (NMDS) ordination for 2015 weed plant communities in chisel-plow (CP) continuous-corn and strip-tillage (ST) corn/no-tillage (NT) soybean rotation systems in the Wisconsin Integrated Cropping Systems Trial. Each symbol represents a single plot. (A) Boxed numerical labels correspond to the centroids of each cropping system phase. (B) Bayer codes for the weed species included in ordination analysis. A plus (+) symbol denotes the ordination location for a weed species. Refer to Figure 1 for Bayer code descriptions. Stress=0.13.
Nonmetric multidimensional scaling (NMDS) ordination for 2016 weed plant communities in chisel-plow (CP) continuous-corn and strip-tillage (ST) corn/no-tillage (NT) soybean rotation systems in the Wisconsin Integrated Cropping Systems Trial. Each symbol represents a single plot. (A) Boxed numerical labels correspond to the centroids of each cropping system phase. (B) Bayer codes for the weed species included in ordination analysis. A plus (+) symbol denotes the ordination location for a weed species. Refer to Figure 1 for Bayer code descriptions. Stress=0.13.
The abundance of C. album and other summer annual species across crop and tillage phases (Figure 1) is consistent with results of several previous long-term studies (Cardina et al. Reference Cardina, Herms and Doohan2002; Légère et al. Reference Légère, Stevenson and Ziadi2008; Mulugeta and Stoltenberg Reference Mulugeta and Stoltenberg1997b). Mulugeta and Stoltenberg (Reference Mulugeta and Stoltenberg1997b) identified 17 weed species across NT, CP, and moldboard-plow (MP) systems in both continuous corn and corn/soybean rotation, but C. album, giant foxtail (Setaria faberi Herrm.), and A. retroflexus were most abundant. Subsequent research showed that C. album recruitment was greater in CP than in NT and MP systems and greater in continuous corn than in corn/soybean rotation (Jeschke Reference Jeschke2007). After 35 yr of continuous cropping and tillage system treatments in Ohio, Cardina et al. (Reference Cardina, Herms and Doohan2002) found that the relative importance (an index based on species density and frequency) of C. album, S. faberi, S. pumila, A. retroflexus, large crabgrass [Digitaria sanguinalis (L.) Scop.], and A. theophrasti was high among the weed communities found in NT and CP systems in both continuous corn and corn/soybean rotation.
Taraxacum officinale was an abundant species in our research. In 2015, T. officinale density was greater in NT soybean than in ST corn, which is consistent with previous research indicating greater affinity of perennial weed species for NT than tilled systems (Buhler Reference Buhler1995; Buhler et al. Reference Buhler, Stoltenberg, Becker and Gunsolus1994). However, T. officinale density data were not included in the analysis in 2016 because of high densities of seedling T. officinale that were attributed to border effects (i.e., seed production and movement from grass alleyways) rather than system effects.
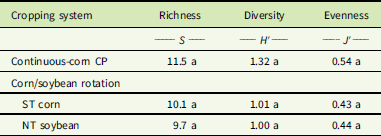
Previous ST weed research has largely focused on emergence and management in short-term experiments in corn (Hendrix et al. Reference Hendrix, Young and Chong2004) and vegetable cropping systems (Brainard and Noyes Reference Brainard and Noyes2012; Haramoto and Brainard Reference Haramoto and Brainard2017). Hendrix et al. (Reference Hendrix, Young and Chong2004) found that tillage effects on S. faberi and waterhemp [Amaranthus tuberculatus (Moq.) J. D. Sauer] emergence were inconsistent between years. However, A. theophrasti emergence was greater in conventional tillage than in NT or ST systems. This result is likely due to A. theophrasti’s affinity for disturbed soil environments and tolerance to burial (Buhler Reference Buhler1995). Haramoto and Brainard (Reference Haramoto and Brainard2017) found that ST effects on A. powellii emergence were temporally and spatially variable over 3 yr. Brainard et al. (Reference Brainard, Peachey, Haramoto, Luna and Rangarajan2013) hypothesized that ST systems may support a greater diversity of weed species than either conventional or NT systems; however, our results indicate that weed species richness, diversity, and evenness did not differ among ST corn, NT soybean, and CP corn (Table 3).
Nontreated weed community species richness, diversity, and evenness in chisel-plow (CP) continuous-corn and strip-tillage (ST) corn/no-tillage (NT) soybean rotation systems in the Wisconsin Integrated Cropping Systems Trial in 2015 and 2016.Footnote a

a Data were pooled over years due to a nonsignificant year by treatment interaction at the 0.05 level. Within parameter, means followed by the same letter do not differ at the 0.05 level as determined by Fisher’s protected LSD.
Cumulative Weed Emergence
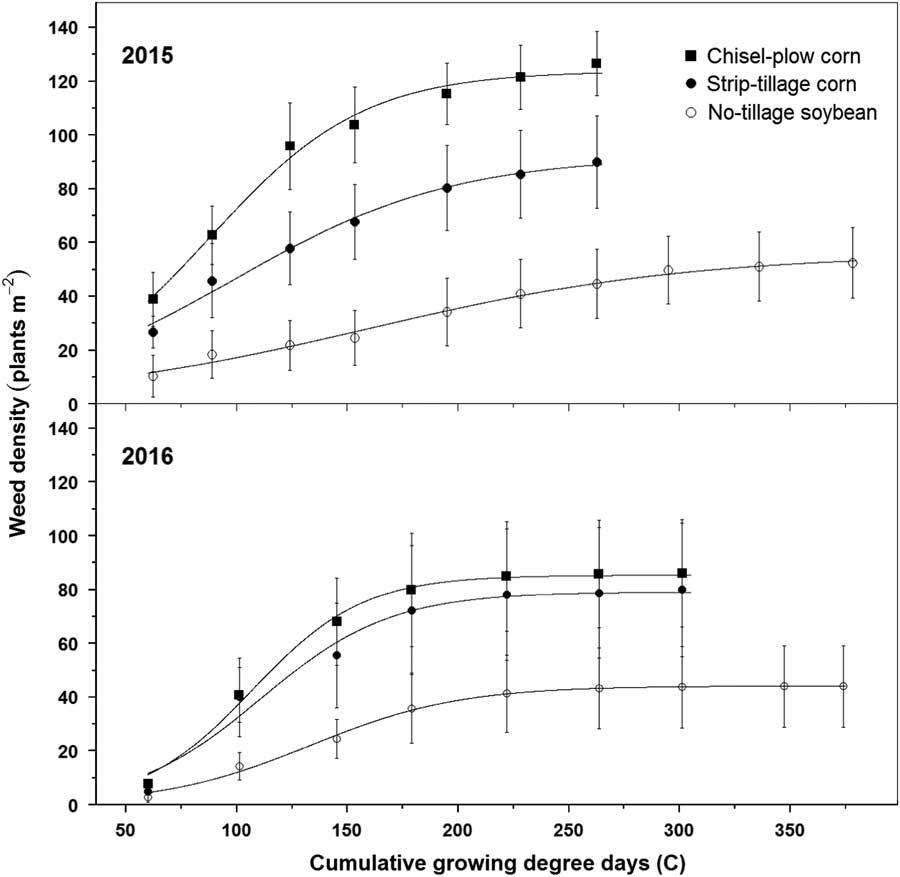
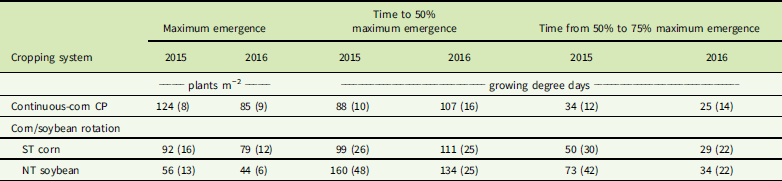
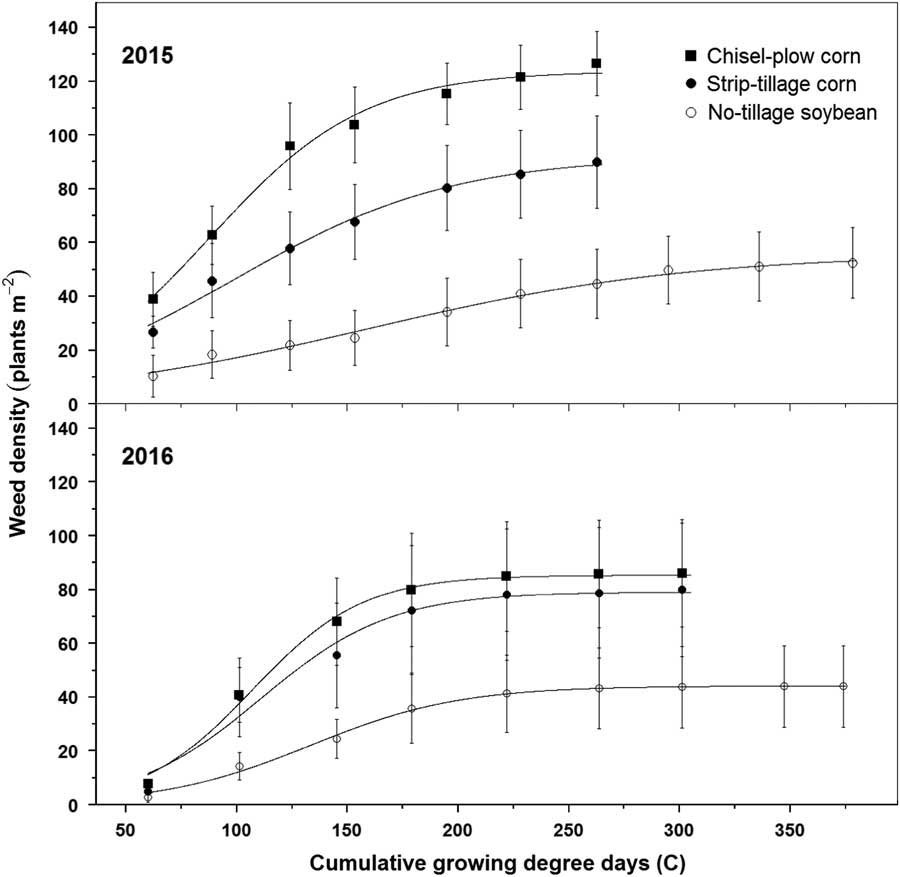
Data were analyzed within year due to a significant interaction between nontreated weed community emergence and year (unpublished data). In each year, cumulative emergence of nontreated weed communities was described best by a logistic function in each cropping system (Figure 4; Table 4). In 2015, maximum weed emergence was greater in CP corn than ST corn; however, time to 50% maximum weed emergence did not differ between these phases. Maximum weed emergence in NT soybean was less than in CP or ST corn, and time to 50% maximum emergence was greater than in CP corn. Time from 50% to 75% maximum weed emergence did not differ among phases. In 2016, maximum weed emergence did not differ between CP corn and ST corn, but was greater than in NT soybean. Time to 50% maximum weed emergence or time from 50% to 75% maximum weed emergence did not differ among phases.
Logistic cumulative emergence of the total weed community in nontreated chisel-plow continuous-corn and strip-tillage corn/no-tillage soybean systems as a function of thermal time from April 30, 2015, and May 3, 2016. Vertical bars indicate standard error of the mean. Equation parameter values are shown in Table 1.
Logistic model parameter values for cumulative emergence of the weed communities in nontreated chisel-plow (CP) continuous-corn and strip-tillage (ST) corn/no-tillage (NT) soybean rotation systems as a function of thermal time (base temperature 10 C) from April 30, 2015, and May 3, 2016.Footnote a

a Standard error of the mean is shown in parentheses.
Our findings are consistent with those of previous research (Brainard and Noyes Reference Brainard and Noyes2012; Hendrix et al. Reference Hendrix, Young and Chong2004). Hendrix et al. (Reference Hendrix, Young and Chong2004) observed that weed emergence 2 wk after planting was greater in conventional tillage than ST or NT systems in 2000; however, weed emergence did not differ among tillage systems in 2001. Brainard and Noyes (Reference Brainard and Noyes2012) found that summer annual weed densities were the same or greater in conventional tillage than ST in carrot (Daucus carota ssp. sativus) production systems. Cumulative weed emergence parameters in our research are largely indicative of C. album, because it was the most abundant species. As noted earlier, our previous research has found recruitment of C. album to be greater in CP than NT systems and greater in continuous-corn than corn/soybean rotation systems (Jeschke Reference Jeschke2007). Greater emergence of C. album may be due to warmer, drier soils in tilled compared with NT systems. Wolkowski et al. (Reference Wolkowski, Cox and Leverich2009) found that soil temperatures measured at a 5-cm depth in April and May in a fall ST treatment were similar to those in a CP system and about 5 C warmer than in a NT system. Although Hendrix et al. (Reference Hendrix, Young and Chong2004) did not find a significant soil temperature effect among tillage systems (conventional, ST, and NT systems), soil moisture was lower in conventional tillage compared with ST and NT in the crop row and between the rows. Other field research has found the response of C. album emergence to tillage and corn residue levels to be highly variable among years, with no clear role of soil moisture or temperature (Buhler et al. Reference Buhler, Mester and Kohler1996).
Strip-Tillage Corn: In-Row and Between-Row Weed Communities
Weed Species Abundance
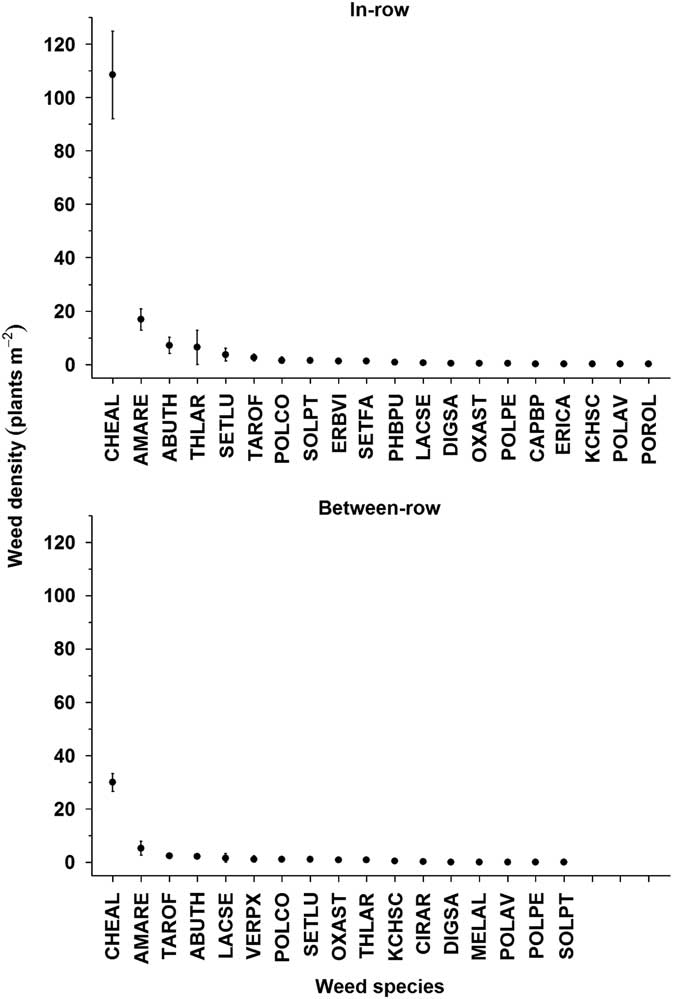
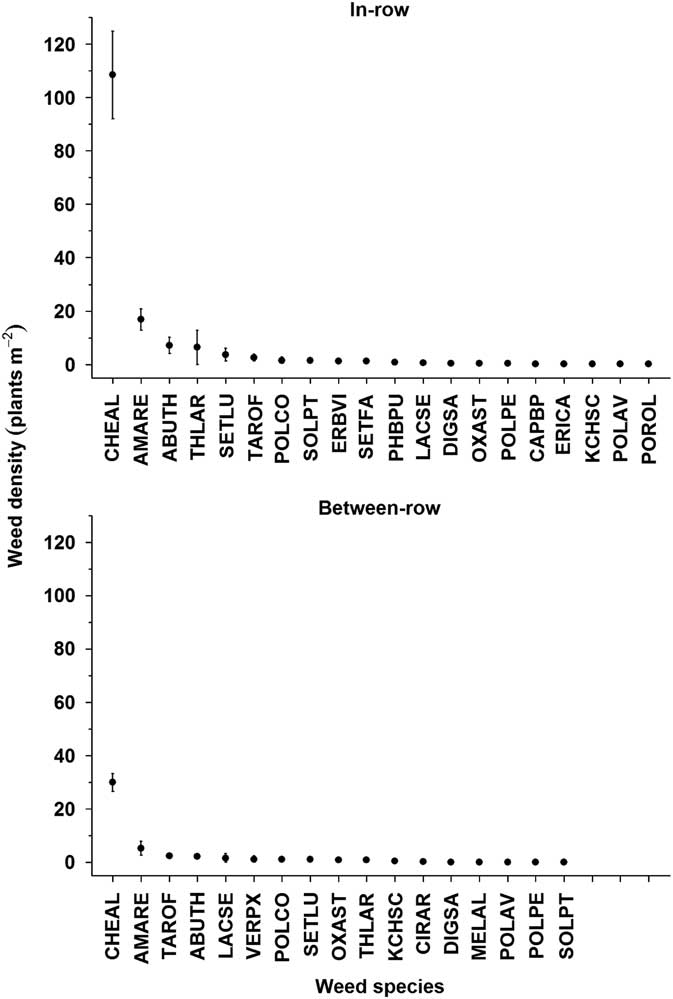
The year by ST zone interaction was not significant (P ≥ 0.05) for nontreated weed species abundance; therefore, data were pooled across years for analysis. Twenty weed species were identified in IR zones and 17 weed species were identified in BR zones (Figure 5). Chenopodium album was the most abundant weed species in both zones, but density was nearly 4-fold greater in IR than BR zones. Other abundant weed species in IR zones were A. retroflexus, A. theophrasti, T. arvense, and S. pumila. In BR zones, abundant weeds were A. retroflexus, T. officinale, A. theophrasti, and L. serriola. In addition to C. album, A. retroflexus and A. theophrasti were also more abundant in IR than BR zones. Abundance of winter annual species (T. arvense and C. bursa-pastoris) and perennial species (T. officinale) did not differ between zones. Hendrix et al. (Reference Hendrix, Young and Chong2004) also observed greater A. theophrasti emergence in IR than BR zones. Greater weed emergence in the IR zone may be due in part to soil conditions associated with soil disturbance conducive for weed seed germination and emergence. Mulugeta and Stoltenberg (Reference Mulugeta and Stoltenberg1997a) found that secondary (i.e., in-crop) soil disturbance in a long-term NT system was associated with greater seedling emergence and seedbank depletion of C. album, A. retroflexus, and S. faberi as compared with no soil disturbance.
Abundance rankings (mean value ± SE) of weed species based on cumulative density from the time of emergence to crop canopy closure in nontreated in-row and between-row zones of the strip-tillage corn phase. Data were pooled over 2015 and 2016. Refer to Figure 1 for Bayer code descriptions.
Cumulative Weed Emergence
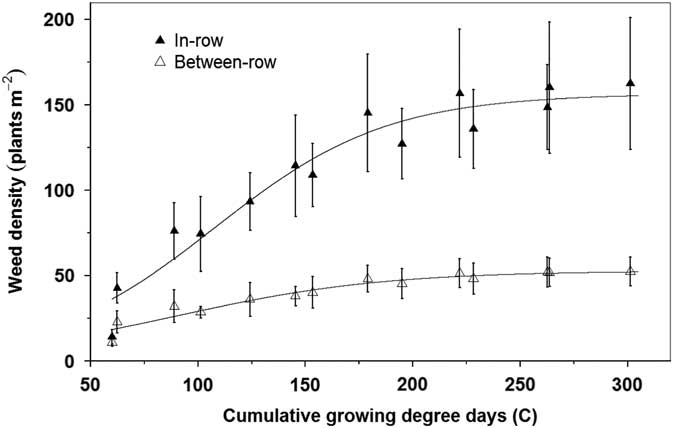
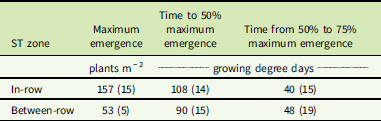
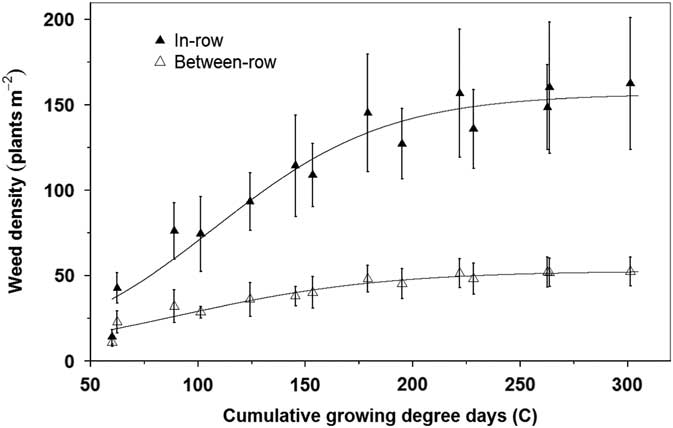
Maximum weed emergence was greater in IR than BR zones; however, time to 50% maximum weed emergence and time from 50% to 75% maximum weed emergence did not differ between IR and BR zones (Figure 6; Table 5). These results indicate that most of the weed emergence (~75%) was spatially located in the IR zone. Previous research has found inconsistent effects of IR and BR zones on maximum weed emergence (Haramoto and Brainard Reference Haramoto and Brainard2017; Hendrix et al. Reference Hendrix, Young and Chong2004). Hendrix et al. (Reference Hendrix, Young and Chong2004) found no differences in total weed emergence between IR and BR zones, except for greater A. theophrasti emergence in IR, as discussed earlier. Haramoto and Brainard (Reference Haramoto and Brainard2017) noted a variable response of A. powellii emergence to ST zones and cover crops compared with full-width tillage, with responses dependent on complex interactions with other factors, including rainfall. They concluded that shallow burial of weed seeds in conservation tillage systems may offset any suppressive effects of ST systems through greater seed density and emergence near the soil surface.
Logistic cumulative emergence of the total weed community in the nontreated in-row and between-row zones of the strip-tillage corn phase as a function of thermal time from April 30, 2015, and May 3, 2016. Data were pooled across 2015 and 2016. Vertical bars indicate standard error of the mean. Equation parameter estimates are shown in Table 5.
Logistic model parameter values for cumulative emergence of the weed communities in nontreated strip-tillage (ST) corn zones as a function of thermal time (base temperature 10 C) across years 2015 and 2016.Footnote a

a Standard error of the mean is shown in parentheses.
Late-Season Weed Shoot Biomass
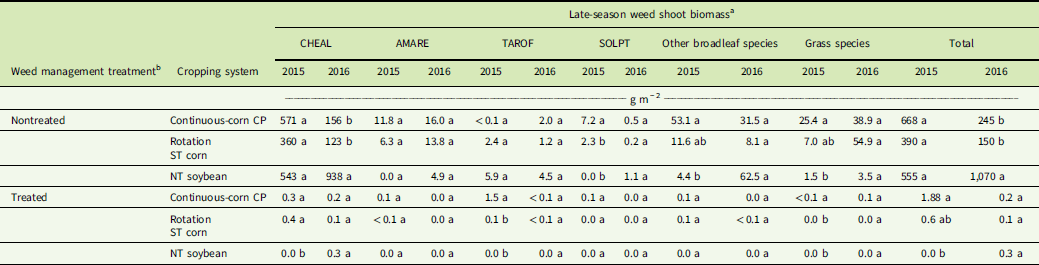
Total late-season (mid-August) weed shoot biomass did not differ between nontreated CP and ST corn phases in 2015 or 2016, although high variability in biomass data limited our ability to detect differences (Table 6). Consistent with its abundance, C. album accounted for >85% of total weed biomass in these phases. In nontreated subplots, initial emergence of C. album typically occurred before emergence of corn, soybean, and other weed species (unpublished data), likely conferring a competitive advantage. Weed shoot biomass of other abundant species did not differ between CP and ST corn, except S. ptychanthum in 2015, for which biomass was greater in CP corn.
Late-season weed shoot biomass by species in long-term chisel-plow (CP) continuous-corn and strip-tillage (ST) corn/no-tillage (NT) soybean rotation systems in 2015 and 2016.

a AMARE, Amaranthus retroflexus; CHEAL, Chenopodium album; SOLPT, Solanum ptychanthum; TAROF, Taraxacum officinale. Within treatment, year, and species, means followed by the same letter do not differ at the 0.05 level as determined by Fisher’s protected LSD.
b Nontreated indicates no herbicides applied; treated refers to herbicides applied as shown in Table 1.
Total weed shoot biomass in nontreated NT soybean did not differ from corn phases in 2015 but was greater than both in 2016. Chenopodium album accounted for most of the weed shoot biomass in NT soybean and did not differ from that in CP or ST corn in 2015. In contrast, C. album biomass was 6- to 7-fold greater in NT soybean compared with CP or ST corn in 2016. This result was likely due to the removal of weeds outside the quadrats. Because soybean emergence was later than that of C. album, weed removal outside of quadrats may have resulted in a large competitive advantage for C. album over soybean and other weeds. In contrast, weed removal in the corn phases may have increased corn competitive ability and contributed to weed suppression within quadrats. Overall, these results suggest that weed community competitive ability was similar between ST and CP corn phases. Further, late-season weed shoot biomass in treated areas was <99% of that in nontreated areas (Table 6), suggesting that corn yield loss risks were similar between ST and CP phases.
We found that weed community composition, total emergence, and productivity were similar between CP corn and ST corn after 10 yr. These results are consistent with results of recent research (Drewitz Reference Drewitz2017), which showed that total germinable weed seedbank densities did not differ between these corn phases, nor did weed seedbank community composition or diversity. Other WICST research (Baldock et al. Reference Baldock, Hedtcke, Posner and Hall2014) has shown that corn yield was greater in ST than CP phases over time (a 0.36 Mg ha−1 differential); however, corn yield increased at the same rate (0.16 Mg ha−1 yr−1) in both phases. Our findings, coupled with the favorable agronomic performance (Baldock et al. Reference Baldock, Hedtcke, Posner and Hall2014) and greater soil conservation (Hedtcke et al. Reference Hedtcke, Posner and Tautges2012) associated with the long-term ST corn/NT soybean system, suggest that production risks are no greater than a continuous-corn CP system, while ecosystem services are enhanced. These results from the WICST provide strong evidence to support grower adoption of ST practices as alternatives to intensive tillage.
Acknowledgments
This research is dedicated to Josh Posner, who founded the WICST in 1989 and guided its research for more than 20 yr. We thank Randy Jackson, Gregg Sanford, and Janet Hedtcke for their efforts to continue the research and impact of the WICST. We thank Alex Butts for technical assistance and Dan Smith, Devin Hammer, Chris Bloomingdale, and Richard Proost for assistance in data collection. This research was funded by the R.G. Harvey Wisconsin Distinguished Graduate Student Fellowship and the University of Wisconsin–Madison College of Agricultural and Life Sciences. The authors declare no conflict of interests.