1 Introduction
Aerofoil turbulence interaction noise, also commonly known as leading-edge noise, is a dominant contributor to overall levels of unwanted noise generated by aeroengines due to rotor–stator interaction (Peake & Parry Reference Peake and Parry2012), and is produced due to the interaction of the wakes generated by a forward blade row with a subsequent blade row. With increasingly tight European noise regulations, such as the Flightpath 2050 target of a 65 % aircraft noise reduction with respect to 2000 noise levels, it is imperative we improve our understanding of noise generation within aircrafts and develop new designs to reduce this noise.
In one of the simplest (analytic) models, Sears (Reference Sears1941) predicts the far-field noise generated by a single flat plate interacting with an unsteady vortical gust. This is extended by Amiet (Reference Amiet1975) to consider the effects of homogeneous isotropic turbulence interacting with a flat plate in uniform flow. Realistic geometry effects are now included in analytic solutions; Myers & Kerschen (Reference Myers and Kerschen1997) considers the effects of angle of attack and camber, Tsai (Reference Tsai1992) considers the effects of non-zero maximum blade thickness, and Ayton (Reference Ayton2016) combines maximum thickness, camber and angle of attack effects, thus accounting for full aerofoil geometry. In the latest analytic models (Tsai Reference Tsai1992; Myers & Kerschen Reference Myers and Kerschen1997; Ayton Reference Ayton2016), only high-frequency,
 $k\gg 1$
, incident gusts are considered to allow matched asymptotic solutions to be found, and the effects of geometry are parameterised by a single constant,
 $\unicode[STIX]{x1D716}\ll 1$
, which denotes the global size of the mean flow perturbation from a uniform flow (hence
 $\unicode[STIX]{x1D716}$
denotes the maximum thickness or camber of the aerofoil under consideration).
These analytic approaches use rapid distortion theory (Goldstein Reference Goldstein1978) to separate the unsteady flow field into two parts; a convective part that describes the distortion of the gust in the mean flow, and a scattered part that contains the acoustic field due to the interaction of the distorted gust with the rigid aerofoil. Acoustic pressure is generated in two ways; the distorted vorticity acting as a source term, and the unsteady vorticity interacting with the rigid surface. One benefit of analytic solutions is that they can easily identify the effects on the far-field noise of these two different contributors.
A variety of numerical methods also consider the effects of geometry on unsteady aerofoil interaction noise (Lockard & Morris Reference Lockard and Morris1998; Grace Reference Grace2001; Allampalli et al.
Reference Allampalli, Hixon, Nallasamy and Sawyer2009; Glegg & Devenport Reference Glegg and Devenport2009). With regards to the effects of thickness, these use a single parameter denoting the maximum thickness of the aerofoil, and supposed the aerofoils have parabolic leading edges (
 $y\sim \sqrt{x}$
) (as do the analytic methods Tsai (Reference Tsai1992) and Ayton (Reference Ayton2016)). It is found both numerically and analytically that for high-frequency interactions, increasing maximum aerofoil thickness reduces the total far-field noise, which is confirmed experimentally (Olsen & Wagner Reference Olsen and Wagner1982). There are, however, some contradictions between numerical and experimental results – for example, Lockard & Morris (Reference Lockard and Morris1998) find that the far-field directivity patterns skew towards the upstream direction with increasing thickness, but this is not found experimentally by Olsen & Wagner (Reference Olsen and Wagner1982). This could be due to difficulties in taking experimental measurements directly upstream of the aerofoil due to the location of the nozzle, or because the unsteady Kutta condition (Crighton Reference Crighton1985) is not imposed in the inviscid results presented in Lockard & Morris (Reference Lockard and Morris1998); neglecting the unsteady Kutta condition is shown to significantly affect the upstream far-field directivity pattern (Ayton, Gill & Peake Reference Ayton, Gill and Peake2016).
The idea that increased thickness can reduce high-frequency far-field noise led to investigating the effects of leading-edge nose radius on unsteady interaction noise, with experimental (Devenport, Staubs & Glegg Reference Devenport, Staubs and Glegg2010; Hall, Atassi & Gilson Reference Hall, Atassi and Gilson2011; Chaitanya et al. Reference Chaitanya, Gill, Narayanan, Joseph, Vanderwel, Zhang and Ganapathisubramani2015) and numerical (Gill, Zhang & Joseph Reference Gill, Zhang and Joseph2013) results both showing trends of a reduction of far-field noise with increased nose radius. It is proposed in Gill et al. (Reference Gill, Zhang and Joseph2013) that the distortions of the steady flow near the nose of the aerofoil are the primary noise reduction mechanism for increasing maximum thickness, and increasing nose radius. Typical outlet guide vane (OGV) geometries have approximately 5 % thickness relative to aerofoil chord. To reduce the interaction noise, increasing the total thickness is unrealistic due to its influence on aerodynamic performance. Understanding how small changes in nose radius can lead to significant changes in far-field-radiated noise is therefore key to realistically reducing aerofoil interaction noise.
In this paper we wish to improve the understanding of the effects of aerofoil leading-edge geometry on gust–aerofoil interaction noise by obtaining an analytic solution for the far-field acoustics, extending previous work based on rapid distortion theory. In particular, the analytic solution found can separate the effects of volume sources, the locally distorted mean flow, and unsteady vorticity interacting with the rigid surface; hence, by considering these effects separately, we aim to develop a broader understanding of the roles of each feature on noise generation. The analytic results determine trends for single-frequency unsteady upstream perturbations that are compared to the trends seen in (fully turbulent) experimental data.
In § 2 we discuss the analytic formulation of the problem, and how to extend previous analytic results (Tsai Reference Tsai1992; Ayton Reference Ayton2016) to a more general leading-edge geometry. In § 2.2 we solve the governing equations in a local inner region around the aerofoil nose. This region contains the key terms contributing to the overall solution that depend on the local leading-edge geometry. The experimental set-up is discussed in § 3, and results are presented in § 4. We discuss our conclusions in § 5.
2 Analytic solution
We wish to find the acoustic field generated by a small unsteady vortical perturbation interacting with an aerofoil with arbitrary leading-edge geometry and chord length
 $2c^{\ast }$
in steady flow which far upstream is uniform
 $\boldsymbol{U}=U_{\infty }^{\ast }\boldsymbol{e}_{x}$
(where
 $^{\ast }$
denotes a dimensional quantity). From here on, lengths are non-dimensionalised by semi-chord,
 $c^{\ast }$
, and velocities by
 $U_{\infty }^{\ast }$
. The boundary of the aerofoil is denoted as
 $\unicode[STIX]{x1D716}y(x)$
such that
 $y(0)=y(2)=0$
and, since we consider only thin aerofoils, we have an asymptotic parameter
 $\unicode[STIX]{x1D716}\ll 1$
governing the maximum thickness of the aerofoil. We consider leading-edge geometries
 $y\sim \unicode[STIX]{x1D716}a_{0}x^{m}$
as
 $x\rightarrow 0$
for
 $0<m<1$
and
 $a_{0}$
a suitable
 $O(1)$
constant.
2.1 Governing equations
Analytic solutions for high-frequency gust–aerofoil interaction noise exist in the case of a parabolic leading edge,
 $m=1/2$
, for both symmetric (Tsai Reference Tsai1992) and non-symmetric (Ayton Reference Ayton2016) aerofoils in steady flow that far upstream is uniform with Mach number
 $M_{\infty }$
. These are obtained by solving the rapid distortion theory equations (Goldstein Reference Goldstein1978) governing the acoustic field. Full derivation of these equations (which are relevant still for arbitrary leading-edge geometry) can be found in Tsai (Reference Tsai1992), Myers & Kerschen (Reference Myers and Kerschen1995, Reference Myers and Kerschen1997) and Ayton (Reference Ayton2016), and therefore are just quoted here. Whilst this work is valid for both symmetric and non-symmetric aerofoils, for simplicity we shall restrict the analysis to the symmetric case only, since it has been found that the effects of camber and angle of attack on aerofoil noise in isotropic turbulence are relatively small in comparison to the effects of thickness (Devenport et al.
Reference Devenport, Staubs and Glegg2010).
As is typical in thin aerofoil interaction theory, we work in the coordinate system
 $(\unicode[STIX]{x1D719},\unicode[STIX]{x1D713})$
, which denote the potential and streamfunction of the steady mean flow, and relate to Cartesian coordinates via
 $$\begin{eqnarray}x+\text{i}\unicode[STIX]{x1D6FD}_{\infty }y=z+\unicode[STIX]{x1D716}F(z),\end{eqnarray}$$
where
 $z=\unicode[STIX]{x1D719}+\text{i}\unicode[STIX]{x1D713}$
,
 $\unicode[STIX]{x1D6FD}_{\infty }=\sqrt{1-M_{\infty }^{2}}$
is the Prandtl–Glauert transformation factor accounting for compressibility, and
 $F$
is the complex potential of the mean flow. A key benefit of this coordinate system is that the aerofoil boundary is now mapped to
 $\unicode[STIX]{x1D713}=0$
.
The complex potential,
 $F(z)$
, can be found by using thin aerofoil theory (Thwaites Reference Thwaites1960)
 $$\begin{eqnarray}q(\unicode[STIX]{x1D719},\unicode[STIX]{x1D713})-\text{i}\unicode[STIX]{x1D707}(\unicode[STIX]{x1D719},\unicode[STIX]{x1D713})=\frac{\text{d}F}{\text{d}z},\end{eqnarray}$$
where
 $$\begin{eqnarray}(q-\text{i}\unicode[STIX]{x1D707})(z)=\frac{1}{\unicode[STIX]{x03C0}\unicode[STIX]{x1D6FD}_{\infty }}\int _{0}^{2}\frac{y^{\prime }(x)}{z-x}\,\text{d}x,\end{eqnarray}$$
and the constant of integration for
 $F$
is chosen such that
 $F(0)=0$
. The mean flow around the aerofoil in our new coordinates is therefore
 $(1+\unicode[STIX]{x1D716}q)\boldsymbol{e}_{\unicode[STIX]{x1D719}}$
.
We denote the convective vortical disturbance far upstream as
 $\unicode[STIX]{x1D708}\boldsymbol{v}_{\infty }=\unicode[STIX]{x1D708}(A_{t},A_{n},A_{3})\text{e}^{\text{i}k(\unicode[STIX]{x1D719}+k_{n}\unicode[STIX]{x1D713}+k_{3}z-t)}$
, and require
 $A_{t}+A_{n}k_{n}\unicode[STIX]{x1D6FD}_{\infty }+A_{3}k_{3}=0$
. We set
 $\unicode[STIX]{x1D708}\ll \unicode[STIX]{x1D716}$
so that the unsteady perturbation is much smaller than the mean flow distortion due to the aerofoil, and consider a high-frequency limit,
 $k\gg 1$
, with a distinguished scaling
 $\unicode[STIX]{x1D716}k=O(1)$
, in line with all previous analytical gust–aerofoil interaction models (Tsai Reference Tsai1992; Myers & Kerschen Reference Myers and Kerschen1995, Reference Myers and Kerschen1997; Ayton Reference Ayton2016). We separate the total unsteady flow field into two parts; the known evolution of the gust in the mean flow,
 $\unicode[STIX]{x1D708}\boldsymbol{v}_{g}$
; and the unknown response to the interaction with the aerofoil,
 $\unicode[STIX]{x1D708}\boldsymbol{v}_{a}=\unicode[STIX]{x1D708}\unicode[STIX]{x1D6FB}G$
, which contains the acoustics that propagate to the far field. We suppose the flow is inviscid, non-heat conducting, and a perfect gas.
We define the modified potential as
 $$\begin{eqnarray}h(\unicode[STIX]{x1D719},\unicode[STIX]{x1D713})=G\text{e}^{\text{i}M_{\infty }^{2}\unicode[STIX]{x1D719}/\unicode[STIX]{x1D6FD}_{\infty }^{2}-M_{\infty }^{2}\unicode[STIX]{x1D716}q},\end{eqnarray}$$
hence the linearised Euler equations become
 $$\begin{eqnarray}\displaystyle & & \displaystyle \frac{\unicode[STIX]{x2202}^{2}h}{\unicode[STIX]{x2202}\unicode[STIX]{x1D719}^{2}}+\frac{\unicode[STIX]{x2202}^{2}h}{\unicode[STIX]{x2202}\unicode[STIX]{x1D713}^{2}}+k^{2}w^{2}(1-2\unicode[STIX]{x1D6FD}_{\infty }^{2}\unicode[STIX]{x1D716}q)h+\frac{(\unicode[STIX]{x1D6FE}+1)M_{\infty }^{4}\unicode[STIX]{x1D716}q}{\unicode[STIX]{x1D6FD}_{\infty }^{2}}\left(\frac{\unicode[STIX]{x2202}^{2}h}{\unicode[STIX]{x2202}\unicode[STIX]{x1D713}^{2}}+2\text{i}k\unicode[STIX]{x1D6FF}\frac{\unicode[STIX]{x2202}h}{\unicode[STIX]{x2202}\unicode[STIX]{x1D719}}+k^{2}(w^{2}+\unicode[STIX]{x1D6FF}^{2})h\right)\nonumber\\ \displaystyle & & \displaystyle \quad -\,\frac{(\unicode[STIX]{x1D6FE}+1)M_{\infty }^{4}\unicode[STIX]{x1D716}}{\unicode[STIX]{x1D6FD}_{\infty }^{2}}\frac{\unicode[STIX]{x2202}q}{\unicode[STIX]{x2202}\unicode[STIX]{x1D719}}\left(\frac{\unicode[STIX]{x2202}h}{\unicode[STIX]{x2202}\unicode[STIX]{x1D719}}-\text{i}k\unicode[STIX]{x1D6FF}h\right)=k\unicode[STIX]{x1D716}S(\unicode[STIX]{x1D719},\unicode[STIX]{x1D713})\text{e}^{\text{i}k\unicode[STIX]{x1D6FA}},\end{eqnarray}$$
where
 $$\begin{eqnarray}\unicode[STIX]{x1D6FF}=1/\unicode[STIX]{x1D6FD}_{\infty }^{2},\quad w^{2}=(M_{\infty }\unicode[STIX]{x1D6FF})^{2}-(k_{3}/\unicode[STIX]{x1D6FD}_{\infty })^{2},\quad \unicode[STIX]{x1D6FA}=\unicode[STIX]{x1D6FF}\unicode[STIX]{x1D719}+k_{n}\unicode[STIX]{x1D713}+\unicode[STIX]{x1D716}g(\unicode[STIX]{x1D719},\unicode[STIX]{x1D713}),\end{eqnarray}$$
and the forcing arising from
 $\boldsymbol{v}_{g}$
is
 $$\begin{eqnarray}S(\unicode[STIX]{x1D719},\unicode[STIX]{x1D713})=\frac{2}{\unicode[STIX]{x1D6FD}_{\infty }^{2}}\!\left(\text{i}(A_{t}-A_{n}k_{n}\unicode[STIX]{x1D6FD}_{\infty }^{3})q+\text{i}(\unicode[STIX]{x1D6FD}_{\infty }^{2}k_{n}A_{t}+A_{n}\unicode[STIX]{x1D6FD}_{\infty })\unicode[STIX]{x1D707}+\frac{A_{t}M_{\infty }^{2}}{k}\frac{\unicode[STIX]{x2202}q}{\unicode[STIX]{x2202}\unicode[STIX]{x1D719}}+\frac{A_{n}M_{\infty }^{2}\unicode[STIX]{x1D6FD}_{\infty }}{k}\frac{\unicode[STIX]{x2202}q}{\unicode[STIX]{x2202}\unicode[STIX]{x1D713}}\!\right)\!.\end{eqnarray}$$
The function,
 $g(\unicode[STIX]{x1D719},\unicode[STIX]{x1D713})$
, is Lighthill’s drift function,
 $$\begin{eqnarray}g(\unicode[STIX]{x1D719},\unicode[STIX]{x1D713})=-2\int _{-\infty }^{\unicode[STIX]{x1D719}}q(\unicode[STIX]{x1D702},\unicode[STIX]{x1D713})\,\text{d}\unicode[STIX]{x1D702},\end{eqnarray}$$
and the boundary condition of zero normal velocity on the aerofoil surface is given by
 $$\begin{eqnarray}\left.\frac{\unicode[STIX]{x2202}h}{\unicode[STIX]{x2202}\unicode[STIX]{x1D713}}+M_{\infty }^{2}\unicode[STIX]{x1D716}\frac{\unicode[STIX]{x2202}q}{\unicode[STIX]{x2202}\unicode[STIX]{x1D713}}h\right|_{\unicode[STIX]{x1D713}=0}=\left.\left(-\frac{A_{n}}{\unicode[STIX]{x1D6FD}_{\infty }}+2\unicode[STIX]{x1D716}\unicode[STIX]{x1D707}A_{t}+\frac{A_{n}M_{\infty }^{2}\unicode[STIX]{x1D716}q}{\unicode[STIX]{x1D6FD}_{\infty }}\right)\text{e}^{\text{i}k\unicode[STIX]{x1D6FA}}\right|_{\unicode[STIX]{x1D713}=0}.\end{eqnarray}$$
Pressure is obtained from the modified potential via
 $$\begin{eqnarray}p=-\left(\frac{\unicode[STIX]{x2202}h}{\unicode[STIX]{x2202}\unicode[STIX]{x1D719}}-\text{i}k\unicode[STIX]{x1D6FF}h\right)\text{e}^{-\text{i}k\unicode[STIX]{x1D6FF}M_{\infty }^{2}\unicode[STIX]{x1D719}},\end{eqnarray}$$
which is derived in Myers & Kerschen (Reference Myers and Kerschen1995, equation (2.7)).
The method of matched asymptotic expansions (Van Dyke Reference Van Dyke1975) is used to solve (2.5a
) subject to (2.6). There are five regions of interest; inner regions around the leading and trailing edges, transition regions above the rigid surfaces and wake, and an outer region. These are depicted in figure 1. For aerofoils with parabolic leading edges,
 $y\sim \sqrt{x}$
as
 $x\rightarrow 0$
, the solution in all regions can be found in Ayton (Reference Ayton2016).
Asymptotic regions around the aerofoil: leading- and trailing-edge inner regions, (i) and (iv); transition regions, (iii) and (v); and the outer region, (ii). (a) In
 $(x,y)$
space. (b) In
 $(\unicode[STIX]{x1D719},\unicode[STIX]{x1D713})$
space.

For high-frequency gusts, it is known that the leading-edge inner solution is dominant in determining the far-field acoustic pressure (Tsai Reference Tsai1992). The trailing-edge inner region produces an acoustic field that propagates to the outer region and acts predominantly to enforce a continuity of pressure and velocity across the trailing edge via a Kutta condition. This trailing-edge solution is
 $O(k^{-1/2})$
smaller than the leading-edge inner solution, propagates with a phase shift compared to the leading-edge solution, and thus modulates the total far-field directivity. The transition solutions do not propagate acoustics to the far field except at small downstream angles
 $\unicode[STIX]{x1D703}=O(k^{-1/2})$
. Therefore, if we wish to determine the effects of altering the leading-edge geometry on the far-field noise it is sufficient to consider the leading-edge inner region at
 $O(1)+$
first-order correction (the size of which will be discussed in the next section) in §§ 2.2 and 2.3, and the trailing-edge inner region at
 $O(k^{-1/2})$
(which is the leading-order term of the trailing-edge inner solution) in § 2.4. We must also account for the distortion of the inner solutions as they propagate noise to the far field, which is discussed in § 2.5.
2.2 Leading-edge inner region
In the leading-edge inner region, (i) in figure 1, we use leading-edge inner variables
 $(\unicode[STIX]{x1D6F7},\unicode[STIX]{x1D6F9})=k(\unicode[STIX]{x1D719},\unicode[STIX]{x1D713})$
, and define the leading-edge inner potential as
 $H(\unicode[STIX]{x1D6F7},\unicode[STIX]{x1D6F9})$
. The governing equation becomes
 $$\begin{eqnarray}\displaystyle & & \displaystyle \frac{\unicode[STIX]{x2202}^{2}H}{\unicode[STIX]{x2202}\unicode[STIX]{x1D6F7}^{2}}+\frac{\unicode[STIX]{x2202}^{2}H}{\unicode[STIX]{x2202}\unicode[STIX]{x1D6F9}^{2}}+w^{2}(1-2\unicode[STIX]{x1D6FD}_{\infty }^{2}\unicode[STIX]{x1D716}q)H+\frac{(\unicode[STIX]{x1D6FE}+1)M_{\infty }^{4}}{\unicode[STIX]{x1D6FD}_{\infty }^{2}}\unicode[STIX]{x1D716}q\left(\frac{\unicode[STIX]{x2202}^{2}H}{\unicode[STIX]{x2202}\unicode[STIX]{x1D6F9}^{2}}+2\text{i}\unicode[STIX]{x1D6FF}\frac{\unicode[STIX]{x2202}H}{\unicode[STIX]{x2202}\unicode[STIX]{x1D6F7}}+(w^{2}+\unicode[STIX]{x1D6FF}^{2})H\right)\nonumber\\ \displaystyle & & \displaystyle \quad -\,\frac{(\unicode[STIX]{x1D6FE}+1)M_{\infty }^{4}}{\unicode[STIX]{x1D6FD}_{\infty }^{2}}\unicode[STIX]{x1D716}\frac{\unicode[STIX]{x2202}q}{\unicode[STIX]{x2202}\unicode[STIX]{x1D6F7}}\left(\frac{\unicode[STIX]{x2202}H}{\unicode[STIX]{x2202}\unicode[STIX]{x1D6F7}}-\text{i}\unicode[STIX]{x1D6FF}H\right)=\frac{\unicode[STIX]{x1D716}}{k}\text{e}^{\text{i}\bar{\unicode[STIX]{x1D6FA}}}S(\unicode[STIX]{x1D6F7},\unicode[STIX]{x1D6F9}),\end{eqnarray}$$
 $$\begin{eqnarray}\bar{\unicode[STIX]{x1D6FA}}=\unicode[STIX]{x1D6FF}\unicode[STIX]{x1D6F7}+k_{n}\unicode[STIX]{x1D6F9}+k\unicode[STIX]{x1D716}g(\unicode[STIX]{x1D6F7},\unicode[STIX]{x1D6F9}),\end{eqnarray}$$
 $$\begin{eqnarray}S(\unicode[STIX]{x1D6F7},\unicode[STIX]{x1D6F9})=\frac{2}{\unicode[STIX]{x1D6FD}_{\infty }^{2}}\!\left(\text{i}q(A_{t}^{\ast }-A_{n}k_{n}\unicode[STIX]{x1D6FD}_{\infty }^{3})+\text{i}\unicode[STIX]{x1D6FD}_{\infty }\unicode[STIX]{x1D707}(\unicode[STIX]{x1D6FD}_{\infty }k_{n}A_{t}^{\ast }+A_{n})+A_{t}^{\ast }M_{\infty }^{2}\frac{\unicode[STIX]{x2202}q}{\unicode[STIX]{x2202}\unicode[STIX]{x1D6F7}}+A_{n}M_{\infty }^{2}\unicode[STIX]{x1D6FD}_{\infty }\frac{\unicode[STIX]{x2202}q}{\unicode[STIX]{x2202}\unicode[STIX]{x1D6F9}}\right)\!,\end{eqnarray}$$
 $$\begin{eqnarray}\left.\frac{\unicode[STIX]{x2202}H}{\unicode[STIX]{x2202}\unicode[STIX]{x1D6F9}}+M_{\infty }^{2}\unicode[STIX]{x1D716}\frac{\unicode[STIX]{x2202}q}{\unicode[STIX]{x2202}\unicode[STIX]{x1D6F9}}H\right|_{\unicode[STIX]{x1D6F9}=0\pm }=\left.\frac{1}{k}\left(-\frac{A_{n}}{\unicode[STIX]{x1D6FD}_{\infty }}+2\unicode[STIX]{x1D716}\unicode[STIX]{x1D707}A_{t}^{\ast }+\frac{A_{n}M_{\infty }^{2}\unicode[STIX]{x1D716}q}{\unicode[STIX]{x1D6FD}_{\infty }}\right)\text{e}^{\text{i}\bar{\unicode[STIX]{x1D6FA}}}\right|_{\unicode[STIX]{x1D713}=0},\end{eqnarray}$$
for
 $\unicode[STIX]{x1D6F7}>0$
.
The inner governing equation and boundary condition contain small terms of size
 $O(\unicode[STIX]{x1D716}q)$
. To determine the asymptotic scaling parameter required in the inner region we need to determine the scaling of these small terms. Therefore, we consider (2.3) for inner variable
 $Z=kz$
to find
 $$\begin{eqnarray}q-\text{i}\unicode[STIX]{x1D707}\sim \unicode[STIX]{x1D716}a_{0}k^{1-m}\frac{m}{Z^{1-m}\unicode[STIX]{x1D6FD}_{\infty }}(-1)^{m}\csc (m\unicode[STIX]{x03C0})+O(\unicode[STIX]{x1D716}k^{-m}).\end{eqnarray}$$
Note this is singular at
 $m=1$
since thin aerofoil theory is not appropriate for a sharp wedge
 $y\sim x$
. We find
 $q=O(\unicode[STIX]{x1D716}k^{1-m})\times O(m/\sin (m\unicode[STIX]{x03C0}))$
, which is
 $O(\unicode[STIX]{x1D716}k^{1-m})$
for
 $0<m\lesssim 0.8$
; therefore, we shall restrict our attention to values of
 $m$
such that
 $0<m<0.8$
, to avoid unnecessary complexity of the asymptotic scaling parameter.
We therefore seek a solution
 $$\begin{eqnarray}H(\unicode[STIX]{x1D6F7},\unicode[STIX]{x1D6F9})=\frac{1}{k}\text{e}^{2\text{i}k\unicode[STIX]{x1D716}F(-\infty )}\left(H_{0}+\unicode[STIX]{x1D716}k^{1-m}(H_{1}+H_{2}+H_{3})\right).\end{eqnarray}$$
The
 $O(\unicode[STIX]{x1D716}k^{1-m})$
term is separated into three components as done for the parabolic (
 $m=1/2$
) leading-edge cases (Tsai Reference Tsai1992; Ayton Reference Ayton2016). The separate terms correspond to different physical mechanisms which will be discussed as we present analysis for each term.
2.2.1 Solution for
 $H_{0}$

This is as if we had a gust impinging on a semi-infinite flat plate, and corresponds to the effects of blocking the vertical gust velocity components. We must solve
 $$\begin{eqnarray}\displaystyle & \displaystyle D(H_{0})=0, & \displaystyle\end{eqnarray}$$
 $$\begin{eqnarray}\displaystyle & \displaystyle \left.\frac{\unicode[STIX]{x2202}H_{0}}{\unicode[STIX]{x2202}\unicode[STIX]{x1D6F9}}\right|_{\substack{ \unicode[STIX]{x1D6F7}>0 \\ \unicode[STIX]{x1D6F9}=0}}=-\frac{A_{n}}{\unicode[STIX]{x1D6FD}_{\infty }}\text{e}^{\text{i}\unicode[STIX]{x1D6FF}\unicode[STIX]{x1D6F7}}, & \displaystyle\end{eqnarray}$$
 $D$
is the Helmholtz operator defined by
 $D=(\unicode[STIX]{x2202}^{2}/\unicode[STIX]{x2202}\unicode[STIX]{x1D6F7}^{2})+(\unicode[STIX]{x2202}^{2}/\unicode[STIX]{x2202}\unicode[STIX]{x1D6F9}^{2})+w^{2}$
. We solve using the Wiener–Hopf method, obtaining
 $$\begin{eqnarray}H_{0}=-\frac{A_{n}\text{sgn}(\unicode[STIX]{x1D6F9})}{\unicode[STIX]{x1D6FD}_{\infty }2\unicode[STIX]{x03C0}\sqrt{\unicode[STIX]{x1D6FF}+w}}\int _{-\infty }^{\infty }\frac{\text{e}^{-\text{i}\unicode[STIX]{x1D706}\unicode[STIX]{x1D6F7}-|\unicode[STIX]{x1D6F9}|\sqrt{\unicode[STIX]{x1D706}^{2}-w^{2}}}}{(\unicode[STIX]{x1D706}+\unicode[STIX]{x1D6FF})\sqrt{\unicode[STIX]{x1D706}+w}}\,\text{d}\unicode[STIX]{x1D706}.\end{eqnarray}$$
To convert back to
 $(\unicode[STIX]{x1D719},\unicode[STIX]{x1D713})$
variables from leading-edge variables,
 $(\unicode[STIX]{x1D6F7},\unicode[STIX]{x1D6F9})$
, we take an outer limit and use the method of steepest descents (Bender & Orszag Reference Bender and Orszag1978). The saddle point is at
 $\unicode[STIX]{x1D706}=-w\cos \unicode[STIX]{x1D703}$
, yielding
 $$\begin{eqnarray}\displaystyle & \displaystyle H_{0}\sim L_{0}(\unicode[STIX]{x1D703})\frac{\text{e}^{\text{i}kwr}}{\sqrt{kr}}+O(k^{-3/2}), & \displaystyle\end{eqnarray}$$
 $$\begin{eqnarray}\displaystyle & \displaystyle L_{0}(\unicode[STIX]{x1D703})=-\frac{A_{n}\text{e}^{-\text{i}\unicode[STIX]{x03C0}/4}\cos \unicode[STIX]{x1D703}/2}{\unicode[STIX]{x1D6FD}_{\infty }\sqrt{\unicode[STIX]{x03C0}}\sqrt{\unicode[STIX]{x1D6FF}+w}(\unicode[STIX]{x1D6FF}-w\cos \unicode[STIX]{x1D703})}. & \displaystyle\end{eqnarray}$$
This flat-plate solution is discussed in detail in Tsai (Reference Tsai1992). The outer limit, equation (2.14), represents the acoustic field propagating from the inner region to the outer region, and provides a directivity function,
 $L_{0}(\unicode[STIX]{x1D703})$
, for the acoustic pressure in the outer region.
2.2.2 Solution for
$H_{1}$

This solution takes account of the effects of thickness on the boundary condition, due to changing of the surface normal direction. We must solve
 $$\begin{eqnarray}\displaystyle D(H_{1})=0, & & \displaystyle\end{eqnarray}$$
 $$\begin{eqnarray}\displaystyle & & \displaystyle \left.\frac{\unicode[STIX]{x2202}H_{1}}{\unicode[STIX]{x2202}\unicode[STIX]{x1D6F9}}\right|_{\substack{ \unicode[STIX]{x1D6F7}>0 \\ \unicode[STIX]{x1D6F9}=0\pm }}=\frac{\text{sgn}(\unicode[STIX]{x1D6F9})}{\unicode[STIX]{x03C0}\unicode[STIX]{x1D6FD}_{\infty }}\unicode[STIX]{x1D6E4}(1-m)\unicode[STIX]{x1D6E4}(1+m)\left[2A_{t}^{\ast }\sin (m\unicode[STIX]{x03C0})-\frac{A_{n}M_{\infty }^{2}}{\unicode[STIX]{x1D6FD}_{\infty }}\cos (m\unicode[STIX]{x03C0})\right]\frac{\text{e}^{\text{i}\unicode[STIX]{x1D6FF}\unicode[STIX]{x1D6F7}}}{\unicode[STIX]{x1D6F7}^{1-m}}\nonumber\\ \displaystyle & & \displaystyle\end{eqnarray}$$
 $$\begin{eqnarray}\displaystyle & & \displaystyle \quad \equiv \text{sgn}(\unicode[STIX]{x1D6F9}){\mathcal{C}}(m)\frac{\text{e}^{\text{i}\unicode[STIX]{x1D6FF}\unicode[STIX]{x1D6F7}}}{\unicode[STIX]{x1D6F7}^{1-m}}.\end{eqnarray}$$
 $$\begin{eqnarray}H_{1}=-\frac{{\mathcal{C}}(m)\unicode[STIX]{x1D6E4}(m)(-\text{i})^{-m}}{2\unicode[STIX]{x03C0}}\int _{-\infty }^{\infty }\frac{\text{e}^{-\text{i}\unicode[STIX]{x1D706}\unicode[STIX]{x1D6F7}-|\unicode[STIX]{x1D6F9}|\sqrt{\unicode[STIX]{x1D706}^{2}-w^{2}}}}{\sqrt{\unicode[STIX]{x1D706}^{2}-w^{2}}(\unicode[STIX]{x1D706}+\unicode[STIX]{x1D6FF})^{m}}\,\text{d}\unicode[STIX]{x1D706},\end{eqnarray}$$
which has outer limit
 $$\begin{eqnarray}\displaystyle & \displaystyle H_{1}\sim L_{1}(\unicode[STIX]{x1D703})\frac{\text{e}^{\text{i}kwr}}{\sqrt{kr}}+O(k^{-3/2}), & \displaystyle\end{eqnarray}$$
 $$\begin{eqnarray}\displaystyle & \displaystyle L_{1}(\unicode[STIX]{x1D703})=\frac{\text{i}\,\unicode[STIX]{x1D6E4}(m){\mathcal{C}}(m)\text{e}^{-\unicode[STIX]{x03C0}\text{i}/4}\text{e}^{\unicode[STIX]{x03C0}\text{i}m/2}}{\sqrt{2\unicode[STIX]{x03C0}w}(\unicode[STIX]{x1D6FF}-w\cos \unicode[STIX]{x1D703})^{m}}. & \displaystyle\end{eqnarray}$$
2.2.3 Solution for
$H_{2}$

We now take account of the volume source in (2.8), arising from the distortion of the incident gust in the locally non-uniform flow at the leading edge. We must solve
 $$\begin{eqnarray}\displaystyle D(H_{2}) & = & \displaystyle \text{e}^{\text{i}\unicode[STIX]{x1D6FF}\unicode[STIX]{x1D6F7}+\text{i}k_{n}\unicode[STIX]{x1D6F9}}\left(\frac{C_{1}}{R^{1-m}}\cos \left[(1-m)\unicode[STIX]{x1D703}+m\unicode[STIX]{x03C0}\right]+\frac{C_{2}}{R^{1-m}}\sin \left[(1-m)\unicode[STIX]{x1D703}+m\unicode[STIX]{x03C0}\right]\right.\nonumber\\ \displaystyle & & \displaystyle \left.+\,\frac{C_{3}}{R^{2-m}}\cos \left[(2-m)\unicode[STIX]{x1D703}+m\unicode[STIX]{x03C0}\right]+\frac{C_{4}}{R^{2-m}}\sin \left[(2-m)\unicode[STIX]{x1D703}+m\unicode[STIX]{x03C0}\right]\right),\end{eqnarray}$$
 $$\begin{eqnarray}\displaystyle \left.\frac{\unicode[STIX]{x2202}H_{2}}{\unicode[STIX]{x2202}\unicode[STIX]{x1D6F9}}\right|_{\substack{ \unicode[STIX]{x1D6F7}>0 \\ \unicode[STIX]{x1D6F9}=0\pm }}=0, & & \displaystyle\end{eqnarray}$$
where
 $$\begin{eqnarray}\displaystyle \left.\begin{array}{@{}c@{}}\displaystyle C_{1}=\frac{2iC}{\unicode[STIX]{x1D6FD}_{\infty }^{2}}(A_{t}^{\ast }-A_{n}k_{n}\unicode[STIX]{x1D6FD}_{\infty }^{3}),\quad C_{2}=-\frac{2iC}{\unicode[STIX]{x1D6FD}_{\infty }}(A_{n}+k_{n}A_{t}^{\ast }\unicode[STIX]{x1D6FD}_{\infty }),\\ \displaystyle C_{3}=-\frac{CA_{t}^{\ast }M_{\infty }^{2}(1-m)}{\unicode[STIX]{x1D6FD}_{\infty }^{2}},\quad C_{4}=-\frac{2CA_{n}M_{\infty }^{2}}{\unicode[STIX]{x1D6FD}_{\infty }},\end{array}\right\} & & \displaystyle\end{eqnarray}$$
with
 $C=\unicode[STIX]{x1D6E4}(1-m)\unicode[STIX]{x1D6E4}(1+m)a_{0}/(\unicode[STIX]{x03C0}\unicode[STIX]{x1D6FD}_{\infty })$
.
We follow the same procedure as the parabolic leading-edge cases (Tsai Reference Tsai1992; Ayton Reference Ayton2016); we split the solution into a particular solution,
 $H_{2p}$
, that solves for the forcing in the governing equation, and a complementary solution,
 $H_{2c}$
, that then enforces the correct boundary condition. We solve for
 $H_{2p}$
by taking Fourier transforms in both the
 $\unicode[STIX]{x1D6F7}$
and
 $\unicode[STIX]{x1D6F9}$
variables yielding;
 $$\begin{eqnarray}\displaystyle H_{2p}(\unicode[STIX]{x1D6F7},\unicode[STIX]{x1D6F9}) & = & \displaystyle \frac{-\text{e}^{-\unicode[STIX]{x03C0}\text{i}m/2}(1-\text{e}^{2\unicode[STIX]{x03C0}\text{i}m})\unicode[STIX]{x1D6E4}(m)}{16\unicode[STIX]{x03C0}(1-m)(\unicode[STIX]{x1D6FF}^{2}+k_{n}^{2})}\nonumber\\ \displaystyle & & \displaystyle \times \,\int _{-\infty }^{\infty }\left(\frac{(\unicode[STIX]{x1D6FF}+\unicode[STIX]{x1D706})f_{1}(\unicode[STIX]{x1D706})+\text{i}k_{n}\,f_{2}(\unicode[STIX]{x1D706})}{\sqrt{\unicode[STIX]{x1D706}^{2}-w^{2}}}-\text{sgn}(\unicode[STIX]{x1D6F9})f_{2}(\unicode[STIX]{x1D706})\right)\nonumber\\ \displaystyle & & \displaystyle \times \,\frac{\text{e}^{a(\unicode[STIX]{x1D706},\unicode[STIX]{x1D6F7},\unicode[STIX]{x1D6F9})}\,\text{d}\unicode[STIX]{x1D706}}{(\unicode[STIX]{x1D706}+\unicode[STIX]{x1D6FF})^{m}(\unicode[STIX]{x1D706}-\unicode[STIX]{x1D706}_{1})(\unicode[STIX]{x1D706}-\unicode[STIX]{x1D706}_{2})}+\frac{\text{e}^{\text{i}k_{n}\unicode[STIX]{x1D6F9}}\text{e}^{-\unicode[STIX]{x03C0}\text{i}m/2}(1-\text{e}^{2\unicode[STIX]{x03C0}\text{i}m})\unicode[STIX]{x1D6E4}(m)}{16\unicode[STIX]{x03C0}(1-m)(\unicode[STIX]{x1D6FF}^{2}+k_{n}^{2})}\nonumber\\ \displaystyle & & \displaystyle \times \,\int _{-\infty }^{\infty }\left(\frac{f_{1}(\unicode[STIX]{x1D706})}{(\unicode[STIX]{x1D706}+\unicode[STIX]{x1D6FF}^{\prime })^{m}}-\frac{\text{sgn}(\unicode[STIX]{x1D6F9})f_{2}(\unicode[STIX]{x1D706})}{(\unicode[STIX]{x1D706}+\unicode[STIX]{x1D6FF})^{m}}\right)\frac{\text{e}^{h(\unicode[STIX]{x1D706},\unicode[STIX]{x1D6F7},\unicode[STIX]{x1D6F9})}\,\text{d}\unicode[STIX]{x1D706}}{(\unicode[STIX]{x1D706}-\unicode[STIX]{x1D706}_{1})(\unicode[STIX]{x1D706}-\unicode[STIX]{x1D706}_{2})},\end{eqnarray}$$
where
 $$\begin{eqnarray}\displaystyle f_{1}(\unicode[STIX]{x1D706}) & = & \displaystyle \left[C_{1}(m-1)-\text{i}(\unicode[STIX]{x1D6FF}+\unicode[STIX]{x1D706})C_{3}\right](-k_{n}^{2}+w^{2}+\unicode[STIX]{x1D6FF}^{2}+2\unicode[STIX]{x1D6FF}\unicode[STIX]{x1D706})\nonumber\\ \displaystyle & & \displaystyle +\,2(\unicode[STIX]{x1D6FF}+\unicode[STIX]{x1D706})k_{n}\left[C_{2}(m-1)-\text{i}(\unicode[STIX]{x1D6FF}+\unicode[STIX]{x1D706})C_{4}\right],\end{eqnarray}$$
 $$\begin{eqnarray}\displaystyle f_{2}(\unicode[STIX]{x1D706}) & = & \displaystyle \left[C_{2}(m-1)\text{i}+(\unicode[STIX]{x1D6FF}+\unicode[STIX]{x1D706})C_{4}\right](k_{n}^{2}-w^{2}-\unicode[STIX]{x1D6FF}^{2}-2\unicode[STIX]{x1D6FF}\unicode[STIX]{x1D706})\nonumber\\ \displaystyle & & \displaystyle +\,2(\unicode[STIX]{x1D6FF}+\unicode[STIX]{x1D706})k_{n}\left[\text{i}C_{1}(m-1)+(\unicode[STIX]{x1D6FF}+\unicode[STIX]{x1D706})C_{3}\right],\end{eqnarray}$$
 $$\begin{eqnarray}\displaystyle \unicode[STIX]{x1D706}_{1,2}=-\frac{\unicode[STIX]{x1D6FF}}{2}\left(\frac{\unicode[STIX]{x1D6FF}^{2}+k_{n}^{2}+w^{2}}{\unicode[STIX]{x1D6FF}^{2}+k_{n}^{2}}\right)\pm \frac{\text{i}k_{n}}{2}\left(\frac{\unicode[STIX]{x1D6FF}^{2}+k_{n}^{2}-w^{2}}{\unicode[STIX]{x1D6FF}^{2}+k_{n}^{2}}\right). & & \displaystyle\end{eqnarray}$$
The acoustic phase is
 $$\begin{eqnarray}a(\unicode[STIX]{x1D706},\unicode[STIX]{x1D6F7},\unicode[STIX]{x1D6F9})=-\text{i}\unicode[STIX]{x1D706}\unicode[STIX]{x1D6F7}-|\unicode[STIX]{x1D6F9}|\sqrt{\unicode[STIX]{x1D706}^{2}-w^{2}},\end{eqnarray}$$
and the hydrodynamic phase is
 $$\begin{eqnarray}h(\unicode[STIX]{x1D706},\unicode[STIX]{x1D6F7},\unicode[STIX]{x1D6F9})=-\text{i}\unicode[STIX]{x1D706}\unicode[STIX]{x1D6F7}-|\unicode[STIX]{x1D6F9}|\sqrt{(\unicode[STIX]{x1D706}+\unicode[STIX]{x1D6FF})(\unicode[STIX]{x1D706}+\unicode[STIX]{x1D6FF}^{\prime })}.\end{eqnarray}$$
For convergence,
 $\unicode[STIX]{x1D6FF}$
is assumed to have a small positive imaginary part, and
 $\unicode[STIX]{x1D6FF}^{\prime }$
has a corresponding small negative imaginary part.
We notice two types of solution; an acoustic and a hydrodynamic solution. It is only the acoustic field that will provide pressure fluctuations in the far field. The key functional difference between our solution for a general leading-edge geometry and that for a parabolic leading edge is the
 $(\unicode[STIX]{x1D706}+\unicode[STIX]{x1D6FF})^{m}$
poles present in both acoustic and hydrodynamic terms. We can therefore obtain the complementary solution from previous work that assumes
 $m=1/2$
(Tsai Reference Tsai1992; Ayton Reference Ayton2016) by making the relevant changes to these pole terms;
 $$\begin{eqnarray}\displaystyle H_{2c}(\unicode[STIX]{x1D6F7},\unicode[STIX]{x1D6F9}) & = & \displaystyle \frac{-\text{sgn}(\unicode[STIX]{x1D6F9})\text{e}^{-\unicode[STIX]{x03C0}\text{i}m/2}(1-\text{e}^{2\unicode[STIX]{x03C0}\text{i}m})\unicode[STIX]{x1D6E4}(m)}{16\unicode[STIX]{x03C0}(1-m)(\unicode[STIX]{x1D6FF}^{2}+k_{n}^{2})}\int _{-\infty }^{\infty }\left\{2(-\unicode[STIX]{x1D6FF}C_{4}+k_{n}C_{3}){\mathcal{H}}\left(\frac{1}{2}-m\right)\right.\nonumber\\ \displaystyle & & \displaystyle -\,\left(\frac{\sqrt{\unicode[STIX]{x1D706}+w}f_{2}(\unicode[STIX]{x1D706})}{(\unicode[STIX]{x1D706}+\unicode[STIX]{x1D6FF})^{m}(\unicode[STIX]{x1D706}-\unicode[STIX]{x1D706}_{2})}+\frac{\sqrt{\unicode[STIX]{x1D706}_{1}+w}f_{2}(\unicode[STIX]{x1D706}_{1})}{(\unicode[STIX]{x1D706}_{1}+\unicode[STIX]{x1D6FF})^{m}(\unicode[STIX]{x1D706}_{1}-\unicode[STIX]{x1D706}_{2})}\right)\frac{1}{\unicode[STIX]{x1D706}-\unicode[STIX]{x1D706}_{1}}\nonumber\\ \displaystyle & & \displaystyle +\,\left.\frac{(\unicode[STIX]{x1D706}_{2}+\unicode[STIX]{x1D6FF})f_{2}(\unicode[STIX]{x1D706}_{2})+\text{i}k_{n}\,f_{1}(\unicode[STIX]{x1D706}_{2})}{\sqrt{\unicode[STIX]{x1D706}_{2}-w}(\unicode[STIX]{x1D706}_{2}+\unicode[STIX]{x1D6FF}^{\prime })^{m}(\unicode[STIX]{x1D706}_{2}-\unicode[STIX]{x1D706})(\unicode[STIX]{x1D706}-\unicode[STIX]{x1D706}_{1})}\right\}\frac{\text{e}^{a(\unicode[STIX]{x1D706},\unicode[STIX]{x1D6F7},\unicode[STIX]{x1D6F9})}}{\sqrt{\unicode[STIX]{x1D706}+w}}\,\text{d}\unicode[STIX]{x1D706}.\end{eqnarray}$$
This is obtained using the Wiener–Hopf method, with the Heaviside function,
 ${\mathcal{H}}$
(defined such that
 ${\mathcal{H}}(0)=1/2$
), occurring due to the entire function arising from Liouville’s theorem. The outer limit,
 $L_{2}(\unicode[STIX]{x1D703})\text{e}^{\text{i}kwr}/\sqrt{kr}$
, for the acoustic contributions can be obtained using steepest descents as before, and is given in appendix A.
2.2.4 Solution for
$H_{3}$

The final term to be found in our leading-edge inner solution arises due to the distortion of the zeroth-order term,
 $H_{0}$
, as it interacts with the locally non-uniform mean flow around the nose of the aerofoil. We must solve
 $$\begin{eqnarray}\displaystyle D(H_{3}) & = & \displaystyle 2\unicode[STIX]{x1D6FD}_{\infty }^{2}w^{2}qH_{0}-\frac{(\unicode[STIX]{x1D6FE}+1)M_{\infty }^{4}}{\unicode[STIX]{x1D6FD}_{\infty }^{2}}q\left(\frac{\unicode[STIX]{x2202}^{2}H_{0}}{\unicode[STIX]{x2202}\unicode[STIX]{x1D6F9}^{2}}+2\text{i}\unicode[STIX]{x1D6FF}\frac{\unicode[STIX]{x2202}H_{0}}{\unicode[STIX]{x2202}\unicode[STIX]{x1D6F7}}+(w^{2}+\unicode[STIX]{x1D6FF}^{2})H_{0}\right)\nonumber\\ \displaystyle & & \displaystyle +\,\frac{(\unicode[STIX]{x1D6FE}+1)M_{\infty }^{4}}{\unicode[STIX]{x1D6FD}_{\infty }^{2}}\frac{\unicode[STIX]{x2202}q}{\unicode[STIX]{x2202}\unicode[STIX]{x1D6F7}}\left(\frac{\unicode[STIX]{x2202}H_{0}}{\unicode[STIX]{x2202}\unicode[STIX]{x1D6F7}}-\text{i}\unicode[STIX]{x1D6FF}H_{0}\right),\end{eqnarray}$$
 $$\begin{eqnarray}\displaystyle \left.\frac{\unicode[STIX]{x2202}H_{3}}{\unicode[STIX]{x2202}\unicode[STIX]{x1D6F9}}\right|_{\substack{ \unicode[STIX]{x1D6F7}>0 \\ \unicode[STIX]{x1D6F9}=0\pm }}=-M_{\infty }^{2}\frac{\unicode[STIX]{x2202}q}{\unicode[STIX]{x2202}\unicode[STIX]{x1D6F9}}H_{0}. & & \displaystyle\end{eqnarray}$$
We solve by splitting the solution into a particular,
 $H_{3p}$
, and a complementary solution,
 $H_{3c}=H_{3c_{1}}+H_{3c_{2}}+H_{3c_{3}}$
, as for the parabolic case. The solutions can be found in appendix B along with their outer limits,
 $L_{3p}(\unicode[STIX]{x1D703})\text{e}^{\text{i}kwr}/\sqrt{kr}$
and
 $L_{3c_{1,2,3}}(\unicode[STIX]{x1D703})\text{e}^{\text{i}kwr}/\sqrt{kr}$
.
2.3 Outer limit of the leading-edge inner solution
We have now completed the solution for the leading-edge inner region which is dominant in determining the effects of leading-edge geometry on the far-field acoustics. To summarise, the outer limit of the leading-edge inner solution yields
 $$\begin{eqnarray}\displaystyle h_{l}(r,\unicode[STIX]{x1D703}) & {\sim} & \displaystyle \frac{\text{e}^{\text{i}kwr+2\text{i}k\unicode[STIX]{x1D716}F(-\infty )}}{k^{3/2}\sqrt{r}}\left(L_{0}(\unicode[STIX]{x1D703})+\unicode[STIX]{x1D716}k^{1-m}\left[L_{1}(\unicode[STIX]{x1D703})+L_{2}(\unicode[STIX]{x1D703})+L_{3p}(\unicode[STIX]{x1D703})\right.\right.\nonumber\\ \displaystyle & & \displaystyle \left.\left.+\,L_{3c_{1}}(\unicode[STIX]{x1D703})+L_{3c_{2}}(\unicode[STIX]{x1D703})+L_{3c_{3}}(\unicode[STIX]{x1D703})\right]\right)\end{eqnarray}$$
 $$\begin{eqnarray}\displaystyle & = & \displaystyle \frac{\text{e}^{\text{i}kwr+2\text{i}k\unicode[STIX]{x1D716}F(-\infty )}}{\sqrt{kr}}D_{l}(\unicode[STIX]{x1D703}),\end{eqnarray}$$
 $D_{l}(\unicode[STIX]{x1D703})$
, correct to
 $O(\unicode[STIX]{x1D716}k^{1-m})$
, generated by interactions at the leading edge. Note the phase function,
 $2\text{i}k\unicode[STIX]{x1D716}F(-\infty )$
, and additional amplitude multiplier,
 $k^{-1}$
, have arisen due to the proposed form of the leading-edge inner solution, equation (2.11).
We can use this solution, equation (2.21), to investigate the effects of altering the leading-edge geometry on the far-field acoustics; in particular, the different contributions to the solution can highlight the effects of different physical processes.
2.4 Trailing-edge solution
Here we discuss the solution in region (iv) of figure 1.
Trailing-edge coordinates are defined as
 $(\unicode[STIX]{x1D719}_{t},\unicode[STIX]{x1D713}_{t})$
, where
 $$\begin{eqnarray}\unicode[STIX]{x1D719}=2+\unicode[STIX]{x1D6FC}_{t}+\unicode[STIX]{x1D719}_{t},\quad \unicode[STIX]{x1D713}=\unicode[STIX]{x1D713}_{t},\end{eqnarray}$$
with
 $\unicode[STIX]{x1D6FC}_{t}=\text{Re}(\unicode[STIX]{x1D716}F(2))$
. The inner acoustic potential is labelled
 $H_{t}(\unicode[STIX]{x1D6F7}_{t},\unicode[STIX]{x1D6F9}_{t})$
, where
 $(\unicode[STIX]{x1D6F7}_{t},\unicode[STIX]{x1D6F9}_{t})=k(\unicode[STIX]{x1D719}_{t},\unicode[STIX]{x1D713}_{t})$
are trailing-edge inner coordinates.
We wish to find only the leading-order contribution to the trailing-edge inner acoustic solution (in region (iv) of figure 1) which is
 $O(k^{-1/2})$
smaller than the leading-edge inner solution. The total trailing-edge inner acoustic solution arises from the rescattering of the leading-edge acoustic field by the sharp trailing edge. If we wish to retain only the first term, we only need to consider the rescattering of the leading-order leading-edge solution, i.e. the flat-plate term associated to
 $H_{0}$
. This is independent of nose geometry, and thus we can use the solution derived in previous work (Tsai Reference Tsai1992; Myers & Kerschen Reference Myers and Kerschen1995, Reference Myers and Kerschen1997; Ayton Reference Ayton2016).
We therefore have an outer limit of the trailing-edge inner solution given by
 $$\begin{eqnarray}\displaystyle h_{t} & {\sim} & \displaystyle \frac{\text{sgn}(\unicode[STIX]{x1D713})\text{e}^{\text{i}kwr_{t}}\unicode[STIX]{x0394}p}{\sqrt{2r_{t}}k^{2}(\unicode[STIX]{x1D6FF}-w)}\left(\frac{\text{e}^{\unicode[STIX]{x03C0}i/4}|\sin \unicode[STIX]{x1D703}_{t}/2|}{\sqrt{\unicode[STIX]{x03C0}w}(\unicode[STIX]{x1D6FF}-w\cos \unicode[STIX]{x1D703}_{t})}\right.\nonumber\\ \displaystyle & & \displaystyle \left.+\sqrt{k}\,\text{i}\text{e}^{-2\text{i}kw(1-\cos \unicode[STIX]{x1D703})}\text{erfc}\left[\text{e}^{-\unicode[STIX]{x03C0}\text{i}/4}\sqrt{2kw(1-\cos \unicode[STIX]{x1D703})}\right]\right)\end{eqnarray}$$
 $$\begin{eqnarray}\displaystyle & = & \displaystyle \frac{\text{e}^{\text{i}kwr_{t}}}{k^{2}\sqrt{r_{t}}}D_{t}(\unicode[STIX]{x1D703}_{t}),\end{eqnarray}$$
where
 $\unicode[STIX]{x0394}p$
denotes the leading-order pressure jump across the trailing edge due to the leading-edge acoustic solution,
 $$\begin{eqnarray}\unicode[STIX]{x0394}p=\sqrt{2}\text{i}(\unicode[STIX]{x1D6FF}-w)L_{0}(0)\text{e}^{\text{i}k(w-\unicode[STIX]{x1D6FF}M_{\infty }^{2})(2+\unicode[STIX]{x1D6FC}_{t})+2\text{i}k\unicode[STIX]{x1D716}F(-\infty )}.\end{eqnarray}$$
The phase terms arise in (2.25) due to the shift of coordinates from the leading edge to the trailing edge, recalling that pressure, defined by (2.7), contains additional phase factors.
 $D_{t}$
is the trailing-edge directivity function.
2.5 Solution in the outer region
To construct an approximate solution in the outer region, (ii) in figure 1, we must account for phase differences in the leading- and trailing-edge acoustic solutions. Both solutions will undergo a phase distortion as they propagate from the inner regions to the far field, and there will be a further phase shift between the two solutions due to the differing positions of the leading and trailing edges. These phase effects are not a result of the precise geometry of the nose, and hence we can recover these effects directly from Tsai (Reference Tsai1992), Ayton (Reference Ayton2016).
The asymptotic solution for the far-field acoustics, correct to
 $O(k^{-3/2}\unicode[STIX]{x1D716}k^{1-m},k^{-2})$
, is hence given by
 $$\begin{eqnarray}h(r,t)\sim \frac{\text{e}^{\text{i}kwr}}{k^{3/2}\sqrt{r}}\left(D_{l}(\unicode[STIX]{x1D703})+\frac{1}{\sqrt{k}}D_{t}(\unicode[STIX]{x1D703})\text{e}^{\text{i}kw\unicode[STIX]{x1D70E}_{s}}\right),\end{eqnarray}$$
where the phase shift is given by
 $$\begin{eqnarray}\unicode[STIX]{x1D70E}_{s}=V(\unicode[STIX]{x1D703})\unicode[STIX]{x1D6FC}_{t}\cos \unicode[STIX]{x1D703}+\unicode[STIX]{x1D6FC}_{t}\cos \unicode[STIX]{x1D703}-2\unicode[STIX]{x1D716}F(-\infty ),\end{eqnarray}$$
with
 $$\begin{eqnarray}V(\unicode[STIX]{x1D703})=-\frac{1}{2w}\left(2\unicode[STIX]{x1D6FD}_{\infty }^{2}w^{2}-\frac{(\unicode[STIX]{x1D6FE}+1)M_{\infty }^{4}}{\unicode[STIX]{x1D6FD}_{\infty }^{2}}(\unicode[STIX]{x1D6FF}-w\cos \unicode[STIX]{x1D703})^{2}\right).\end{eqnarray}$$
The last two terms in (2.27) arise due to the different positions of the leading and trailing edges, whilst the first term arises because of the (relative) distortion of the inner acoustics as they propagate to the far field. We define the far-field directivity,
 $D(\unicode[STIX]{x1D703})$
, as
 $$\begin{eqnarray}D(\unicode[STIX]{x1D703})=\left(D_{l}(\unicode[STIX]{x1D703})+\frac{1}{\sqrt{k}}D_{t}(\unicode[STIX]{x1D703})\text{e}^{\text{i}kw\unicode[STIX]{x1D70E}_{s}}\right).\end{eqnarray}$$
3 Experimental set-up and procedure
We shall compare our analytical solution for a single high-frequency vortical perturbation interacting with a leading edge of variable nose radius to experimental results measuring the far-field noise generated by such aerofoils in a fully turbulent stream. In this section we discuss the test facility, specific experimental set-up, and extraction of results. Further details can be found in Chong, Joseph & Davis (Reference Chong, Joseph and Davis2008) and Narayanan et al. (Reference Narayanan, Chaitanya, Haeri, Joseph, Kim and Polacsek2015).
3.1 Open-jet test facility and instrumentation
Far-field noise measurements were carried out at the Institute of Sound and Vibration Research (ISVR)’s open-jet wind tunnel facility. Figure 2 shows a photograph of the facility within the anechoic chamber of dimensions
 $8~\text{m}\times 8~\text{m}\times 8~\text{m}$
. The walls are acoustically treated with glass wool wedges and the cutoff frequency of the chamber is approximately 80 Hz. The nozzle is designed as a three-dimensional, 25:1 CR nozzle. The inlet of the nozzle is a square section measuring
 $1.3~\text{m}\times 1.3~\text{m}$
and the outlet is rectangular shape measuring
 $0.15~\text{m}\times 0.45~\text{m}$
. The axial length of the nozzle is 1.35 m. To maintain two-dimensional flow around the aerofoil, side plates are mounted to the nozzle exit which also support the aerofoil. The nozzle dimensions are
 $15~\text{cm}\times 45~\text{cm}$
. Aerofoils are located 0.15 m downstream of the nozzle to ensure that the entire aerofoil is located well within the jet potential core, whose width is at least 0.12 m, as shown in figure 11(a) in Chong et al. (Reference Chong, Joseph and Davis2008). Chong et al. (Reference Chong, Joseph and Davis2008) also shows that the flow is two-dimensional (no spanwise variation) to within a deviation of approximately 4 %. The maximum jet speed investigated in this study is
 $80~\text{m}~\text{s}^{-1}$
.
Photograph of jet nozzle and test set-up inside the ISVR anechoic chamber.

3.2 Far-field noise measurements
Free-field noise measurements are made using 11 half-inch condenser microphones (B&K type 4189) located at a constant radial distance of 1.2 m from the mid span of the aerofoil leading edge. These microphones are placed at emission angles of between
 $40^{\circ }$
and
 $140^{\circ }$
measured relative to the downstream jet axis. Measurements are carried out for a duration of 10 s at a sampling frequency of 50 kHz, and the noise spectra are calculated with a window size of 1024 data points corresponding to a frequency resolution of 48.83 Hz and a
 $BT$
product of approximately 500, which is sufficient to ensure negligible variance in the spectral estimate.
The acoustic pressure at the microphones is recorded at mean flow velocities of 20, 40, 60 and
 $80~\text{m}~\text{s}^{-1}$
at the exit of the jet nozzle. Details of the calculation method for deducing the Sound Pressure Level spectra (SPL), and the Sound Power Level spectra (PWL) as functions of frequency,
 $k$
, are presented in Narayanan et al. (Reference Narayanan, Chaitanya, Haeri, Joseph, Kim and Polacsek2015).
3.3 Turbulence characterisation
A bi-planar rectangular grid with overall dimensions of
 $0.63\times 0.69~\text{m}^{2}$
located in the contraction section of the nozzle is used to generate turbulence that is closely homogeneous and isotropic. This bi-planar grid is designed based on empirical equations presented in Roach (Reference Roach1987) and Hinze (Reference Hinze1959). The grid is located 0.75 m upstream of the nozzle exit. The streamwise velocity spectrum is measured using a hot wire at a single on-axis position 0.145 m downstream from the nozzle exit. It is found to be in close agreement with the von-Karman spectrum for homogeneous and isotropic turbulence with a 2.5 % turbulence intensity and a 7.5 mm integral length scale. The turbulence integral length scale is obtained by matching the theoretical spectra to the measured streamwise velocity spectra and dividing by two, assuming perfect isotropic turbulence. A comparison of the two measured streamwise velocity spectra (
 $S_{uu}/U^{\ast }$
) plotted against non-dimensional frequency
 $k$
together with the theoretical von-Karman spectra are plotted in figure 3, where close agreement is observed.
Comparison between the measured axial velocity spectra and theoretical von-Karman spectra.

3.4 Three-dimensional aerofoil models
In this study, six NACA symmetric aerofoils are produced using 3D printing technology. We systematically vary thickness and nose radius of the aerofoils as shown in figure 4. In the case of the NACA 4-digit aerofoils, the leading-edge nose radius
 $R_{e}$
is related to maximum thickness by
 $$\begin{eqnarray}R_{e}=0.5\left[0.2969\frac{\unicode[STIX]{x1D716}}{0.2}\left(\frac{I}{6}\right)\right]^{2},\end{eqnarray}$$
where
 $I$
is a non-dimensional parameter that defines the shape of the leading edge, as described in (Gill et al.
Reference Gill, Zhang and Joseph2013).
 $I=0$
, represents a sharp leading edge, represented as NACA xxxx-03, whereas
 $I=10$
represents blunt aerofoils, represented as NACA xxxx-103 and
 $I=6$
represents standard NACA profile geometries. Recall the analytic description of the leading edge is
 $y\sim \unicode[STIX]{x1D716}a_{0}x^{m}$
, where
 $m$
and
 $a_{0}$
are used to alter the leading-edge radius. The values of
 $I$
used experimentally correspond to values and
 $m$
and
 $a_{0}$
as given in table 1.
Table of values of
 $m$
and
 $a_{0}$
that correspond to
 $I=0,6,10$
for NACA aerofoils with maximum thickness of 6 % or 12 %.

Symmetric aerofoil geometries considered in the study.

The influence of self-noise on total noise for 6 % and 12 % thickness to chord at a jet velocity of
 $60~\text{m}~\text{s}^{-1}$
(
 $M=0.18$
).

In order to prevent tonal noise generation due to Tollmien–Schlichting waves convecting in the laminar boundary layer, and to ensure complete consistency between the different cases, the flow near the leading edge of the aerofoil is tripped to force transition to turbulence using a rough band of tape of width 0.0125 m located 16.6 % of chord from the leading edge, on both suction and pressure sides. The tape has a roughness of SS 100, corresponding to a surface roughness of 140
 $\unicode[STIX]{x03BC}\text{m}$
. Transition is forced by the use of trip tape, which is many orders of magnitude rougher than the aerofoil surface, and is therefore highly unlikely to affect transition. Previous noise measurements in the facility have indicated that self-noise is insensitive to the method of tripping.
4 Results
In this section we investigate the effects of altering the leading-edge geometry on the far-field acoustic pressure solution found both analytically and experimentally. We first validate the analytical solution by showing it agrees with the experimental findings in § 4.1, then in § 4.2 we use the analytical solution to decompose the acoustic flow field to investigate the different physical processes happening at the aerofoil leading edge, and what the effects of altering nose radius are on these.
4.1 Comparison of experimental and analytical results
We first compare the analytical and experimental results for the set of test cases given in table 1. In figure 7 we present results for the measured acoustic sound pressure levels at each of the 11 microphone locations, for aerofoils with 6 % or 12 % thickness that are modified forms of standard NACA 4-digit aerofoils, with leading-edge nose radii described by (3.1). Two low-Mach-number mean flow velocities are used corresponding to
 $U^{\ast }=20,80~\text{m}~\text{s}^{-1}$
(
 $M=0.06,0.24$
), and two non-dimensionalised frequencies,
 $k=2.5,5$
.
The total noise radiated by the aerofoil located within a turbulent flow is dominated by leading-edge noise at these chosen frequencies but by trailing-edge noise at higher frequencies. As it is very difficult to measure leading-edge noise and trailing-edge self-noise separately, our experimental analysis was limited to the frequency region where the interaction noise dominates trailing-edge self-noise. Figure 5 shows the influence of self-noise on the total noise spectra. The spectra of radiated noise due to trailing-edge self-noise alone is obtained by removing the turbulence grid. Sound power levels are plotted against a non-dimensional frequency (
 $k$
) for aerofoils with two different thicknesses for the highest flow speed of
 $M=0.24$
. It is observed that the thicker aerofoil has lower interaction noise and the self-noise starts dominating the total noise at a relatively lower frequency compared to the thinner aerofoil. The non-dimensional frequency (
 $k$
) where self-noise starts to dominant the total noise for NACA 0012 is around 6. Whereas for NACA 0006 it is greater than 10. These frequencies are a function of incoming turbulence intensity, where in our present study it is approximately 2.5 %. Below these frequencies the difference between total noise and trailing-edge self-noise is greater than 5 dB, suggesting the dominance of trailing-edge noise on total noise is negligible. Hence, in the frequency range considered in this present study, leading-edge noise is the main contributor to the total far-field noise measured.


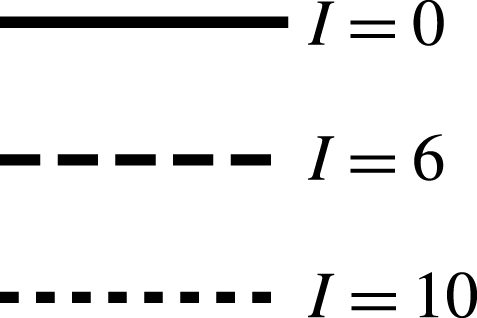
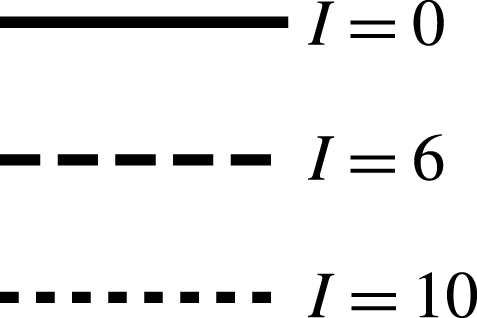
Sound pressure level measured experimentally against polar angle
 $\unicode[STIX]{x1D703}$
. Legend given in figure 6.

For the highest frequency,
 $k=5$
, and 12 % thickness we see in figure 7 that as nose radius increases (
 $I$
increases), the magnitude of the acoustic pressure decreases. The level of reduction is decreased for the higher mean flow. It is known from Chaitanya et al. (Reference Chaitanya, Gill, Narayanan, Joseph, Vanderwel, Zhang and Ganapathisubramani2015) that the ratio of nose radius,
 $R_{e}$
(which contains both
 $\unicode[STIX]{x1D716}$
and
 $I$
dependence), to the hydrodynamic wavelength,
 $U^{\ast }/k^{\ast }$
, is an important factor and defines the extent of gust distortion, which in turn governs the far-field noise. With the increase of jet velocity, we observe a decrease in
 $k^{\ast }R_{e}/U^{\ast }$
, resulting in a decrease in level of noise reduction. For a thinner overall aerofoil, 6 % thickness, we see the same trends as the 12 %-thickness aerofoils, although the reduction in magnitude of the overall SPL is lower for an aerofoil of 6 % thickness than 12 % thickness. At lower frequencies,
 $k=2.5$
, the trend continues; aerofoils with larger nose radii generate less far-field noise, however the difference in SPL for the thinnest aerofoil (6 %) at the highest mean flow speed (
 $80~\text{m}~\text{s}^{-1}$
) is very small. We can summarise these results by returning to the factor,
 $k^{\ast }R_{e}/U^{\ast }$
; greater values of
 $k^{\ast }R_{e}/U^{\ast }$
produce greater noise reductions.
We compare the experimental results of figure 7(a–h) to the analytical results in figure 8, which plot the far-field acoustic directivity for low-Mach-number flow (
 $M=0.06,0.24$
) at two different frequencies
 $k=2.5,5$
. The directivity,
 $D(\unicode[STIX]{x1D703})$
, is defined in (2.29), and is restricted in figure 8 to the experimentally measured range,
 $\unicode[STIX]{x1D703}\in [40^{\circ },140^{\circ }]$
.
Analytically we focus on gusts with zero spanwise wavenumber,
 $k_{3}=0$
and
 $A_{3}=0$
, since the experimental set-up is fundamentally two-dimensional. The dominant contributor to leading-edge noise for symmetric aerofoils in homogeneous isotropic turbulence arises from purely transverse disturbances (
 $k_{n}=A_{n}=0$
) (Gill, Zhang & Joseph Reference Gill, Zhang and Joseph2014), thus we take
 $k_{n}=0$
.
We require the gust to be solenoidal, therefore
 $A_{t}+A_{n}k_{n}\unicode[STIX]{x1D6FD}_{\infty }=0$
, and to ensure we ensure the magnitude of the incident gust vector far upstream is constant we set
 $A_{t}^{2}+A_{n}^{2}=1$
. Specifying
 $k_{n}$
thus completely determines the incident gust.
Analytic far-field acoustic directivity,
 $\log _{10}|D(\unicode[STIX]{x1D703})|$
, against polar angle
 $\unicode[STIX]{x1D703}$
. Legend given in figure 6.

We observe a good agreement between the experimental and analytical trends, which overall indicate that an increased nose radius (blunter nose) reduces noise.
The analytical and experimental results agree well for
 $k=5$
, with the NACA 0006 indicating a linear reduction of noise with increasing nose radius, whilst the NACA 0012 results show the
 $I=10$
result can produce more noise that the
 $I=6$
.
The analytic
 $k=2.5$
results show a weaker effect of altering nose radius on the noise produced, in agreement with the experimental measurements. The analytic results predict an increase of noise for a very blunt nose (
 $I=10$
) compared to a very sharp nose (
 $I=0$
) in the upstream direction (
 $\unicode[STIX]{x1D703}=\unicode[STIX]{x03C0}$
being the directly upstream direction) except for 6 % thickness in the lowest speed flow,
 $M=0.06$
(figure 8
f). This feature is only shown in the experimental results at the final upstream microphone location for the 12 % aerofoils. We note the analytic results neglect transition regions which heavily influence an
 $O(k^{-1/2})$
polar angle region directly upstream and downstream (Ayton Reference Ayton2016). This is equivalent to an angle of
 $36^{\circ }$
, thus we would expect potential inaccuracies at the extremities of the analytic results for
 $k=2.5$
. Further, the amplitude errors elsewhere in the analytic solution are
 $O(k^{-1})$
as we assume
 $k\gg 1$
. Thus we expect bigger errors in the lower-frequency analytic results than the higher-frequency analytic results. We also see a difference in overall pattern between the analytically predicted SPL for
 $k=2.5$
,
 $M=0.06$
– the analytic results do not decrease with increasing
 $\unicode[STIX]{x1D703}$
. We also attribute this to a lack of inclusion of a transition region for the larger
 $\unicode[STIX]{x1D703}$
values.
4.2 Mechanisms for noise generation
Having determined the trends experimentally for increasing nose radius we see good agreement with the analytical solution. We now use our analytical leading-edge solution, equation (2.21), to investigate the individual flow features that could impact the change of noise generation when nose radius is altered. We do so by considering the individual terms in the leading-edge solution given by
 $L_{1,2,3c_{1,2,3},3p}(\unicode[STIX]{x1D703})$
, as each describes a different physical process occurring in the governing equations.
We previously considered only
 $k_{n}=0$
; however, to get a full picture of the effects of all leading-edge terms we shall consider two cases here,
 $k_{n}=0,1$
. We also wish to determine the effects of higher-Mach-number flow, which are practically relevant to the leading-edge noise problem, but due to facility restrictions could not be investigated experimentally. We hence consider both low- and high-Mach-number flows analytically,
 $M=0.3,0.6$
. Finally, since a higher frequency leads to a greater difference in noise generation with varying nose radius, and the analytic results become increasingly accurate with increasing frequency, we shall focus on two high-frequency cases,
 $k=5,10$
.
We notice that
 $k_{n}$
does not explicitly feature in the terms
 $L_{3p,c_{i}}$
in the leading-edge solution (2.21), and
 $A_{n}$
is an overall factor, since the
 $H_{3}$
solution considers the distortion of the flat-plate acoustics through a locally non-uniform flow at the nose – a process that is independent of the gust. Therefore, the effect of altering
 $k_{n}$
on these terms will be an overall scaling factor only (since altering
 $k_{n}$
alters the coefficient
 $A_{n}$
). The main influence of
 $k_{n}$
lies in the
 $L_{1,2}$
terms which represent the effects of the changing surface normal direction on blocking gust velocities, and effects of the volume source generated by the gust in the locally non-uniform flow at the nose, respectively. Both processes are clearly dependent on the gust normal wavevector component. We therefore present
 $|L_{1,2}|$
for both
 $k_{n}=0,1$
, but
 $|L_{3p,c_{1,2,3}}|$
only for
 $k_{n}=0$
, in figures 10 and 11 when
 $M_{\infty }=0.6$
, and
 $|L_{1,2,3p,3c_{i}}|$
for
 $k_{n}=0$
at
 $M_{\infty }=0.3$
in figure 12. We consider five different leading-edge geometries, defined by
 $m=0.2$
,
 $0.3$
,
 $0.5$
,
 $0.7$
,
 $0.8$
, and all analytic plots share the legend shown in figure 9.
Legend for analytic results.

Polar plot of
 $L_{1,2,3p,3c_{1,2,3}}$
for different leading-edge geometries, for
 $M_{\infty }=0.6$
, and
 $k_{n}=0$
. Legend given in figure 9.

Polar plot of
 $L_{1,2}$
for different leading-edge geometries, for
 $M_{\infty }=0.6$
, and
 $k_{n}=1$
. Legend given in figure 9.

In figure 10 (
 $k_{n}=0,M_{\infty }=0.6$
), figure 11 (
 $k_{n}=1,M_{\infty }=0.6$
) and figure 12 (
 $k_{n}=0$
,
 $M_{\infty }=0.3$
) the scaling parameter
 $\unicode[STIX]{x1D716}a_{0}k^{1-m}$
is neglected, therefore we have removed the thickness and frequency scaling of the locally non-uniform mean flow at the nose (which as
 $m$
increases to give a sharper nose, reduces in magnitude). Having removed this asymptotic parameter, for each given
 $m$
, the relative magnitude of the results in figures 10–12 indicate the level of influence of that term in the total leading-edge acoustic pressure. We see that by increasing
 $m$
, the influence of
 $L_{3c_{1,2,3}}$
reduces, but the influence of
 $L_{2,3p}$
increases. This indicates that source terms (the volume source for
 $L_{2}$
, and the flat-plate acoustics for
 $L_{3p}$
) become more important as the leading edge is sharpened.
By considering the boundary condition for
 $H_{1}$
, equation (2.15b
), we see it consists of normal and tangential gust terms,
 $A_{n,t}$
, multiplied by directional terms,
 $\sin (m\unicode[STIX]{x03C0})$
and
 $\cos (m\unicode[STIX]{x03C0})$
. In the case of
 $k_{n}=0$
, the outer limit,
 $L_{1}$
shown in figure 10(a), has no tangential component (
 $A_{t}=0$
), thus the solution depends only on the (vertical) directional term
 $\sin (m\unicode[STIX]{x03C0})$
. The magnitude of
 $L_{1}$
hence varies proportionally to
 $|\sin (m\unicode[STIX]{x03C0})|$
as
 $m$
varies, thus unlike
 $L_{2,3}$
there is no trend of overall increase or decrease with increasing
 $m$
. When
 $A_{t}\neq 0$
in figure 11(a), we see
 $L_{1}$
decreases in magnitude for increasing
 $m$
. Here the variation in size of the directional terms
 $\sin (m\unicode[STIX]{x03C0})$
and
 $\cos (m\unicode[STIX]{x03C0})$
are less important, and the overall scaling in
 $m$
arising from the Fourier transform of
 $\unicode[STIX]{x1D6F7}^{m-1}$
, which represents the rate of slowing of the steady flow on approach to the frontal stagnation point, dominates. A smaller value of
 $m$
indicates a blunter nose, and hence a greater rate of slowing of the flow and a larger magnitude of the solution
 $L_{1}$
.
Figure 11(b) illustrates the effects of an asymmetric incident field on a symmetric aerofoil, as the gust distortion at the nose depends on the angle at which it approaches the aerofoil. The overall trend as
 $m$
varies agrees with the symmetric
 $k_{n}=0$
case in figure 10(b), indicating for
 $k_{n}\neq 0$
the volume source term is still promoted as
 $m$
increases.
Polar plot of
 $L_{1,2,3p,3c_{1,2,3}}$
for different leading-edge geometries, for
 $M_{\infty }=0.3$
, and
 $k_{n}=0$
. Legend given in figure 9.

We now consider the magnitudes of the
 $L_{1,2,3p,3c_{1,2,3}}$
for low Mach number,
 $M_{\infty }=0.3$
, in figure 12 and compare to the results for moderate Mach number,
 $M_{\infty }=0.6$
(figure 10). Overall all directivities are stretched horizontally for
 $M_{\infty }=0.6$
compared to
 $M_{\infty }=0.3$
due to Doppler effects, but trends when varying
 $m$
for each individual directivity function remain the same. We also see that the relative sizes of certain
 $L_{1,2,3p,3c_{1,2,3}}$
are decreased; in particular, at low Mach number,
 $L_{1,3p}$
are substantially smaller than at moderate Mach number. Thus at low Mach number, any effects of
 $L_{1,3p}$
will be less evident in the total far-field acoustic solution than at moderate Mach number.
Full aerofoil shapes (with chord length
 $2$
) used for different leading-edge geometries
 $y\sim \unicode[STIX]{x1D716}a_{0}x^{m}$
. Legend given in figure 9.

Finally, we plot the full pressure directivity,
 $|D(\unicode[STIX]{x1D703})|$
, as given by (2.29). We focus specifically on
 $k_{n}=0$
gusts. All aerofoils have the same maximum thickness, but varying leading-edge geometry, as can be seen in figure 13, produced by taking the standard NACA 4-digit profile but altering the first term from
 $x^{0.5}$
to
 $x^{m}$
. To ensure the maximum thickness is fixed across all aerofoils, different values of
 $a_{0}$
have to be chosen for different values of
 $m$
. These are given in table 2. We see from this table that the parameter
 $\unicode[STIX]{x1D716}a_{0}k^{1-m}$
is similar across the range of
 $m$
chosen for our two chosen frequencies,
 $k=5,10$
, therefore any effects seen altering the far-field noise are not caused purely by the changing scaling of the steady flow at the nose,
 $q$
(2.3).
Table of values of
 $m$
and
 $a_{0}$
chosen to ensure equal total aerofoil thickness
 $\unicode[STIX]{x1D716}=0.06$
for a modified NACA 4-digit profile, and asymptotic parameter
 $\unicode[STIX]{x1D716}a_{0}k^{1-m}$
with
 $k=5,10$
.

Figure 14 gives the directivity for
 $k_{n}=0$
and
 $M_{\infty }=0.3$
at two gust frequencies,
 $k=5,10$
; we see that as the aerofoil nose becomes blunter (decreasing
 $m$
) the noise reduces across all angles for both frequencies (as also seen in figure 8 for the comparison with experimental data). To cause this we would expect source terms, indicated by solutions
 $L_{2}$
and
 $L_{3p}$
, to add to the total noise, which is justified by the consistent trends seen in figures 10(b,c) and 14. Terms
 $L_{3c_{1,2,3}}$
likely subtract. We see similar results at frequency
 $k=5$
as those seen at
 $k=10$
, since the only influence of the frequency on the directivity is in the asymptotic scaling parameter
 $\unicode[STIX]{x1D716}a_{0}k^{1-m}$
, which affects the total size of the added thickness-related terms, but not the individual effects seen by varying
 $m$
in the
 $L_{1,2,3}$
terms.
At higher Mach number,
 $M_{\infty }=0.6$
, figure 15 for frequencies
 $k=5,10$
shows more significant modulation of the solution, due to the greater interference between leading- and trailing-edge fields. At both frequencies we see an increase of noise in the upstream region for a very blunt leading edges (
 $m=0.2$
), although elsewhere the noise is reduced as
 $m$
is decreased. This upstream increase was observed experimentally in figure 7 for a 12 % total thickness aerofoil in low-Mach-number flow. Analytically the upstream increase is greatest for
 $k=10$
. By increasing the Mach number we have increased the relative importance of terms
 $L_{1,3p}$
. We can determine that the
 $L_{1}$
term subtracts from the flat-plate term,
 $L_{0}$
, by considering the phase difference between
 $L_{1}$
and
 $L_{0}$
. Therefore, the rate of slowing of the flow on approach to the stagnation point decreases far-field noise. Since
 $L_{1}$
subtracts from the flat-plate term we do not expect this term to be contributing to the increase of noise upstream. Instead we notice that the
 $L_{3p}$
term for
 $M_{\infty }=0.6$
in figure 10(c) shows an increase in magnitude in the upstream region as
 $m$
is reduced, which is more extreme than the distortion to the upstream direction seen for
 $M_{\infty }=0.3$
in figure 12(c). We therefore attribute the increase in noise upstream seen in figure 15 to the increased upstream distortion seen in
 $L_{3p}$
at higher Mach numbers, which as a source term adds to the total noise. Specifically,
 $L_{3p}$
accounts for the distortion of the volume source generated by the flat-plate term due to the locally non-uniform mean flow around the nose. This locally non-uniform flow is directed upstream, and increases with the bluntness of the nose – thus as we decrease
 $m$
we see a distortion of the acoustics from
 $L_{3p}$
to the upstream direction, that is increasingly evident at higher Mach numbers.
Polar plot of the far-field acoustic directivity,
 $|D(\unicode[STIX]{x1D703})|$
, for different leading-edge geometries, for
 $k_{n}=0$
,
 $M_{\infty }=0.3$
. Legend given in figure 9.

Polar plot of the far-field acoustic directivity,
 $|D(\unicode[STIX]{x1D703})|$
, for different leading-edge geometries, for
 $k_{n}=0$
,
 $M_{\infty }=0.6$
. Legend given in figure 9.

5 Conclusions
In this paper we have considered the effects of local aerofoil nose geometry on leading-edge noise, both analytically and experimentally. We have seen that increasing the nose radius (to create a blunter nose) reduces the far-field noise generated for a fixed overall thickness of aerofoil for high-frequency interactions at low Mach numbers. At higher Mach numbers, the analytic solution predicts an increase of noise upstream for blunter aerofoils but a decrease downstream for blunter aerofoils. The analytic solution for the far-field acoustics is correct to two orders of magnitude in the amplitude and phase at all polar angles,
 $\unicode[STIX]{x1D703}>O(k^{-1/2})$
. We have neglected the transition regions formally required for a full matched asymptotic solution and accuracy across all observer angles since these transition solutions have an effect only at small downstream angles,
 $\unicode[STIX]{x1D703}=O(k^{-1/2})$
.
The analytic solution, which extends previous analytic work for parabolic leading edges, qualitatively agrees with the experimental findings, and has been used to understand the reasons behind the noise generated by different leading-edge geometries. Importantly, it is not just the overall steady flow speed near the nose (the asymptotic scaling parameter
 $\unicode[STIX]{x1D716}a_{0}k^{1-m}$
) that has an effect on the total noise; we have seen that volume sources are promoted for sharper leading edges, increasing noise, and the greater the rate of slowing of the steady velocity on approach to the nose the lower the overall sound levels. There is also a difference in the importance of acoustic generation mechanisms between low or moderate Mach numbers; the volume source term and horizontal blocking term are substantially smaller than other terms at low Mach numbers (
 $M_{\infty }=0.3$
), but are comparable with other terms at moderate Mach number (
 $M_{\infty }=0.6$
). At moderate Mach numbers, the analytic solution predicts a blunter leading edge can increase far-field noise in the upstream direction for high-frequency gusts. This upstream increase has also been observed when increasing total aerofoil thickness in the numerical results of Lockard & Morris (Reference Lockard and Morris1998) at
 $M_{\infty }=0.5$
.
Aerofoil thickness remains the main geometric parameter controlling turbulence interaction noise (shown previously). Local leading-edge geometry, such as nose radius, nevertheless is an important parameter for thin aerofoils at high frequencies, particularly when the gust wavelength is comparable to nose radius. Therefore, attempts to predict interaction noise based on single values of thickness-chord ratio,
 $\unicode[STIX]{x1D716}$
, and frequency,
 $k$
, are likely to be inaccurate for thin aerofoils since the nose-radius parameter,
 $m$
, also plays a key role. The ability to reduce aerofoil interaction noise by increasing the nose radius but maintaining a constant overall thickness could be very useful for controlling aeroengine noise, where increasing blade thickness is not practical.
Acknowledgements
L.J.A. is grateful to Sidney Sussex College for providing financial support. P.C. is grateful to Professor P. Joseph for supporting the experimental test campaign at ISVR, Southampton.
Appendix A. Outer limit of
$H_{2}$
solution

Upon evaluating the acoustic parts of
 $H_{2c,p}$
using the method of steepest descents, we obtained the outer limit as
 $$\begin{eqnarray}H_{2}\sim \frac{\text{e}^{\text{i}kwr}}{\sqrt{kr}}L_{2}(\unicode[STIX]{x1D703}),\end{eqnarray}$$
where
 $$\begin{eqnarray}\displaystyle L_{2}(\unicode[STIX]{x1D703}) & = & \displaystyle \frac{-\text{e}^{-\unicode[STIX]{x03C0}\text{i}m/2}(1-\text{e}^{2\unicode[STIX]{x03C0}\text{i}m})\unicode[STIX]{x1D6E4}(m)\sqrt{2\unicode[STIX]{x03C0}w}|\sin \unicode[STIX]{x1D703}|\text{e}^{-\unicode[STIX]{x03C0}\text{i}/4}}{16\unicode[STIX]{x03C0}(1-m)(\unicode[STIX]{x1D6FF}^{2}+k_{n}^{2})(\unicode[STIX]{x1D6FF}-w\cos \unicode[STIX]{x1D703})^{m}(-w\cos \unicode[STIX]{x1D703}-\unicode[STIX]{x1D706}_{1})(-w\cos \unicode[STIX]{x1D703}-\unicode[STIX]{x1D706}_{2})}\nonumber\\ \displaystyle & & \displaystyle \times \,\left(\frac{(\unicode[STIX]{x1D6FF}-w\cos \unicode[STIX]{x1D703})f_{1}(-w\cos \unicode[STIX]{x1D703})+\text{i}k_{n}\,f_{2}(-w\cos \unicode[STIX]{x1D703})}{\sqrt{(-w\cos \unicode[STIX]{x1D703})^{2}-w^{2}}}-\text{sgn}(\unicode[STIX]{x1D6F9})f_{2}(-w\cos \unicode[STIX]{x1D703})\right)\nonumber\\ \displaystyle & & \displaystyle -\,\frac{\text{sgn}(\unicode[STIX]{x1D6F9})\text{e}^{-\unicode[STIX]{x03C0}\text{i}m/2}(1-\text{e}^{2\unicode[STIX]{x03C0}\text{i}m})\unicode[STIX]{x1D6E4}(m)\sqrt{2\unicode[STIX]{x03C0}w}|\sin \unicode[STIX]{x1D703}|\text{e}^{-\unicode[STIX]{x03C0}\text{i}/4}}{16\unicode[STIX]{x03C0}(1-m)(\unicode[STIX]{x1D6FF}^{2}+k_{n}^{2})\sqrt{-w\cos \unicode[STIX]{x1D703}+w}}\nonumber\\ \displaystyle & & \displaystyle \times \,\left\{2(-\unicode[STIX]{x1D6FF}C_{4}+k_{n}C_{3}){\mathcal{H}}\left(\frac{1}{2}-m\right)\right.\nonumber\\ \displaystyle & & \displaystyle -\,\left(\frac{\sqrt{w+w\cos \unicode[STIX]{x1D703}}f_{2}(-w\cos \unicode[STIX]{x1D703})}{(\unicode[STIX]{x1D6FF}-w\cos \unicode[STIX]{x1D703})^{m}(-w\cos \unicode[STIX]{x1D703}-\unicode[STIX]{x1D706}_{2})}+\frac{\sqrt{\unicode[STIX]{x1D706}_{1}+w}f_{2}(\unicode[STIX]{x1D706}_{1})}{(\unicode[STIX]{x1D706}_{1}+\unicode[STIX]{x1D6FF})^{m}(\unicode[STIX]{x1D706}_{1}-\unicode[STIX]{x1D706}_{2})}\right)\frac{1}{-w\cos \unicode[STIX]{x1D703}-\unicode[STIX]{x1D706}_{1}}\nonumber\\ \displaystyle & & \displaystyle +\,\left.\frac{(\unicode[STIX]{x1D706}_{2}+\unicode[STIX]{x1D6FF})f_{2}(\unicode[STIX]{x1D706}_{2})+\text{i}k_{n}f_{1}(\unicode[STIX]{x1D706}_{2})}{\sqrt{\unicode[STIX]{x1D706}_{2}-w}(\unicode[STIX]{x1D706}_{2}+\unicode[STIX]{x1D6FF}^{\prime })^{m}(\unicode[STIX]{x1D706}_{2}+w\cos \unicode[STIX]{x1D703})(-w\cos \unicode[STIX]{x1D703}-\unicode[STIX]{x1D706}_{1})}\right\},\end{eqnarray}$$
with
 ${\mathcal{H}}$
denoting the Heaviside function.
Appendix B. Solution for
$H_{3c}$
and
$H_{3p}$


Here we find the solution to (2.20). First, we evaluate the
 $H_{0}$
terms in the governing equation and boundary condition thus we must solve
 $$\begin{eqnarray}\displaystyle \hspace{-10.00002pt}D(H_{3}) & = & \displaystyle -\frac{A_{n}\text{sgn}(\unicode[STIX]{x1D6F9})Cw^{2}}{\unicode[STIX]{x1D6FD}_{\infty }\unicode[STIX]{x03C0}\sqrt{\unicode[STIX]{x1D6FF}+w}}\left(R^{m-1}\cos ((1-m)\unicode[STIX]{x1D703}+m\unicode[STIX]{x03C0})\int _{\infty }^{\infty }\left[\frac{1}{(\unicode[STIX]{x1D706}+\unicode[STIX]{x1D6FF})\sqrt{\unicode[STIX]{x1D706}+w}}\right.\right.\nonumber\\ \displaystyle & & \displaystyle \left.-\,\frac{(\unicode[STIX]{x1D6FE}+1)M_{\infty }^{4}}{2\unicode[STIX]{x1D6FD}_{\infty }^{4}w^{2}}\frac{\unicode[STIX]{x1D706}+\unicode[STIX]{x1D6FF}}{\sqrt{\unicode[STIX]{x1D706}+w}}\right]\text{e}^{a(\unicode[STIX]{x1D706},\unicode[STIX]{x1D6F7},\unicode[STIX]{x1D6F9})}\,\text{d}\unicode[STIX]{x1D706}\nonumber\\ \displaystyle & & \displaystyle +\,\left.\frac{\text{i}(\unicode[STIX]{x1D6FE}+1)M_{\infty }^{4}}{2\unicode[STIX]{x1D6FD}_{\infty }^{4}w^{2}}(1-m)R^{m-2}\cos ((2-m)\unicode[STIX]{x1D703}+m\unicode[STIX]{x03C0})\int _{-\infty }^{\infty }\frac{\text{e}^{a(\unicode[STIX]{x1D706},\unicode[STIX]{x1D6F7},\unicode[STIX]{x1D6F9})}}{\sqrt{\unicode[STIX]{x1D706}+\unicode[STIX]{x1D6FF}}}\,\text{d}\unicode[STIX]{x1D706}\right),\end{eqnarray}$$
 $$\begin{eqnarray}\displaystyle \left.\frac{\unicode[STIX]{x2202}H_{3}}{\unicode[STIX]{x2202}\unicode[STIX]{x1D6F9}}\right|_{\substack{ \unicode[STIX]{x1D6F7}>0 \\ \unicode[STIX]{x1D6F9}=0\pm }}=-\frac{A_{n}M_{\infty }^{2}C(1-m)\sin (m\unicode[STIX]{x03C0})}{2\unicode[STIX]{x03C0}\unicode[STIX]{x1D6FD}_{\infty }^{2}\sqrt{\unicode[STIX]{x1D6FF}+w}\unicode[STIX]{x1D6F7}^{2-m}}\int _{-\infty }^{\infty }\frac{\text{e}^{-\text{i}\unicode[STIX]{x1D706}\unicode[STIX]{x1D6F7}}}{(\unicode[STIX]{x1D706}+\unicode[STIX]{x1D6FF})\sqrt{\unicode[STIX]{x1D706}+w}}\,\text{d}\unicode[STIX]{x1D706}. & & \displaystyle\end{eqnarray}$$
By considering a particular solution of the form
 $$\begin{eqnarray}f(\unicode[STIX]{x1D703})\int _{-\infty }^{\infty }B(\unicode[STIX]{x1D706})\text{e}^{a(\unicode[STIX]{x1D706},\unicode[STIX]{x1D6F7},\unicode[STIX]{x1D6F9})}\,\text{d}\unicode[STIX]{x1D706},\end{eqnarray}$$
with
 $$\begin{eqnarray}\displaystyle f(\unicode[STIX]{x1D703}) & = & \displaystyle \left\{R^{m-1}\cos ((1-m)\unicode[STIX]{x1D703}+m\unicode[STIX]{x03C0}),\,R^{m-1}\sin ((1-m)\unicode[STIX]{x1D703}+m\unicode[STIX]{x03C0}),\right.\nonumber\\ \displaystyle & & \displaystyle \quad \left.R^{m}\cos (-m\unicode[STIX]{x1D703}+m\unicode[STIX]{x03C0}),\,R^{m}\sin (-m\unicode[STIX]{x1D703}+m\unicode[STIX]{x03C0})\right\},\end{eqnarray}$$
we can find appropriate
 $B(\unicode[STIX]{x1D706})$
functions to satisfy the forcing in the governing equation.
We obtain a particular solution
 $$\begin{eqnarray}\displaystyle H_{3p} & & \displaystyle =-\frac{A_{n}\text{sgn}(\unicode[STIX]{x1D6F9})Cw^{2}}{\unicode[STIX]{x03C0}\sqrt{\unicode[STIX]{x1D6FF}+w}}\left[R^{m}\cos (-m\unicode[STIX]{x1D703}+m\unicode[STIX]{x03C0})\int _{-\infty }^{\infty }\frac{\text{i}\unicode[STIX]{x1D706}}{2mw^{2}}\left(\frac{1}{(\unicode[STIX]{x1D706}+\unicode[STIX]{x1D6FF})\sqrt{\unicode[STIX]{x1D706}+w}}\right.\right.\nonumber\\ \displaystyle & & \displaystyle \left.-\,\frac{(\unicode[STIX]{x1D6FE}+1)M_{\infty }^{4}}{2\unicode[STIX]{x1D6FD}_{\infty }^{4}w^{2}}\frac{\unicode[STIX]{x1D706}+\unicode[STIX]{x1D6FF}}{\sqrt{\unicode[STIX]{x1D706}+w}}\right)\text{e}^{a(\unicode[STIX]{x1D706},\unicode[STIX]{x1D6F7},\unicode[STIX]{x1D6F9})}\,\text{d}\unicode[STIX]{x1D706}+R^{m}\sin (-m\unicode[STIX]{x1D703}+m\unicode[STIX]{x03C0})\nonumber\\ \displaystyle & & \displaystyle \times \,\int _{-\infty }^{\infty }\frac{-\text{sgn}(\unicode[STIX]{x1D6F9})}{2mw^{2}}\left(\frac{\sqrt{\unicode[STIX]{x1D706}-w}}{\unicode[STIX]{x1D706}+\unicode[STIX]{x1D6FF}}-\frac{(\unicode[STIX]{x1D6FE}+1)M_{\infty }^{4}}{2\unicode[STIX]{x1D6FD}_{\infty }^{4}w^{2}}\sqrt{\unicode[STIX]{x1D706}-w}(\unicode[STIX]{x1D706}+\unicode[STIX]{x1D6FF})\right)\text{e}^{a(\unicode[STIX]{x1D706},\unicode[STIX]{x1D6F7},\unicode[STIX]{x1D6F9})}\,\text{d}\unicode[STIX]{x1D706}\nonumber\\ \displaystyle & & \displaystyle +\,R^{m-1}\cos ((1-m)\unicode[STIX]{x1D703}+m\unicode[STIX]{x03C0})\int _{-\infty }^{\infty }\frac{(\unicode[STIX]{x1D6FE}+1)M_{\infty }^{4}}{4\unicode[STIX]{x1D6FD}_{\infty }^{4}w^{4}}\frac{\unicode[STIX]{x1D706}}{\sqrt{\unicode[STIX]{x1D706}+w}}\text{e}^{a(\unicode[STIX]{x1D706},\unicode[STIX]{x1D6F7},\unicode[STIX]{x1D6F9})}\,\text{d}\unicode[STIX]{x1D706}\nonumber\\ \displaystyle & & \displaystyle \left.+\,R^{m-1}\sin ((1-m)\unicode[STIX]{x1D703}+m\unicode[STIX]{x03C0})\int _{-\infty }^{\infty }\frac{\text{i}\,\text{sgn}(\unicode[STIX]{x1D6F9})(\unicode[STIX]{x1D6FE}+1)M_{\infty }^{4}}{4\unicode[STIX]{x1D6FD}_{\infty }^{4}w^{4}}\sqrt{\unicode[STIX]{x1D706}-w}\text{e}^{a(\unicode[STIX]{x1D706},\unicode[STIX]{x1D6F7},\unicode[STIX]{x1D6F9})}\,\text{d}\unicode[STIX]{x1D706}\right].\nonumber\\ \displaystyle & & \displaystyle\end{eqnarray}$$
This solution, like that for the parabolic leading edge, is singular as
 $R\rightarrow 0$
, which is not a permitted solution of the governing equation. To correct this singularity, we introduce a homogeneous solution that has the required small
 $R$
behaviour to cancel the singularity. This process is very similar to that in Tsai (Reference Tsai1992) and therefore not repeated here. We find the additional solution we must include is
 $$\begin{eqnarray}\displaystyle H_{3p}^{c} & = & \displaystyle \frac{A_{n}C\sqrt{\unicode[STIX]{x03C0}}\text{e}^{\unicode[STIX]{x03C0}\text{i}/4}}{m\sqrt{\unicode[STIX]{x1D6FF}+w}}\frac{(\unicode[STIX]{x1D6FE}+1)M_{\infty }^{4}}{8\unicode[STIX]{x1D6FD}_{\infty }^{4}w^{2}}\nonumber\\ \displaystyle & & \displaystyle \times \,\left[\frac{\text{i}(2m-3)Ha_{(5/2)-m}(w\unicode[STIX]{x1D6F7})\cos \left(\left(\frac{5}{2}-m\right)\unicode[STIX]{x1D703}+m\unicode[STIX]{x03C0}\right)}{\unicode[STIX]{x1D6E4}\left(\frac{5}{2}-m\right)}\left(\frac{w}{2}\right)^{(5/2)-m}\right.\nonumber\\ \displaystyle & & \displaystyle \left.-\,\frac{(-2\unicode[STIX]{x1D6FF}+w-2mw)Ha_{(3/2)-m}(w\unicode[STIX]{x1D6F7})\cos \left(\left(\frac{3}{2}-m\right)\unicode[STIX]{x1D703}+m\unicode[STIX]{x03C0}\right)}{\unicode[STIX]{x1D6E4}\left(\frac{3}{2}-m\right)}\left(\frac{w}{2}\right)^{(3/2)-m}\right],\nonumber\\ \displaystyle & & \displaystyle\end{eqnarray}$$
where
 $Ha$
are Hankel functions of the first kind.
We now require a complementary solution to (B 1) that satisfies
 $$\begin{eqnarray}\displaystyle \left.\frac{\unicode[STIX]{x2202}H_{3c}}{\unicode[STIX]{x2202}\unicode[STIX]{x1D6F9}}\right|_{\substack{ \unicode[STIX]{x1D6F7}>0 \\ \unicode[STIX]{x1D6F9}=0\pm }} & = & \displaystyle -\frac{A_{n}M_{\infty }^{2}C(1-m)\sin (m\unicode[STIX]{x03C0})}{2\unicode[STIX]{x03C0}\unicode[STIX]{x1D6FD}_{\infty }^{2}\sqrt{\unicode[STIX]{x1D6FF}+w}\unicode[STIX]{x1D6F7}^{2-m}}\nonumber\\ \displaystyle & & \displaystyle \times \,\int _{-\infty }^{\infty }\frac{\text{e}^{-\text{i}\unicode[STIX]{x1D706}\unicode[STIX]{x1D6F7}}}{(\unicode[STIX]{x1D706}+\unicode[STIX]{x1D6FF})\sqrt{\unicode[STIX]{x1D706}+w}}\,\text{d}\unicode[STIX]{x1D706}-\left.\frac{\unicode[STIX]{x2202}H_{3p}}{\unicode[STIX]{x2202}\unicode[STIX]{x1D6F9}}\right|_{\substack{ \unicode[STIX]{x1D6F7}>0 \\ \unicode[STIX]{x1D6F9}=0\pm }}-\left.\frac{\unicode[STIX]{x2202}H_{3p}^{c}}{\unicode[STIX]{x2202}\unicode[STIX]{x1D6F9}}\right|_{\substack{ \unicode[STIX]{x1D6F7}>0 \\ \unicode[STIX]{x1D6F9}=0\pm }}.\end{eqnarray}$$
Analogously to the parabolic case can write the boundary condition as
 $$\begin{eqnarray}\left.\frac{\unicode[STIX]{x2202}H_{3c}}{\unicode[STIX]{x2202}\unicode[STIX]{x1D6F9}}\right|_{\substack{ \unicode[STIX]{x1D6F7}>0 \\ \unicode[STIX]{x1D6F9}=0\pm }}=d_{1}(\unicode[STIX]{x1D6F7})+d_{2}(\unicode[STIX]{x1D6F7})+d_{3}(\unicode[STIX]{x1D6F7}),\end{eqnarray}$$
and define
 $H_{3c}=H_{3c_{1}}+H_{3c_{2}}+H_{3c_{3}}$
so that
 $H_{3c_{i}}$
satisfies the
 $d_{i}$
term in the boundary condition.
The
 $d_{i}$
are defined as
 $$\begin{eqnarray}\displaystyle d_{1}(\unicode[STIX]{x1D6F7})=\frac{2A_{n}C\unicode[STIX]{x1D6FD}_{\infty }}{\sqrt{\unicode[STIX]{x1D6FF}^{2}-w^{2}}}\sin (m\unicode[STIX]{x03C0})\text{e}^{\text{i}\unicode[STIX]{x1D6FF}\unicode[STIX]{x1D6F7}}\left(\text{i}\unicode[STIX]{x1D6FF}\unicode[STIX]{x1D6F7}^{m-1}-\frac{1}{m}(\unicode[STIX]{x1D6FF}^{2}-w^{2})\unicode[STIX]{x1D6F7}^{m}\right), & & \displaystyle\end{eqnarray}$$
 $$\begin{eqnarray}\displaystyle d_{2}(\unicode[STIX]{x1D6F7}) & = & \displaystyle \frac{2A_{n}C\unicode[STIX]{x1D6FD}_{\infty }\,w}{\sqrt{\unicode[STIX]{x03C0}}\sqrt{\unicode[STIX]{x1D6FF}+w}(\unicode[STIX]{x1D6FF}-w)}\left(\frac{1}{m}-1\right)\text{e}^{\unicode[STIX]{x03C0}\text{i}/4+\text{i}w\unicode[STIX]{x1D6F7}}\sin (m\unicode[STIX]{x03C0})\nonumber\\ \displaystyle & & \displaystyle \times \,\left(1-\frac{(\unicode[STIX]{x1D6FE}+1)M_{\infty }^{4}}{2\unicode[STIX]{x1D6FD}_{\infty }^{4}w^{2}}(\unicode[STIX]{x1D6FF}-w)^{2}\right)\frac{1}{\unicode[STIX]{x1D6F7}^{(3/2)-m}},\end{eqnarray}$$
 $$\begin{eqnarray}\displaystyle d_{3}(\unicode[STIX]{x1D6F7}) & = & \displaystyle \frac{A_{n}C\unicode[STIX]{x1D6FD}_{\infty }}{\sqrt{\unicode[STIX]{x03C0}}\sqrt{\unicode[STIX]{x1D6FF}+w}}\sin (m\unicode[STIX]{x03C0})\text{e}^{\text{i}w\unicode[STIX]{x1D6F7}}\left\{\sqrt{\unicode[STIX]{x03C0}}\text{e}^{-3\unicode[STIX]{x03C0}\text{i}/4}\unicode[STIX]{x1D6F7}^{m-(3/2)}\left[\left(\frac{1}{m}-2\right)-\frac{2\text{i}}{m}(\unicode[STIX]{x1D6FF}-2w)\unicode[STIX]{x1D6F7}\right]\right.\nonumber\\ \displaystyle & & \displaystyle +\,\sqrt{\unicode[STIX]{x03C0}}\frac{(\unicode[STIX]{x1D6FE}+1)M_{\infty }^{4}}{2\unicode[STIX]{x1D6FD}_{\infty }^{4}w^{2}}\text{e}^{\unicode[STIX]{x03C0}\text{i}/4}\unicode[STIX]{x1D6F7}^{m-1}\left[\left(4-\frac{15}{4m}-m\right)\frac{1}{\unicode[STIX]{x1D6F7}^{5/2}}\right.\nonumber\\ \displaystyle & & \displaystyle \left.\left.+\,\text{i}\left(-6w+\frac{9w}{2m}+2mw+\unicode[STIX]{x1D6FF}-\frac{3\unicode[STIX]{x1D6FF}}{2m}\right)\frac{1}{\unicode[STIX]{x1D6F7}^{3/2}}\right]\right\}\nonumber\\ \displaystyle & & \displaystyle -\,\frac{2A_{n}C\unicode[STIX]{x1D6FD}_{\infty }w}{\sqrt{\unicode[STIX]{x03C0}}\sqrt{\unicode[STIX]{x1D6FF}+w}(\unicode[STIX]{x1D6FF}-w)}\left(\frac{1}{m}-1\right)\text{e}^{\text{i}w\unicode[STIX]{x1D6F7}+\unicode[STIX]{x03C0}\text{i}/4}\frac{\sin (m\unicode[STIX]{x03C0})}{\unicode[STIX]{x1D6F7}^{(3/2)-m}}\nonumber\\ \displaystyle & & \displaystyle -\,\frac{A_{n}C\unicode[STIX]{x1D6FD}_{\infty }}{\sqrt{\unicode[STIX]{x1D6FF}^{2}-w^{2}}}\sin (m\unicode[STIX]{x03C0})\text{e}^{\text{i}\unicode[STIX]{x1D6FF}\unicode[STIX]{x1D6F7}}\left[\text{i}\unicode[STIX]{x1D6FF}\unicode[STIX]{x1D6F7}^{m-1}-\frac{1}{m}(\unicode[STIX]{x1D6FF}^{2}-w^{2})\unicode[STIX]{x1D6F7}^{m}\right]\text{erfc}\left(\text{e}^{\unicode[STIX]{x03C0}\text{i}/4}\sqrt{(\unicode[STIX]{x1D6FF}-w)\unicode[STIX]{x1D6F7}}\right)\nonumber\\ \displaystyle & & \displaystyle +\,\frac{A_{n}M_{\infty }^{2}C}{\unicode[STIX]{x1D6FD}_{\infty }\sqrt{\unicode[STIX]{x1D6FF}^{2}-w^{2}}}\frac{\sin (m\unicode[STIX]{x03C0})}{\unicode[STIX]{x1D6F7}^{2-m}}\text{e}^{\text{i}\unicode[STIX]{x1D6FF}\unicode[STIX]{x1D6F7}}\text{erf}\left(\text{e}^{\unicode[STIX]{x03C0}\text{i}/4}(\unicode[STIX]{x1D6FF}-w)\unicode[STIX]{x1D6F7}\right)\nonumber\\ \displaystyle & & \displaystyle +\,\frac{2A_{n}C\unicode[STIX]{x1D6FD}_{\infty }\sqrt{\unicode[STIX]{x03C0}}\text{e}^{\unicode[STIX]{x03C0}\text{i}/4}}{\sqrt{\unicode[STIX]{x1D6FF}+w}m}\frac{(\unicode[STIX]{x1D6FE}+1)M_{\infty }^{4}}{8\unicode[STIX]{x1D6FD}_{\infty }^{4}w^{2}}\frac{\sin (m\unicode[STIX]{x03C0})}{\unicode[STIX]{x1D6F7}}\nonumber\\ \displaystyle & & \displaystyle \times \,\left[\frac{-\text{i}\left(\frac{5}{2}-m\right)(2m-3)}{\unicode[STIX]{x1D6E4}\left(\frac{5}{2}-m\right)}Ha_{(5/2)-m}(w\unicode[STIX]{x1D6F7})\left(\frac{w}{2}\right)^{(5/2)-m}\right.\nonumber\\ \displaystyle & & \displaystyle \left.+\,\frac{(\frac{3}{2}-m)(-2\unicode[STIX]{x1D6FF}+w-2mw)}{\unicode[STIX]{x1D6E4}\left(\frac{3}{2}-m\right)}Ha_{(3/2)-m}(w\unicode[STIX]{x1D6F7})\left(\frac{w}{2}\right)^{(3/2)-m}\right].\end{eqnarray}$$
The solutions for
 $H_{3c_{i}}$
are then give by
 $$\begin{eqnarray}H_{3c_{i}}=\frac{-\text{sgn}(\unicode[STIX]{x1D6F9})}{2\unicode[STIX]{x03C0}}\int _{-\infty }^{\infty }F_{+i}(\unicode[STIX]{x1D706})\frac{\text{e}^{a(\unicode[STIX]{x1D706},\unicode[STIX]{x1D6F7},\unicode[STIX]{x1D6F9})}}{\sqrt{\unicode[STIX]{x1D706}+\unicode[STIX]{x1D6FF}}}\,\text{d}\unicode[STIX]{x1D706},\end{eqnarray}$$
where
 $$\begin{eqnarray}F_{+i}(\unicode[STIX]{x1D706})=\frac{1}{2\unicode[STIX]{x03C0}\text{i}}\int _{C_{+}}\frac{\text{d}\unicode[STIX]{x1D705}}{\sqrt{\unicode[STIX]{x1D705}-w}(\unicode[STIX]{x1D705}-\unicode[STIX]{x1D706})}\int _{0}^{\infty }d_{i}(x)\text{e}^{\text{i}\unicode[STIX]{x1D705}x}\,\text{d}x,\end{eqnarray}$$
and
 $C_{+}$
is a contour parallel to but slightly above the real line.
The outer limits of
 $H_{3c_{i}}$
are
 $$\begin{eqnarray}H_{3c_{i}}\sim L_{3c_{i}}(\unicode[STIX]{x1D703})\frac{\text{e}^{\text{i}kwr}}{\sqrt{kr}},\end{eqnarray}$$
where
 $$\begin{eqnarray}L_{3c_{i}}=-F_{+i}(-w\cos \unicode[STIX]{x1D703})\text{sgn}(\unicode[STIX]{x1D703})\cos \frac{\unicode[STIX]{x1D703}}{2}\frac{\text{e}^{-\unicode[STIX]{x03C0}\text{i}/4}}{\sqrt{\unicode[STIX]{x03C0}}}.\end{eqnarray}$$
As with the parabolic leading-edge case,
 $L_{3c_{2}}$
is singular at
 $\unicode[STIX]{x1D703}=0$
, indicating the need for a uniformly valid far-field expansion of
 $H_{3c_{2}}$
for small
 $\unicode[STIX]{x1D703}$
values. The leading-edge transition solution then exists in this region of small
 $\unicode[STIX]{x1D703}$
values and acts to ensure the (total) normal velocity along the whole rigid aerofoil surface is zero. These two features only take effect for small
 $\unicode[STIX]{x1D703}$
values, and since we do not calculate the transition solution, we shall not calculate a uniformly valid expansion of
 $H_{3c_{2}}$
here.