I. INTRODUCTION
Magnetic order in intrinsically nonmagnetic solids due to the influence of hydrogen has been theoretically shown to be possible Reference Duplock, Scheffler and Lindan1–Reference Assadi, Zheng, Li and Ringer5 and experimentally found in graphite Reference Ohldag, Esquinazi, Arenholz, Spemann, Rothermel, Setzer and Butz6,Reference Barzola-Quiquia, Böhlmann, Esquinazi, Schadewitz, Ballestar, Dusari, Schultze-Nobre and Kersting7 as well as in undoped Reference Singhal, Samariya, Kumar, Xing, Deshpande, Shripathi and Baggio-Saitovitch8 and doped Reference Lee, Park, Jeong, Yee, Cho, Jung and Chadi9,Reference Zhang, Qin, Cao, Yang, Si, Zhong, Wu, Xu and Xu10 ZnO samples. Although the detailed reason for triggering or enhancement of the magnetic order depends on the compound, the observed effect can be included in the nowadays general phenomenon in magnetism known as defect-induced magnetism (DIM). Reference Stoneham11–Reference Ogale14 A recently published work showed that hydrogen plasma treatment at low energies of implantation (∼300 eV) and relatively low temperatures (T < 700 K) can trigger magnetic order at room temperature in ZnO bulk single crystals after implantation of a few atomic % H. Reference Khalid, Esquinazi, Spemann, Anwand and Brauer15,Reference Khalid and Esquinazi16 The observed hysteresis loops in magnetization, the anomalous Hall effect (AHE) as well as the observation of an anisotropic magnetoresistance (AMR) in the same crystalline samples left no doubt on the existence of magnetic order, Reference Khalid and Esquinazi16 whose origin is related to the implantation of hydrogen in the near surface region. Reference Khalid, Esquinazi, Spemann, Anwand and Brauer15
Although the DIM phenomenon can be observed in a large number of compounds, the obtained magnetization values are in general much smaller than that theoretically expected if the defects or ad atoms were uniformly distributed in the appropriate places of the corresponding atomic lattices. Due to the lack of appropriate defect engineering, the usual samples with DIM are not magnetically homogeneous. One possibility to increase the amount of magnetic mass would be to decrease the total size of the sample. In this way, one may expect to get micrometer-large regions magnetically homogeneous and with higher magnetization values. On the other hand, upon the size of magnetic domains and the lack or not of magnetic anisotropy, decreasing the sample size might affect the remnant magnetization. In the particular case of plasma-treated ZnO at energies of about 300 eV, the studies indicate that the magnetism is concentrated in a near-surface region of a few tens of nanometers. Reference Khalid, Esquinazi, Spemann, Anwand and Brauer15 Due to these reasons, experiments in small size samples are of importance. The aim of this experimental work is therefore to check whether hydrogen plasma-treated ZnO microwires show similar magnetic effects that those observed in large ZnO single crystals. The obtained magnetotransport results, in particular the negative magnetoresistance (MR), indicate that upon details of the treatment, such as time and temperature, hydrogen plasma can trigger magnetic response in the grown ZnO microwires similar to that found in ZnO crystals that, however, vanishes at temperatures around 50 K.
II. SAMPLE PREPARATION AND EXPERIMENTAL DETAILS
Microwires of ZnO were prepared by carbothermal process. In this synthesis method, a pellet of ZnO/graphite target (mass ratio of 1:1) was introduced in a quartz tube inside a tubular furnace at 1150 °C for 1 h in air and at atmosphere pressure. The shape of the obtained wires was measured using a scanning electron microscope (Nova NanoLab 200, FEI Company, Hillsboro, OR). The wires presented hexagonal morphology with the c-axis as the main wire growth axis. The studied wires have a diameter between 5 and 13 μm and a length between 70 and 270 μm.
The microwires were fixed on a Si/SiN substrate to perform the plasma treatment. The ZnO microwires were exposed to remote hydrogen DC plasma in a parallel-plate configuration. The substrates with the wires were mounted on a heater block hold at a specific temperature for a specific time and placed ∼100 mm downstream from the plasma with a bias voltage that provides 300 V of energy for the H+ implantation. The bias current was 60 μA measured during the plasma treatment. The pressure in the chamber during the process was maintained at 0.5 mbar. The ZnO microwires were plasma treated for 1 h at room temperature (RT), 373, 573, and 773 K, hereafter called ZRT, Z1, Z3, Z5 and one sample for 3 h at 373 K (Z1-3). After the treatment, two contacts were prepared using gold wires clenched with indium on top of the wire for the transport measurements. All the transport data presented were taken in the ohmic regime. The magnetotransport measurements were performed in an He-cryostat with a magnetic field of up to 8 T. The rotating sample holder allowed measurements of the magnetotransport properties at fields applied normal to the electrical current direction applied in the main wire axis or parallel to the substrate. On the latest configuration, an angle between 10 and 30° for all the studied wires was estimated to exist between the wire's main axis and the applied field.
Impedance spectroscopy was carried out with an Agilent 4294A precision impedance analyzer (Böblingen, Deutschland) within the frequency range 40 Hz–2 MHz. To model the obtained Nyquist plots, Zview® software was used.
III. RESULTS AND DISCUSSION
A. Morphology
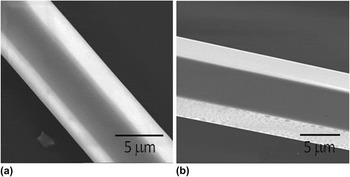
Figure 1 shows scanning electronic microscope pictures of the virgin and 373 K-treated ZnO wires, as an example. All the treated wires present comparable characteristics. Both ZnO wires show a smooth surface with similar main characteristics. The hexagonal morphology indicates a growth in the c-axis direction and a wurzite hexagonal structure as expected since it is the most stable structure of ZnO. The implantation of H+ at different temperatures does not appear to produce substantial damage at the wire surface. Therefore, we think that the observed changes in the transport properties presented below are due to the H+ implantation within the lattice structure and not due to a surface damage contribution. Note that in the case of our microwires, the H+ implantation is done in other crystallographic direction as that used for the ZnO single crystals Reference Khalid and Esquinazi16 since the c-axis in the microwires is parallel to their surface. This issue may produce a change in the transport response after implantation.
Scanning electron microscopy of ZnO wire: (a) as grown, (b) after H+ treatment at 573 K for 1 h. The different colors or contrasts are due to the hexagonal structure of the microwires.

B. Impedance spectroscopy at room temperature
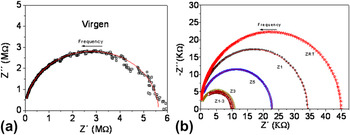
Figure 2 shows the room temperature Nyquist diagram of the as synthesized ZnO wire and ZnO wires H+ treated at different temperatures. At room temperature, a single arc is observed for all the samples. Its intersection at low frequencies gives the total resistance of the sample. With the help of Zview® software, such a system can be well modeled by a simple R/C (resistance/capacitance) contribution. Thus, the equation that describes the ac response of the different wires is given by
 $$Z^* = Z\prime + iZ \Prime = {\rm{ }}R0 + (1/(R{\rm{g}} + i{\rm{\omega }}C{\rm{g}})\quad ,$$
where R0 is the total resistance due to an external component, as wiring or double layer due to the metallic contacts and the thin film, Rg and Cg are the resistance and capacitance from the wires that dominate in the whole frequency range.
Nyquist plot of (a) virgen ZnO wires and (b) ZnO wires H+ treated at different temperatures.

Resistance values depend on the diameter and length of the wires. The capacitances obtained Cg ∼ 10−11 F from the fits to the used model for the untreated wire, Fig. 2(a), and H+-treated wires, Fig. 2(b), indicate a single conduction process through the grain core or bulk. This suggests that the wires are most likely single crystalline structured. This result indicates that there are no substantial changes in the conduction process due to the incorporation of H+ in the ZnO wires. At room temperature and within experimental error, the Nyquist diagrams do not reveal the existence of secondary phases.
C. Temperature dependence of the resistivity
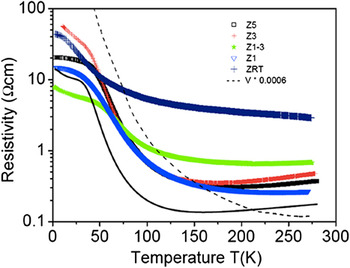
Figure 3 shows the temperature dependence of the resistivity of all samples we have prepared. The temperature dependence of the resistivity of the virgin sample (V) indicates a semiconducting-like behavior but with an activation energy of ∼73 meV. This activation energy may reflect both the promotion of electrons from defect levels to the conduction band as well as the thermionic emission of electrons over grain boundary barriers. This conduction mechanism affects the resistivity behavior of the ZnO wire in its virgin untreated state. After the H+ treatment, a reduction of the resistivity of several orders of magnitude is measured (see Fig. 1). The observed temperature dependence can be qualitatively understood using a model similar to that used for hydrogen-plasma-treated ZnO single crystals (H–ZnO).
Reference Khalid and Esquinazi16
This model considers a series circuit of a hydrogen-rich metallic-like part R
m(T) ∼ R
1
T that it is important mainly at T > 100 K; a doped semiconducting-like region with resistance R
s(T) = R
2 exp(ΔE/2k
B
T) with ΔE an activation energy, the value of which for all wires is ∼60 meV similar to the one of the untreated wire and of ZnO–Co nanowires.
Reference Liang, Yuhas and Yang17
A third region, which may come from a near surface region, acts in parallel to the other two and it is responsible for the clear change of slope at ∼50 K (see Fig. 1). In Ref. Reference Khalid and Esquinazi16, this contribution has been associated to a variable-range hopping-like R
h(T) = R
3 exp(E
nn/T)p, with p
 $ \lesssim$
1/4, but in some samples, it could also be given by a nearly linear temperature dependence with negative slope related to the electron scattering from certain strongly disordered regions.
Reference Cote and Meisel18
All the constants R
i as well as the hopping E
nn and activation ΔE energy are free parameters. As an example, we show in Fig. 1 a curve obtained with this model that provides qualitatively the main details of the experimental curves with parameters similar to those used to fit the temperature dependence of the resistance of H–ZnO single crystals.
Reference Khalid and Esquinazi16
Resistivity of all measured ZnO microwires as a function of temperature in a semilogarithmic scale. The resistivity curve of the virgin wire (V, dashed line) was multiplied by a factor of 0.0006. Due to geometrical uncertainties, the error in the absolute value of the resistivity lies between 50% and 100%. The continuous line is obtained from the series contribution of a semiconducting part R s(T), with similar activation energy as in the virgin wire, and a metallic-like part R m(T), in parallel to a contribution that follows a variable-range hopping-like mechanism R h(T) (see text).

It is important to mention that the wires after hydrogen treatment show a reduction of the resistivity of several orders of magnitude and have different contributions, as the used model to fit the data suggests. The details of these contributions depend not only on the amount of hydrogen implanted (∼2% for 1-h treatment) but also on the temperature of the sample during implantation. It is shown below that the treatment temperature strongly affects the MR of the wires for a fixed treatment time.
D. Magnetoresistance
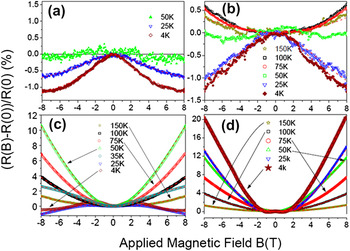
The change of the resistance with magnetic field can provide important information on the possible magnetic properties of the microwires. Due to the wire's small mass, magnetotransport characterization is one of the very few methods available to check for the possible magnetic order triggered, in the actual case, by hydrogen. Figure 4 shows the MR for samples ZRT to Z5 at different temperatures and between −8 T and 8 T magnetic field applied normal to the current or main wire axis. For the hydrogen-treated sample at RT, Fig. 4(a), the MR is negative below 50 K, whereas above this temperature, the MR remains negligible within experimental error. The negative MR reaches ∼ −1% at 8 T in samples ZRT, Z1, and Z3, and its magnitude vanishes at T > 50 K.
MR (in percentage) as a function of applied magnetic field normal to the wire current at different temperatures for samples ZRT (a), ZF1 (b), ZF3 (c), and ZF5 (d). The dashed red lines through the datapoints were calculated following Eq. (1).

Increasing the treatment temperature, a positive MR contribution starts to be observable at high temperatures in sample Z1. In sample Z3, this contribution is observed at low fields and low temperatures and increases up to 10% at 8 T and 50 K, decreasing at higher temperatures, a behavior reported previously for magnetic Co–ZnO nanowires Reference Liang, Yuhas and Yang17 and magnetic ZnO films. Reference Xu, Hartmann, Schmidt, Hochmuth, Lorenz, Schmidt-Grund, Sturm, Spemann, Grundmann and Liu19 For sample Z5, the hydrogen treatment at 773 K leads to a clear increase in the positive MR [see Fig. 4(d)]. In contrast to samples Z1 and Z3, this positive MR decreases steadily from the lowest to the highest measured temperatures [see Fig. 4(d)].
For samples treated at higher temperatures, the larger is the positive MR contribution, which overwhelms the negative MR of the microwires. The relatively large positive MR contribution is in contrast to the low one obtained in the H–ZnO crystals. Reference Khalid and Esquinazi16 Nevertheless, the whole MR behavior of all samples can be very well fitted using the same model as for the H–ZnO crystals, namely the one proposed by Khosla and Fischer Reference Khosla and Fischer20 that combines negative and positive MR in semiconductors taking into account a third-order expansion of the s–d exchange Hamiltonian and a positive MR with a quadratic field dependence, due to the sp–d exchange interactions, the conduction band in ZnO splits into two subbands for spin-up and spin-down carriers with different mobilities that saturates at large enough fields as observed for TM-doped ZnO. Reference Tian, Li and Wu21 The semiempirical formula is:
 $${{\Delta {\rm{\rho }}} \over {{\rm{\rho }}_{\rm{0}} }} = - a^2 ln(1 + b^2 B^2 ) + {{c^2 B^2 } \over {1 + d^2 B^2 }}\quad ,$$
where a, b, c, and d are parameters that depend on the carrier mobility, spin scattering amplitude, exchange integral conductivity, and the spin of the localized moments, respectively, and ρ0 is the resistivity at zero field. As shown in Figs. 4(a)–4(d), the fits to the data following Eq. (1) (dashed red lines) are very good.
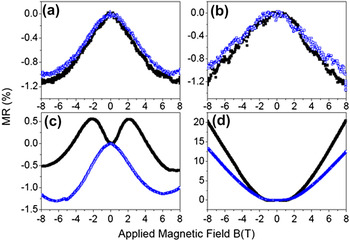
To elucidate further the origin of the two MR contributions, we performed measurements also at fields applied parallel to the substrate. Due to the experimental constrains, the wires formed an in-plane angle between 10 and 30° with respect to the current direction. A comparison of these results for the two field directions is shown in Fig. 5 for all the samples at 4 K. The samples ZRT and ZF1 [see Figs. 5(a) and 5(b)] show a smaller negative MR (higher resistance) for fields in the parallel direction than at fields applied normal to the current. This difference is of the same order to that found in H–ZnO crystals with low hydrogen content, Reference Khalid and Esquinazi16 and its origin is the usual AMR, a key effect of ferromagnetic systems associated with the presence of a spin splitting of the electronic band at Fermi level and a finite spin–orbit coupling. This effect, namely a larger negative MR for fields applied normal to the current, was also observed in Co–ZnO nanowires. Reference Liang, Yuhas and Yang17 In that work, however, the negative MR at high fields has been attributed to weak localization of impurity centers.
Comparison of the MR (in perentage) in perpendicular (black squares) and nearly parallel (blue squares) direction of the applied magnetic field of ZnO wires treated at: (a) RT (ZRT), (b) 100 °C (ZF1), (c) 300 °C (ZF3), and (d) 500 °C (ZF5) for 1 h in H-plasma. All the measurements were done at 4 K.

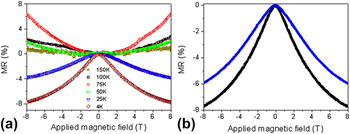
To prove that the negative MR is due to the magnetism triggered by the implanted hydrogen, we have increased by a factor of three the treatment time at 373 K, sample Z1-3. In Fig. 6(a), we recognize a negative MR, the magnitude of which vanishes or is overwhelmed by a positive MR at temperatures above 50 K. Similarly to the samples ZRT and Z1 [see Figs. 5(a) and 5(b)], the negative MR in parallel field configuration is smaller than in the normal one, reaching values of −5.9% and −7.8%, respectively.
(a) MR (in percentage) as a function of applied magnetic field normal to the wire current at different temperatures for sample Z1-3. (b) Comparison of the MR (in percentage) in perpendicular (black squares) and nearly parallel (blue squares) direction of the applied magnetic field for the same wire at T = 4 K.

The increase of H provides an increase of the density of carriers, as has been already reported for ZnO single crystals. Reference Khalid and Esquinazi16 The observed variable-range hopping-like temperature dependence of the resistivity measured in all our H-doped samples below 50 K, see also Ref. Reference Khalid and Esquinazi16, appears to be compatible with that expected from the formation of bound magnetic polarons as possible mechanism to trigger the magnetic properties as suggested in the literature. Reference He, Tian, Springer, Putra, Xing, Chia, Cheong and Wu22 Note that this dependence changes to semiconducting-like above 50 K, the temperature where the magnetic response vanishes.
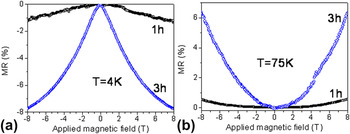
Figure 7 shows the comparison of the MR between the samples Z1 and Z1-3. After a longer treatment time, the negative MR increases by a factor of nearly eight [see Fig. 7(a)]. The negative MR is also a factor of two larger than the one obtained for H–ZnO crystals treated for 90 min, indicating a direct correlation of the negative MR with the concentration of hydrogen in the sample. As observed previously for the other samples, there is also an increase in the positive MR values [see Fig. 7(b)]. Thus, increasing the treatment temperature and/or time, one observes a clear increase of the positive MR contribution. This increase is probably due to the larger density of carrier concentration due to the hydrogen incorporation simultaneously with a probable increase in the carrier mobility due to the annealing of certain kind of defects. The fact that this positive MR vanishes at fields applied parallel to the current indicates that it is due to the Lorentz force on free carriers.
Comparison of the MR (in percentage) for fields applied normal to the current of samples Z1 (black squares) and Z1-3 (blue circles) at (a) 4 K and (b) 75 K.

IV. CONCLUSION
The experimental results of the magnetotransport of pure ZnO microwires after hydrogen plasma treatment indicate that hydrogen can generate a remarkable response with magnetic fields in ZnO. The negative MR added to the field direction dependence of the MR, the AMR, supports the triggering of some kind of magnetic order by the hydrogen implantation, in agreement with previous results obtained in bulk H–ZnO single crystals. The results also demonstrate the sensitivity of the MR on the treatment-temperature and -time, parameters that should be taken into account in the future to generate a larger field response. In clear contrast to the H–ZnO crystals, the negative MR vanishes at around 50 K. The origin for this large difference in temperature is not yet understood.
ACKNOWLEDGMENTS
This work was supported by the Collaborative Research Center (SFB762) “Functionality of Oxide Interfaces”. We thank Dr. J. Barzola-Quiquia for technical support.