INTRODUCTION
The Boston Naming Test (BNT; Kaplan, Goodglass, & Weintraub, Reference Kaplan, Goodglass and Weintraub1983) is one of the most widely used neuropsychological measures in the clinical assessment and investigational study of visual naming ability. Numerous investigators, however, have urged caution in using the BNT in African Americans and other ethnic minorities because of differential performances as compared to Caucasians (Boone, Victor, Wen, Razani, & Pontón, Reference Boone, Victor, Wen, Razani and Pontón2007; Fillenbaum, Huber, & Taussig, Reference Fillenbaum, Huber and Taussig1997; Fillenbaum, Peterson, Welsh-Bohmer, Kukull, & Heyman, Reference Fillenbaum, Peterson, Welsh-Bohmer, Kukull and Heyman1998; Inouye, Albert, Mohs, Sun, Berkman, 1993; Lichtenberg, Ross, & Christensen, Reference Lichtenberg, Ross and Christensen1994; Manly et al., Reference Manly, Jacobs, Sano, Bell, Merchant, Small and Stern1998; Wagner et al., Reference Wagner, Wymer, Carlozzi, Bachman, Walker and Mintzer2007; Welsh et al., Reference Welsh, Fillenbaum, Wilkinson, Heyman, Mohs and Stern1995; Whitfield et al., Reference Whitfield, Fillenbaum, Pieper, Albert, Berkman and Blazer2000). Potential explanations for the observed discrepancy between African American and Caucasian BNT performance include differences in educational attainment and literacy (Manly, Jacobs, Touradji, Small, & Stern, Reference Manly, Jacobs, Touradji, Small and Stern2002; Manly, Byrd, Tourakji, & Stern, Reference Manly, Byrd, Touradji and Stern2004), health-related risk factors (Wagner et al., Reference Wagner, Wymer, Carlozzi, Bachman, Walker and Mintzer2007; Whitfield et al., Reference Whitfield, Fillenbaum, Pieper, Albert, Berkman and Blazer2000), and cultural appropriateness of test items (Manly et al., Reference Manly, Jacobs, Sano, Bell, Merchant, Small and Stern1998; Miles, Reference Miles and Ferraro2002; Whitfield et al., Reference Whitfield, Fillenbaum, Pieper, Albert, Berkman and Blazer2000).
From a clinical standpoint, demographically corrected normative data for African Americans can mitigate the impact of these discrepancies on the likelihood of erroneous diagnostic impressions (Boone et al., Reference Boone, Victor, Wen, Razani and Pontón2007; Heaton, Miller, Taylor, & Grant, Reference Heaton, Miller, Taylor and Grant2004; Lucas et al., Reference Lucas, Ivnik, Willis, Ferman, Smith and Parfitt2005a; Smith, Ivnik, & Lucas, Reference Smith, Ivnik, Lucas, Morgan and Ricker2008). However, group norms do not sufficiently address or ultimately advance our understanding of the underlying psychometric and sociocultural factors that lead to between-group score discrepancies (Brandt, Reference Brandt2007; Manly, Reference Manly2005).
Differential item functioning (DIF) represents a modern psychometric approach to the investigation of between-group score discrepancies. Under equivalent testing conditions, it is expected that individuals from different groups but comparable ability level will have a similar probability of responding correctly to a given test item. An item displays DIF when the conditional probability of obtaining a correct response differs between individuals who have been matched on the underlying ability construct (American Educational Research Association, 1999; Hambleton, Swaminathan, & Rogers, Reference Hambleton, Swaminathan and Rogers1991). Using the framework of the current study, it would be expected that a randomly selected Caucasian adult and a randomly selected African American adult with comparable naming ability will have a similar probability of responding correctly to any given BNT item. If the conditional probability of a correct response differs between the two ability-matched groups, then the item demonstrates DIF. It should be noted that, for an item to be free of DIF, the conditional probabilities between the groups do not need to be equal, but sufficiently similar. As described below, this will be operationalized as a statistically nonsignificant difference between item parameter estimates.
An item can demonstrate DIF in one of two forms. Uniform DIF is present when the probability of a correct response is greater for one group than another across all levels of ability. Conversely, nonuniform DIF is present when the probability of a correct response varies across the ability spectrum. For example, when comparing two groups of individuals on a test such as the BNT, nonuniform DIF would be present if the probability of a correct response for a particular item is higher for one group at the lower levels of naming ability, but higher for the other group at higher naming ability levels.
Item response theory (IRT) provides an attractive framework for the investigation of uniform and nonuniform DIF (Teresi, Kleinman, & Ocepek-Welikson, Reference Teresi, Kleinman and Ocepek-Welikson2000). Conceptually, IRT models are based on the notion that a person’s performance on a particular test depends on the parametric properties of each test item and the person’s trait or latent ability level (Embretson & Reise, Reference Embretson and Reise2000; Hambleton & Swaminathan, Reference Hambleton and Swaminathan1985). In other words, an IRT model expresses the probabilistic association between a person’s observable item responses and their unobservable but estimated ability level. Under a two-parameter logistic IRT model, the latent ability level (θ) is estimated based upon the person’s pattern of passed versus failed items when taking into account each item’s discrimination and difficulty parameters. Item discrimination (α) represents the degree to which the item can distinguish individuals with higher ability from those with lower ability and is closely related in classic test theory to the biserial correlation between each item response and the total test score. Item difficulty (β) represents the ability level at which a person has a 50% chance of responding correctly to an item. A two-parameter model that estimates item discrimination and difficulty seems particularly well suited for the investigation of cognitive ability. Models incorporating a third, “guessing” parameter, are most helpful in multiple-choice test formats more frequently encountered in educational than mental status assessments (Teresi, Kleinman, & Ocepek-Welikson, Reference Teresi, Kleinman and Ocepek-Welikson2000). A one-parameter (Rasch) model has not been recommended for DIF-detection in health data (Teresi, Reference Teresi2006).
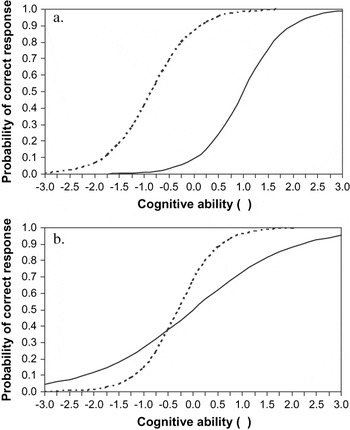
Item discrimination and difficulty are best visualized and more easily understood using item characteristic curves (ICC), which relate the probability of an item response to the underlying ability construct. In an ICC, item difficulty is represented by the location along the x-axis at which point the probability of a correct response for a binary item is 50%, and item discrimination is represented by the slope of the trace line at that location parameter. A steeper slope (corresponding to a higher α value) reflects a higher degree of discrimination. If a test item is DIF-free, the ICCs on that item are comparable and highly overlapping. An item with uniform DIF is characterized by different β parameters between the two groups, resulting in nonoverlapping but relatively parallel curves. In contrast, an item with nonuniform DIF has different α parameters between the groups, resulting in nonparallel curves (see Figure 1 for an illustration).
Sample item demonstrating uniform differential item functioning (DIF; a) and nonuniform DIF (b).

An advantage of IRT over classic test theory is that reliability is not constrained to a single coefficient, but instead can be measured continuously over the entire ability spectrum. In IRT models, reliability is equivalent to the concept of information, which is inversely related to standard error of measurement and represents the degree of precision at each ability level (Embretson & Reise, Reference Embretson and Reise2000). Item information is therefore maximized by higher discrimination parameters and an adequate match between item difficulty and a person’s ability level. Moreover, item information is additive and yields a test information curve that represents the overall degree of precision at each ability level.
Modern psychometric methods hold substantial promise in propelling new perspectives on the relationship between racial/ethnic background and cognitive functions (Pedraza & Mungas, Reference Pedraza and Mungas2008). Knowledge of item-level psychometric properties takes us beyond demographically based group norms, thus advancing our understanding of the underlying factors contributing to test score discrepancies. Within this framework, the current study investigates the presence of DIF on the BNT between African American and Caucasian older adults, with the goal of highlighting items that may be problematic when comparing BNT scores across these groups.
METHOD
Participants
Participants included 670 adults who took part in Mayo’s Older Americans and Older African Americans Normative Studies (MOANS and MOAANS, respectively) and for whom item-level data from the Boston Naming Test were available. Study criteria and recruitment protocol for the MOANS and MOAANS projects have been described previously (Ivnik et al., Reference Ivnik, Malec, Tangalos, Petersen, Kokmen and Kurland1990; Lucas et al., Reference Lucas, Ivnik, Willis, Ferman, Smith and Parfitt2005a). In brief, cognitively normal older adults were defined as community-dwelling, independently functioning individuals examined by their primary care physician within 1 year of study entry and who met the following criteria: (1) normal cognition based on self, informant, and physician reports; (2) capacity to independently perform activities of daily living based on informant report; (3) no active or uncontrolled central nervous system, systemic, or psychiatric condition that would adversely affect cognition, based on physician report; and (4) no use of psychoactive medications in amounts that would be expected to compromise cognition or for reasons indicating a primary neurologic or psychiatric illness. All data were obtained in full compliance with study protocols approved by the Mayo Clinic Institutional Review Board.
Table 1 presents the demographic characteristics of the study participants. There was no significant difference between Caucasian and African American participants in the proportion of males to females (χ2(1) = 2.04; p = .15). However, Caucasian participants were significantly older (t(668) = 7.72; p < .001, Cohen’s d = .60) and had more years of formal education (t(665) = 7.26; p < .001, Cohen’s d = .56).
Demographic characteristics and Boston Naming Test (BNT) mean scores

Measure
The Boston Naming Test was administered using standardized published instructions (Kaplan et al., Reference Kaplan, Goodglass and Weintraub1983), beginning with item 30 and proceeding until a basal level of 8 consecutive correct responses was established. Consequently, items 1–29 were administered to less than one-third of the total sample, resulting in a restricted sample size for parametric DIF analyses. Thus, only items 30–60 were considered for the current study. Test administration proceeded until each participant reached a ceiling performance of six consecutive failures using a lenient discontinuation rule (Ferman, Ivnik, & Lucas, Reference Ferman, Ivnik and Lucas1998). Under this lenient rule, correct responses provided after phonemic cues were not counted toward the six consecutive failures. Within the African American sample, regional synonyms were accepted as correct for certain items (e.g., “mouth harp” for harmonica, “tom walkers” for stilts; Lucas et al., Reference Lucas, Ivnik, Smith, Ferman, Willis and Petersen2005b). Thirty-eight participants did not reach the final test item using this discontinuation criterion. For half of these participants (n = 19), the modal number of nonadministered items beyond the discontinuation criteria was 1. To explore the potential effect of inclusion versus exclusion of the remaining 19 participants who had a greater proportion of nonadministered items, all IRT DIF analyses were performed using two separate datasets. In the first dataset (Restricted), the 19 participants with nonadministered items were excluded from all analyses, resulting in a working sample size of 651 participants. In the second dataset (Full), all 670 participants were included and items not administered beyond the discontinuation rule were coded as incorrect, consistent with standard test administration instructions. The two sets of results were nearly identical, with only one item (“scroll”) demonstrating DIF when analyzed under the Full dataset, but no DIF when analyzed under the Restricted dataset. Given the similarity in findings between the two datasets and the use of discontinuation rules in standard clinical and research practice, only the results from the Full dataset will be presented and discussed.
Statistical Analyses
Power and sample size for IRT
Formal power analytic tools are not currently available to make sample size determinations for IRT studies. However, simulation data using two-parameter logistic IRT models (Holman, Glas, & de Haan, Reference Holman, Glas and de Haan2003) suggest that our sample size was more than sufficient to detect moderate effects.
IRT assumptions
Accurate parameter and ability estimation under the current IRT model requires that the assumptions of unidimensionality and local independence be satisfied. Unidimensionality suggests that a single latent trait is sufficient to account for the observed pattern of item responses. As such, the probability of responding correctly to a test item will be a function of that single underlying trait. Local independence suggests that only the latent trait accounts for the relationship among test items at any given level of ability; thus, after partialing out the underlying trait, there should be minimal to no residual correlation between item pairs. Unidimensionality and local independence are interrelated assumptions, such that violations of conditional independence between any two item responses may result in spurious, unintended dimensions that lead to inaccurate ability and parameter estimates.
Unidimensionality was assessed separately on the African American and Caucasian data using several methods. First, exploratory principal components analyses were conducted on the tetrachoric correlations using PRELIS 2.0, followed by confirmatory factor analyses (CFA) using an asymptotic distribution-free estimator (i.e., diagonally weighted least squares) using LISREL 8.80 (Jöreskog & Sörbom, Reference Jöreskog and Sörbom2006). Acceptable model fit was evaluated with the comparative fit index (CFI, values > 0.90 indicate better fit) and the root-mean-square error of approximation (RMSEA, values < 0.10 indicate better fit). A known limitation of ADF estimators, however, is the requirement for substantially large sample sizes to generate proper solutions (Boomsma & Hoogland, Reference Boomsma, Hoogland, Cudeck, du Toit and Sörbom2001). For instance, Jöreskog and Sörbom (Reference Jöreskog and Sörbom1997) recommend a minimum sample size of 1.5p(p + 1), where p represents the number of observed indicators. Alternatively, nonparametric approaches are also available to evaluate essential unidimensionality and local independence. DIMTEST 2.0, a nonparametric conditional covariance-based test formulated by Stout (Reference Stout1987) and Nandakumar and Stout (Reference Nandakumar and Stout1993), with refinement by Stout, Froelich, and Gao (Reference Stout, Froelich, Gao, Boomsma, van Duijn and Snijders2001), was used to further evaluate these assumptions. DIMTEST yields a T statistic that tests the null hypothesis of essential unidimensionality.
Analytic procedure
The steps for conducting IRT-based DIF analyses have been described in great detail elsewhere (e.g., Orlando-Edelen, Thissen, Teresi, Kleinman, & Ocepek-Welikson, Reference Orlando-Edelen, Thissen, Teresi, Kleinman and Ocepek-Welikson2006; Teresi et al., Reference Teresi, Ocepek-Welikson, Kleinman, Cook, Crane and Gibbons2007). The first step was to identify a group of DIF-free anchor items that could be used to link the two participant groups in terms of their ability (θ). Anchor items were generated in an iterative manner using IRTLRDIF, a software program for IRT modeling based on a nested comparison approach (Thissen, Reference Thissen2001). IRTLRDIF uses maximum likelihood to test a compact model, in which all parameters are constrained to be equal for a studied item, to an augmented model in which one or more parameters are freely estimated. The difference between the log-likelihood statistics of the two models is distributed as a χ2 statistic (G2), with degrees of freedom equal to the difference in parameter estimates between the two models. Under this iterative procedure, all items are initially evaluated for DIF by sequentially testing the two models. A significant G2 statistic at the nominal p < .05 level indicates that at least one of the parameters differs between the groups and is assumed to demonstrate DIF. After all test items were tested once using this procedure and those with potential DIF removed, the procedure was repeated as many times as necessary until “purification” of the anchor set was achieved. This represented the DIF-free anchor item set for all subsequent DIF analyses.
Next, the remaining set of test items was sequentially evaluated for DIF against the set of purified anchor items. Nonuniform DIF was examined by testing the discrimination parameter (α) between the compact and augmented models for each item, followed by examination of uniform DIF by testing the difficulty parameter (β). To adjust for multiple comparisons, the false discovery rate was controlled using the Benjamini-Hochberg procedure (Benjamini & Hochberg, Reference Benjamini and Hochberg1995) as implemented by Thissen, Steinberg, and Kuang (Reference Thissen, Steinberg and Kuang2002), because this method has been shown to demonstrate greater power than the Bonferroni approach. Final item parameter estimates, standard errors, and summary statistics were then estimated using MULTILOG (Thissen, Reference Thissen2003). Finally, the ICCs for each item demonstrating DIF were plotted for visual inspection, and item and test information were calculated to gauge reliability across the spectrum of naming ability.
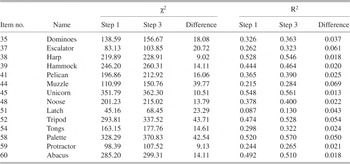
Within a parametric approach, additional computational models are also available to investigate DIF. In the current investigation, we opted to supplement the IRT-based DIF analyses with a logistic regression approach (Jodoin & Gierl, Reference Jodoin and Gierl2001; Swaminathan & Rogers, Reference Swaminathan and Rogers1990; Zumbo, 1999) with the goal of bolstering the detection of DIF by minimizing the likelihood of method-dependent spurious findings. The use of multiple computational procedures in the detection of DIF has been advocated (Hambleton, Reference Hambleton2006). Hierarchical logistic regression models were applied to each item using the binary responses as the dependent variable and the BNT total score, grouping variable (African American vs. Caucasian), and group-by-total score interaction as the independent variables. The total score was entered into the model in the first step, followed by the grouping variable and finally by the interaction term. This model yields for each item a test for DIF by subtracting the χ2 value in the third step from the χ2 value in the first step. This results in a two-degrees of freedom χ2 test of uniform and nonuniform DIF (Swaminathan & Rogers, Reference Swaminathan and Rogers1990). The Benjamini-Hochberg procedure was again used to control the false discovery rate. The effect size criteria proposed by Jodoin and Gierl (Reference Jodoin and Gierl2001) was adopted to gauge the magnitude of DIF in the regression models, with Nagelkerke R2 values less than .035 representing negligible DIF, .035 to .070 moderate DIF, and greater than .070 large DIF.
RESULTS
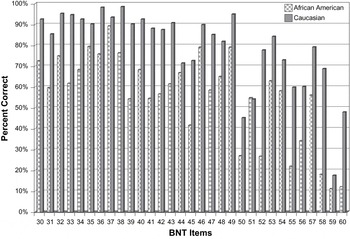
Consistent with prior normative studies across racial/ethnic groups, our sample of Caucasian adults obtained a higher mean BNT score than our sample of African American adults (t(668) = 15.7; p < .001; Cohen’s d = 1.21). Except for item 51 (“latch”), in which 55% of African American and 54% of Caucasian adults provided a correct response, African Americans had a lower percentage of correct responses across the remaining test items (Figure 2).
Mean percent of correct item responses by participant group. BNT = Boston Naming Test.

Assumptions
The principal components analysis from the African American group showed the first eigenvalue was 14.65 and the second eigenvalue 1.63, a ratio of nearly 9:1. Results from a single-factor CFA showed a CFI of .91 and RMSEA of .09. The DIMTEST statistic was T = 1.26 (p = .10). These findings were interpreted to provide strong support for the assumption of unidimensionality in this sample. In the Caucasian group, the principal components analysis showed the first eigenvalue was 8.60 and the second 3.50, a ratio of 2.5:1. CFA produced multiple Heywood cases, resulting in “not positive definite” errors and nonadmissible solutions despite modifications, likely due to sample size limitations. Results from DIMTEST showed a T statistic of 1.38 (p = .08). Despite the greater heterogeneity in the Caucasian data, these findings were interpreted to reflect borderline unidimensionality in this sample and considered sufficient to proceed with IRT modeling.
IRT-based DIF
To identify the anchor item set, an initial run using IRTLRDIF found 15 DIF-free items (“harmonica,” “acorn,” “igloo,” “stilts,” “cactus,” “hammock,” “knocker,” “stethoscope,” “pyramid,” “accordion,” “asparagus,” “compass,” “sphinx,” “yoke,” and “trellis”). During a second iteration, one of these items demonstrated DIF (“pyramid”) and was removed. No additional items were found to demonstrate DIF during a third iteration. Thus, these 14 DIF-free items represented the purified anchor set used to link the two groups. The remaining 17 items (including “pyramid”) were considered the candidate items for DIF analyses.
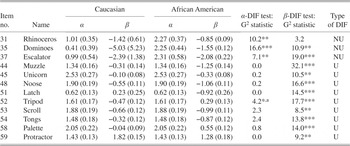
Using the DIF-free anchor set, 15 of the 17 candidate items initially demonstrated DIF. After controlling for multiple comparisons, 12 of the 17 candidate items continued to demonstrate DIF. “Dominoes” and “escalator” showed DIF in both the α and β parameters and “rhinoceros” showed DIF in the α parameter only (nonuniform DIF). “Muzzle,” “unicorn,” “noose,” “latch,” “tripod,” “scroll,” “tongs,” “palette,” and “protractor” showed DIF in the β parameter only (uniform DIF). Final IRT parameter estimates and standard errors for items demonstrating DIF are presented in Table 2.
Item parameters, standard errors, and type of IRT-based DIF

Note
IRT = item response theory; DIF = ; α = discriminability parameter; β = difficulty parameter; G2 = chi-square with 1 degree of freedom; U = uniform DIF; NU = nonuniform DIF.
a DIF test not statistically significant after Benjamini-Hochberg procedure.
* p < .05.
** p < .01.
*** p < .001.
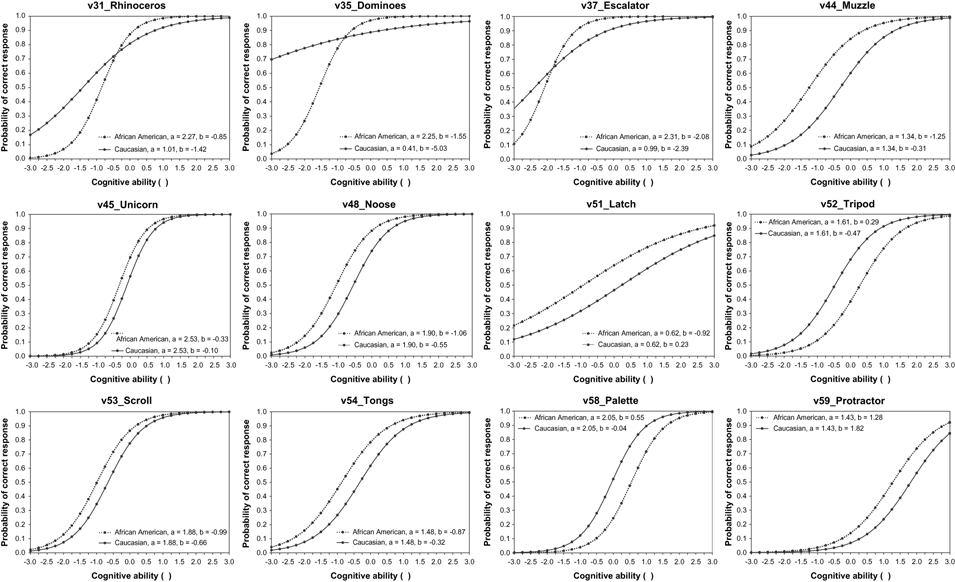
Among the nine items demonstrating uniform DIF, seven of them showed a difference of at least 0.5 standard deviations in β parameters between the two participant groups. “Tripod” and “palette” showed higher β parameters in African American adults, whereas “muzzle,” “unicorn,” “noose,” “latch,” “scroll,” “tongs,” and “protractor” showed higher β parameters in Caucasian adults. Item characteristic curves for these items are shown in Figure 3.
Item characteristic curves for 12 items demonstrating differential item functioning using item response theory-based methods.

The 31 studied items covered a wide range of difficulty. For Caucasian adults, difficulty parameters ranged from the least difficult item at β = −5.03 (“dominoes”) to the most difficult item at β = 1.82 (“protractor”). In fact, the probability of responding correctly to the item “dominoes” was at minimum 70% across the entire ability spectrum. For African American adults, the least difficult item was “escalator” (β = −2.08), while “protractor” represented the most difficult item at β = 1.28. It is notable that “protractor” was by far the most difficult item for both participant samples, while the next most difficult item, “compass,” had a β parameter that was substantially lower (β = .70).
Range of discriminability parameters was comparable between the two participant samples. The least discriminating item among Caucasian adults was “dominoes” (α = .41), which as noted earlier also represented the easiest item. Among African American adults, the least discriminating item was “latch” (α = .62), which was also the second-least discriminating item among Caucasian adults. The most highly discriminating item in both participant samples was “igloo” (α = 3.46).
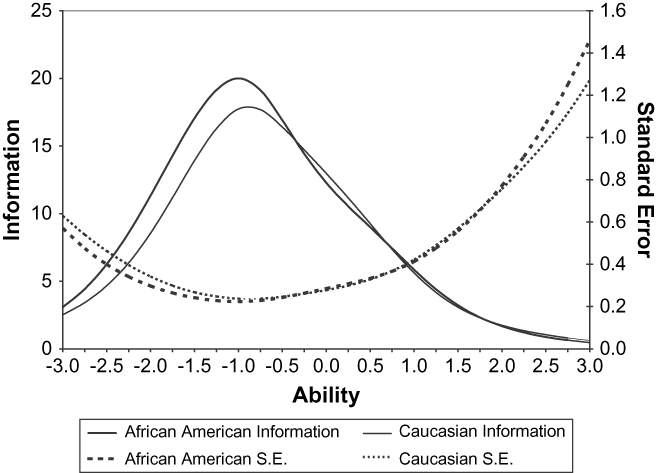
Figure 4 displays the test information function for each participant sample. In both groups, the BNT provided the most information at approximately −1.0 standard deviation of naming ability. In other words, precision of measurement was greatest at a mild level of naming difficulty, with slightly greater precision at that ability range for African American than Caucasian adults.
Test information curve by participant group across range of naming ability. S.E. = standard error.

LR-based DIF
Sixteen items had difference χ2 tests that were significant at the nominal p < .05 level. After controlling for multiple comparisons, 14 of these 16 items remained statistically significant (Table 3). DIF effect size estimates showed eight of these items to demonstrate negligible DIF and six items to demonstrate moderate DIF (i.e., “dominoes,” “escalator,” “muzzle,” “latch,” “tripod,” “palette”). No item demonstrated a large magnitude of DIF in the regression models.
Differential item functioning results using hierarchical logistic regression

DISCUSSION
The present study sought to investigate DIF on the BNT between African American and Caucasian adults age 52 and older. Using IRT-based methodology, 12 of the studied items demonstrated DIF, suggesting that the conditional probability of responding correctly to these items differed significantly between the two groups after matching for the latent naming ability. The items “dominoes” and “escalator” showed uniform and nonuniform DIF, which reflects nonequivalence in the difficulty and discriminability parameters between the two groups. The item “rhinoceros” showed DIF in the discriminability parameter only, whereas items “muzzle,” “unicorn,” “noose,” “latch,” “tripod,” “scroll,” “tongs,” “palette,” and “protractor” showed DIF only in the difficulty parameter.
There has been considerable debate within the DIF literature about the extent to which item parameter estimates, and hence DIF detection, are dependent on the methods used to calculate those parameters. An emerging opinion promotes the use of multiple computational procedures for DIF detection. To minimize the likelihood that the current findings were specific to the use of IRT, we reanalyzed the data using hierarchical logistic regression models with item response as the binary dependent outcome in each model. Results showed 14 items to demonstrate DIF, with 6 of these items considered to have at least “moderate” DIF based upon suggested criteria. These 6 items (“dominoes,” “escalator,” “muzzle,” “latch,” “tripod,” “palette”) were similarly identified as demonstrating DIF through the IRT analyses and represent the strongest evidence for race/ethnicity-based DIF in the BNT.
The presence of DIF on the BNT is problematic from two broad perspectives. First, it raises some concerns about the construct validity of the test when a construct-irrelevant aspect, namely race or ethnic group membership, is associated with nonequivalence in the conditional probability of obtaining a correct item response. In other words, after matching individuals on naming ability level, at minimum 6 of the 31 items studied using IRT and logistic regression methods (or 12 of 31 studied items using IRT methods only) demonstrate a significantly different probability that a person will respond correctly, solely as a result of their racial/ethnic group membership. Second, it bolsters the notion that the use of ethnicity-based norms to evaluate the clinical impact of the summed total score may mask psychometric problems that are present at the item level.
The current results present additional psychometric information about the BNT that, to our knowledge, has not been previously reported. Specifically, examination of the IRT difficulty and discriminability parameters shows lack of a monotonic relationship among ordered items. Despite administration rules conforming to an incremental administration, each successive item does not necessarily represent a psychometric increase in difficulty when compared with its previous item. In fact, the observed pattern most closely resembles an oscillating profile of increasing and decreasing item difficulty as administration progresses from items 30 through 60. This pattern is evident in both the African American and Caucasian participant samples. Additionally, one would expect uniformity in the degree to which each item differentiates those with better or worse naming ability. However, the discrimination parameters show considerable variability from item to item throughout both groups of adults. Graves, Bezeau, Fogarty, and Blair (Reference Graves, Bezeau, Fogarty and Blair2004) previously applied a one-parameter Rasch model to a mixed sample of 206 adults (n = 62 considered cognitively normal) to develop a short version of the BNT; but unfortunately, item difficulty parameters were not reported. Additional IRT-based investigations certainly appear warranted to better understand the finer psychometric properties of this instrument, with a particular emphasis on item parameters across the full range of naming performance in normal and cognitively impaired populations.
From a practical standpoint, these results could be used in a future refinement of the BNT to mitigate item bias or differential functioning. Specifically, the items shown here to be free of DIF could be retained in a future revision of the test, with reordering of those items based upon estimated rather than hypothesized difficulty parameters. Alternatively, a scoring algorithm can be devised and implemented to weight responses from DIF-free items more heavily than responses from DIF-loaded items. Given the widespread use of the BNT within and beyond neuropsychology, and the existing large normative datasets across the developmental span, a new scoring algorithm may seem most practical.
Potential limitations to the current investigation include restricting the range of the BNT to items 30 through 60, restricting the participant sample to cognitively normal older adults, the characterization of the two groups, and possible multidimensionality of the data from Caucasian adults. First, item range restriction was necessary for psychometric reasons. The test was administered using standardized rules that instruct examiners to begin with item 30 and proceed until a basal level of 8 consecutive correct responses is reached. Fewer than one-third of our cognitively normal participant sample failed to reach this basal level. As a result, the majority of items 1–29, and particularly items 1–25, were administered to less than 200 subjects per group. IRT analyses of these items would have resulted in unstable and perhaps misleading parameter estimates.
Our sample was restricted to cognitively normal adults for two reasons. First, the principal goal of the study was to investigate the psychometric properties of the BNT at the item level, with a particular focus on differential functioning between two racial/ethnic groups. The relationship between item parameters and clinical dysfunction is not essential to understanding DIF, as the analytic method presupposes matching on ability level. Furthermore, restricting the sample to cognitively normal adults minimized the likelihood that an unequal distribution between the two groups of clinical factors unrelated to naming (e.g., reduced visual acuity or perception, slowed processing speed) could have contributed to differential performance across items. The relationship between item parameters and naming dysfunction remains an important topic of investigation and will be pursued in future studies.
The two participant groups consisted of self-identified African American and Caucasian adults that have taken part in the Mayo normative studies. Numerous publications over the past 19 years have described the methodology used to select the participant sample. Test selection, administration, and scoring are comparable between the two Mayo sites in Rochester, Minnesota, and Jacksonville, Florida. Because all of the African American adults were recruited in Jacksonville, it could be reasonably argued that the current results represent DIF based upon geographic (i.e., north vs. south) rather than ethnicity-based factors. This certainly presents a caveat to the findings discussed above as well as a testable hypothesis. Unfortunately, we do not have a sufficiently large sample of African American and Caucasian adults within both sites to examine DIF based on geographic distribution.
Lastly, it is possible that the BNT data obtained from Caucasian adults were not sufficiently unidimensional to meet IRT assumptions, although it seems unclear why “naming” should be a more strongly unitary construct in one group versus the other. To our knowledge the invariance properties of the BNT have yet to be uniformly established across these two groups, and this may represent another topic worthy of further study.
In summary, the current investigation highlights the benefits of modern psychometric methods in the investigation of between-group discrepancies. Our findings suggest that the unexamined use of race/ethnicity-based norms, although necessary in clinical decision making, potentially masks underlying psychometric problems that may contribute to between-group discrepancies at the item level. The degree to which these findings extend beyond the BNT to other established and commonly used neuropsychological instruments remains largely unexplored.
ACKNOWLEDGMENTS
We extend our gratitude to Katja Ocepek-Welikson at the Hebrew Home for the Aged in Riverdale, New York, for technical assistance with the IRTLRDIF program, and to Francine C. Parfitt, Tracy L. Kendall, and Sylvia B. Stewart at the Mayo Memory Disorders Clinic for data preparation. This study was supported in part by a grant from the Robert and Clarice Smith Fellowship Program and a Supplement grant from the National Institute on Aging (AG016574-07S1). The study authors do not have any sources, financial or otherwise, that could result in a conflict of interest pertaining to this manuscript.