Implications
The present study confirms the feasibility and relevance of field cardiorespiratory measurements in exercising horses using a portable gas analyser and opens new perspectives on the assessment of physiological responses and energy expenditure in horses exercising in real-life conditions. It provides the first estimations of the energy expenditure induced by specific training exercises in trotters. This is a start point to estimate weekly and daily amount of energy expenditure induced by physical activity for assessing accurate energy balance in equine athletes.
Introduction
Appropriate energy feeding management is a crucial component of a race horse’s performance. An accurate balance between dietary energy supply and energy expenditure (EE) has to be ensured for health and performance (Lawrence, Reference Lawrence2009). Thus, the amount of energy used in training needs to be properly quantified (Asai et al., Reference Asai, Matsui, Osawa, Kawai and Kondo1999; National Research Council, 2007). This amount is directly related to the volume and intensity of the exercise during the training session. Volume is defined as the total quantity of activity performed during an exercise, expressed as duration or distance (Viru and Viru, Reference Viru and Viru2000), whereas intensity reflects the qualitative component of work in relation to power output or velocity according to each subject. Intensity is usually expressed as a function of individual capacity such as maximum velocity (%vmax) or maximal oxygen consumption (%VO2max) (Bompa and Haff, Reference Bompa and Haff2009).
The current energy recommendations for race horses (NRC, 2007; Martin-Rosset, Reference Martin-Rosset2012) are not based on precise quantification of EE during specific exercises of their typical training, although some of them have been studied. Thus, in Standardbred trotters, four main specific exercises are commonly used by Standardbred trainers as follows: promenade-, jogging-, parcours- and interval-type exercises (Sommaire, Reference Sommaire2007; Wegener et al., Reference Wegener, Lindner and Hartmann2012; Fortier et al., Reference Fortier, Julliand, Harris and Goachet2014). Quantifying the amount of energy expended during each of these four main specific exercises would allow improving dietary recommendations. In human athletes, respiratory gas measurements are widely used to estimate EE during work-out (Bertuzzi et al., Reference Bertuzzi, Franchini, Kokubun and Kiss2007). In horses, the recent development of portable systems adapted from human application offers the opportunity to measure gas exchange and oxygen consumption (VO2) in field conditions of a wide variety of activities (Art et al., Reference Art, Duvivier, van Erck, de Moffarts, Votion, Bedoret, Lejeune, Lekeux and Serteyn2006; Votion et al., Reference Votion, Caudron, Lejeune, Van Der Heyden, Art, Van Erck and Serteyn2006; Goachet et al., Reference Goachet, Fortier, Julliand, Assadi and Lepers2011; Goachet et Julliand, Reference Goachet AG et Julliandin press). This opens new perspectives for the quantification of the amount of energy expended by horses during training.
This study aimed to quantify EE, based on field measurements of oxygen consumption, during four specific exercises – that is, promenade, jogging, parcours and interval in Standardbred trotters training.
Material and methods
The project was conducted under the ethics committee of animal experimentation Grand Campus Dijon (France) approval 0313.
Horses and management of horses
A total of six Standardbred trotter geldings with an average age of 7.8±1.9 years, a mean BW of 478±25 kg and a mean body condition score (BCS) of 3.0±0.0 (on a scale of 0 to 5, INRA-HN-IE, 1997) were maintained under controlled conditions. They were housed separately in 4×3.5 m free stalls, on straw bedding, and were allowed access to sandy paddocks for free exercise for 2 h daily. Horses were weighted (Marechal Pesage PM 400; Chauny, France) and their BCS were recorded weekly throughout the study.
Clean potable drinking water and a block of trace-mineralized salts were offered ad libitum. Horses were fed meadow hay representing ~60% of the daily dry matter (DM) intake (1200 g DM/100 kg BW) and pelleted feed (800 g DM/100 kg BW) (DP Puissance; InVivo NSA, Louhans, France). Hay was fed at 1000 and 1700 h. Pelleted feed was fed at 0800 and 1730 h. The portions at each feeding were equal.
Before the measurements, horses received a conditioning programme for 8 weeks consisting of the following four work-outs per week: two treadmill exercises (Horse-Gym 2000, GmbH, Harburg-Großsorheim, Germany) for 24 or 32 min at 0% incline at 2.2 m/s and two field exercises on a 1150-m sandy track. Trotters were driven by the same person according to a training programme, which included jogging (25 to 35 min at 5.5 to 6.2 m/s), parcours (2000 to 3500 m at 6.9 to 7.8 m/s) and interval exercises (5×900 m at 7.5 to 8.3 m/s or 4×500 m at 9.7 m/s). Parcours and interval exercises were preceded by a 10-min warm-up (or heat) at a velocity ranging from 5.5 to 6.9 m/s and ended with a cooling-down, which consisted of 2000 m at 4.2 m/s.
Experimental design
All the trotters were driven by the same person throughout the experiment. After the conditioning period, horses performed a v500 test before accomplishing four different testing situations, each of them separated from the previous one by 1 week in order to avoid fatigue. For practical purposes, the intensity of exercises was expressed as a percentage of v500, in order to adapt the intensity of the four testing situations for each individual (previously evaluated in racing Standardbred trotters – Fortier, unpublished data) according to their capacities. Subsequently, the horses performed the promenade, jogging, parcours and interval exercises in order to determine the respective EE.
Exercise protocol and measurements
The v500 test, entirely performed at trot, consisted of three bouts of 500 m, separated by 500 m of active recovery (at 4.2 m/s). It was preceded by a 10-min warm-up at 5.6 m/s followed by a 10-min recovery at slow trot and at walk. Duration, velocity and heart rate (HR) were continuously recorded using a stopwatch, a tachometer attached to the wheel of the sulky and an HR monitor (Polar; Polar Electro Oy, Kempele, Finland). The highest velocity recorded during the best bout for each horse was considered as the maximal velocity over 500 m at trot (v500).
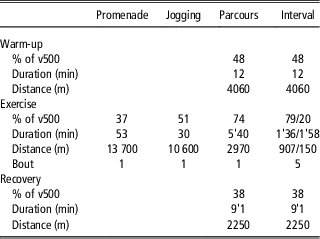
At least 1 week after the v500 test, trotters randomly performed promenade, jogging, parcours and interval exercises (Table 1). Duration and distance of the different exercises were set according to current training practices of French Standardbred trainers (Fortier et al., Reference Fortier, Julliand, Harris and Goachet2014). The parcours and interval exercises included a warm-up (wu) and a recovery phase (rec), whereas the promenade and jogging only included an exercise phase (ex). The exercise phase of the interval exercise consisted of the repetition of five 907-m high-intensity bouts (79% of v500), interspersed with 2-min low-intensity phases (20% of v500).
Characteristics of the four testing situations

Description of the promenade, jogging, parcours and interval situations, and their different phases – that is, warm-up, exercise and recovery. For each phase, the intensity (expressed as percentage of the maximal velocity over 500 m i.e. v500), the duration (min) and the distance (m) were specified, as the number of bout for the exercise phase.
Throughout the four testing situations, VO2 and carbon dioxide production (VCO2) were measured breath-by-breath with the portable gas analyser (K4b²; Cosmed, Rome, Italy) (Supplementary Figure S1). Before each test, the O2 and CO2 analysers were calibrated by a 2-point calibration. The first one was that ambient air was assumed to have a fractional oxygen concentration of 20.9% and a fractional carbon dioxide of 0.03%, and the second one a gas of known concentration with 16% of O2 and 5% CO2 was assumed. A pre-test, specified by the manufacturer, was used to establish a delay calibration between airflow and gas signals. The analyser and battery were fixed on the sulky and a headcheck was placed on trotters in order to protect the face mask against shocks (Goachet et al., Reference Goachet, Fortier, Julliand, Assadi and Lepers2011). HR was recorded continuously using the Polar system incorporated to the K4b² system during each testing situation. In addition, venous blood was collected at rest before testing situation and immediately after each exercise phase to determine blood lactate concentration pre ([La−] pre) and post ([La−] post) testing situations. Blood samples were taken via venipuncture of the jugular vein into one 5-ml pre-treated potassium oxalate/sodium fluoride tubes. Plasma for the measurement of [La−] was obtained by centrifugation of the tubes (450×g for 10 min) and was transferred into new dry tubes. All tubes were then frozen (at −20°C) and sent to Frank Duncombe Laboratory (Caen, France) for analysis by enzymatic colorimetric method (kits No. LC 2653; Randox, Crumlin, UK). The rectal temperature (T°) was also measured at rest before testing situation (T° pre) and immediately after exercise phase (T° post) for each testing situation. The total duration of each testing situation and their different phases were timed with a chronometer.
Calculations
The data recorded during the testing situations were downloaded using the K4b2 management data software (Cosmed, Rome, Italy). Cardiorespiratory responses were filtered and averaged over 5 s, and the curves were smoothed with a 3-point index (Duffield et al., Reference Duffield, Dawson, Pinnington and Wong2004). The different phases – that is, wu, ex and rec – of the testing situations were identified by comparing the recorded time for each phase and time indicated by VO2 recordings. Data were then transferred to Excel files to convert VO2 and VCO2 into ml/min per kg and to calculate the respiratory exchange ratio (RER) as VCO2 (l/min)/VO2 (l/min). Oxygen uptake at rest (VO2rest) was defined as the mean of the last 30 s of the rest period before the beginning of the testing situations with horses not moving. Mean VO2, VCO2, RER and HR during the exercise phase (VO2ex, VCO2ex, RERex and HRex) were defined as the means of VO2, VCO2, RER and HR, respectively, measured throughout exercise phases of the four testing situations. Mean VO2, VCO2, RER and HR during warm-up (VO2wu, VCO2wu, RERwu and HRwu) and recovery (VO2rec, VCO2rec, RERrec and HRrec) were defined as means of VO2, VCO2, RER and HR, respectively, measured throughout warm-up and recovery phases of parcours and interval situations. VO2peak, VCO2peak, RERpeak and HRpeak, as the means of VO2, VCO2, RER and HR, respectively, obtained over the last 30 s of the exercise phase of each testing situation, were also measured.
To calculate EE related to exercise, VO2rest was subtracted from the VO2wu, VO2ex and VO2rec. A caloric equivalent of 20.9 kJ/l O2 was used to convert VO2 into energy (Bertuzzi et al., Reference Bertuzzi, Franchini, Kokubun and Kiss2007; Mello et al., Reference Mello, Bertuzzi, Grangeiron and Franchini2009). EE of the different phases (EEwu, EEex and EErec) and EE of the entire testing situations (i.e. EEwu+EEex+EErec), expressed in kJ, were calculated for promenade, jogging, parcours and interval situations. The contributions of warm-up (%EEwu), exercise (%EEex) and recovery (%EErec) phases to the EEparcours and EEinterval were also determined.
Statistical analysis
All measurements were expressed as mean±s.d. Comparisons of the cardiorespiratory variables and EE variables among the four testing situations were made by ANOVA for repeated measures, with the Student–Newman–Keuls test performed to detect specific differences. Effect sizes (η²) were also determined, with values of 0.2, 0.5, 0.8 and >1.3 considered to represent small, medium, large and very large differences, respectively (Cohen, Reference Cohen1988). Differences were considered statistically significant at P<0.05.
Results
During the v500 test, the highest velocity recorded during the best bout, considered as the maximal velocity over 500 m at trot, was 11.7±0.7 m/s. During this bout, the HR peak was 214±4 bpm.
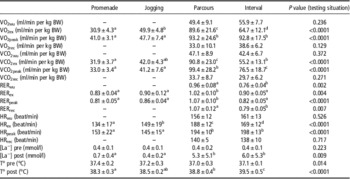
VO2rest was 3.0±0.9 ml/min per kg BW. No significant difference was detected between physiological data during warm-up and recovery phases of parcours and interval situations, except RERs, which were higher for the parcours situation (Table 2). EEwu represented 43.6±5.6% and 33.3±3.3% of the EE of parcours and interval situations, respectively, which were not significantly different (P>0.05). EErec represented 21.4±6.3% and 16.5±2.5% of the EEparcours and EEinterval situations, respectively, which were not significantly different (P>0.05) (Table 3).
Physiological responses of Standardbred trotters during the four testing situations

Oxygen uptake during warm-up (VO2wu), exercise (VO2ex), recovery (VO2rec) and at peak (VO2peak) during promenade, jogging, parcours and interval; carbon dioxide production during warm-up (VCO2wu), exercise (VCO2ex), recovery (VCO2rec) and at peak (VCO2peak) during promenade, jogging, parcours and interval; respiratory exchange ratio warm-up (RERwu), exercise (RERex), recovery (RERrec) and at peak (RERpeak) during promenade, jogging, parcours and interval; heart rate during warm-up (HRwu), exercise (HRex), recovery (HRrec) and at peak (HRpeak) during promenade, jogging, parcours and interval; [La−] pre=blood lactate concentration before testing situations; [La−] post=post-exercise phase blood lactate concentration; T° pre=rectal temperature before testing situations; T° post=post-exercise phase rectal temperature.
Data are reported as means and s.d. (n=6).
a,b,c,dValues within a row with different superscripts differ significantly at P<0.05.
Estimation of energy expended in six Standardbreds submitted to four different testing situations

EEwu=warm-up energy expressed in kJ/min per kg BW; EEex=exercise energy expressed in kJ/min per kg BW; EErec=recovery energy expressed in kJ/min per kg BW; EE (kJ/min per kg BW)=energy expenditure (EEwu+EEex+EErec) per kg of BW and per min for the four testing situations; EE (kJ)=energy expenditure for the four testing situations
Data are reported as means and s.d. (n=6).
a,b,c,dValues within a row with different superscripts differ significantly at P<0.05.
VO2ex and HRex were significantly different between the four testing situations (Table 2). VO2, VCO2 and HR peak responses were higher for parcours than for promenade (P<0.05, very large differences with η²=2.78, η²=3.31 and η²=2.40 for VO2peak, VCO2peak and HRpeak, respectively) and jogging situations (P<0.05, very large differences with η²=2.50, η²=2.82 and η²=3.84 for VO2peak, VCO2peak and HRpeak, respectively). VO2, VCO2 and HR peak responses were higher for interval than for promenade (P<0.05, very large differences with η²=4.12, η²=3.24 and η²=2.50 for VO2peak, VCO2peak and HRpeak, respectively) and jogging situations (P<0.05, very large differences with η²=2.36, η²=2.47 and η²=3.78 for VO2peak, VCO2peak and HRpeak, respectively). RERex and RERpeak for parcours situation was higher compared with promenade (P<0.05, very large differences with η²=2.50 and η²=3.29 for RERex and RERpeak, respectively), jogging (P<0.05, large and very large differences with η²=1.09 and η²=2.75 for RERex and RERpeak, respectively) and with interval situations (P<0.05, very large differences with η²=1.52 and η²=3.16 for RERex and RERpeak, respectively). [La−] at the end of the exercise phase of parcours and interval situations was higher than for promenade (P<0.05, very large differences with η²=1.27 and η²=1.41 for parcours and interval, respectively) and jogging situations (P<0.05, very large differences with η²=1.36 and η²=1.49 for parcours and interval, respectively). T° post exercise was higher for interval than promenade (P<0.05, η²=2.91, very large differences), jogging (P<0.05, η²=2.63, very large differences) and parcours situations (P<0.05, η²=1.55, very large differences). EEex increased from the promenade to parcours situations (Table 3). When expressed in kJ/min per kg BW, the EE of the promenade situation was lower compared with jogging (P<0.05, η²=0.69, medium differences), parcours (P<0.05, η²=0.39, small differences) and interval situations (P<0.05, η²=1.74, large differences). Expressed in kJ, EEinterval was significantly higher than promenade (P<0.05, η²=2.28, very large differences), jogging (P<0.05, η²=0.07, medium differences) and parcours situations (P<0.05, η²=1.19, large differences).
Discussion
This study showed that in Standardbred trotters’ training, interval exercises induced a total EE (18 119 kJ) that was 1.3-, 1.4- and 1.6-fold higher than that of jogging, promenade and parcours situations, respectively. Despite different cardiorespiratory responses, these last three exercises appeared to be relatively close in terms of EE (11 119, 12 618 and 13 698 kJ, respectively).
In the context of EE assessment during exercise, field metabolic measurements have the great advantage to take into account the genuine training conditions such as the extra load of the rider or sulky or the ground surface effect (Lawrence, Reference Lawrence2009) compared with treadmill conditions. In fact, it is generally accepted that treadmill exercise does not always reflect the demands in field conditions, with physiological and mechanical responses of harnessed trotters lower in treadmill than in field conditions (Barrey et al., Reference Barrey, Galloux, Valette, Auvinet and Wolter1993; Couroucé et al., Reference Couroucé, Geffroy, Barrey, Auvinet and Rose1999). Accordingly, although the physiological responses observed in the present study are different from common physiological data reported in standardbred trotters exercising on treadmills (Art and Lekeux, Reference Art and Lekeux1995), they were concordant with previous reports obtained in field studies (van Erck et al., Reference van Erck, Votion, Serteyn and Art2007; Goachet et al., Reference Goachet, Fortier, Julliand, Assadi and Lepers2011) and likely reflected the metabolic demand of the different exercises performed.
As expected, the cardiorespiratory responses during promenade, jogging, parcours and interval situations varied according to the characteristics of testing situations. As mentioned previously (Fortier et al., Reference Fortier, Julliand, Harris and Goachet2014), Standardbred trainers indicated that they use promenade and jogging exercises to develop aerobic endurance and to optimize active recovery, which is confirmed by the physiological responses observed in the present study: VO2ex values were 30.9 and 49.9 ml/min per kg BW for promenade and jogging situations, respectively; HRex remained <150 bpm for both the testing situations. Moreover, the post-exercise blood lactate levels remained below 1 mmol/l (0.7±0.4 and 0.4±0.2 mmol/l for the promenade and jogging situations, respectively) and the RER remained below 1 (0.81±0.05 and 0.86±0.04 for the promenade and jogging situations, respectively), indicating a large aerobic contribution during promenade and jogging situations. On the other hand, to develop specific physical capacities (speed and strength), French trainers utilize more intense type of exercises – that is, parcours and interval exercises. Interestingly, although the parcours induced higher mean responses than interval exercises during the exercise phase, they induced similar responses regarding peak results of HR, VO2, VCO2 and [La−]. This underlines the physiological effect of continuous v. intermittent exercises. In fact, it is well documented in humans that intermittent exercise can result in greater volume of exercise compared with continuous exercise (Wilmore et al., Reference Wilmore, Costill and Kenney2009). This greater volume is possible only if the mean intensity of the exercise phase is reduced (by interspersed periods of low intensity between high intense short bouts). In our testing situation, the mean intensity of exercise interval was 50% of v500 (i.e. mean of 79% of v500 for high bouts and 20% of v500 for slow bouts). Our results confirmed that interval exercise allows increasing the volume of exercise and also the total time duration spent at high physiological responses, certifying the great interest of discontinuous exercise in training.
According to our VO2 measurements, the exercise phases conducted at various intensities (3.9 to 8.7 m/s) induced EE between 0.49±0.11 and 1.79±0.43 kJ/min per kg BW. The estimation of EE at exercise appeared dependent to the contribution of the energy systems – that is, the aerobic and anaerobic contributions to the total EE. If the aerobic component of energy production can be readily calculated from the VO2 values during exercises, the absence of a method universally accepted for the measurement of the anaerobic metabolism during exercise, especially in non-laboratory tests, is still an unsolved problem. Different methods emerged from human application, such as the energy equivalent to lactate concentration (di Prampero and Ferretti, Reference di Prampero and Ferretti1999). In the equine exercise physiology, although blood lactate energy equivalent for horses does not exist, it is used as an indicator of released anaerobic energy (Pösö et al., Reference Pösö, Essen-Gustavsson and Persson1993; Gottlieb-Vedi et al., Reference Gottlieb-Vedi, Persson, Erickson and Korbutiak1995; Eaton et al., Reference Eaton, Hodgson, Evans and Rose1999). In our study, blood lactate levels measured after the exercises indicated lower anaerobic lactic contributions during promenade and jogging situations. Concerning parcours and interval situations, the [La−] values post the exercise phase were 5.3±5.1 and 6.0±5.3 mmol/l, respectively, which were relatively low compared with the highest values reported in race horses (~24 mmol/l for Standardbred horses; Pösö et al., Reference Pösö, Lampinen and Räsänen1995). Moreover, as reported by Eaton (Reference Eaton1994), races from 1600 to 2400 m in trotters induced a predominately aerobic contribution to the total energy, estimated to be ~80% to 85%, and the rest (15% to 20%) was released by anaerobic pathways. Tyler et al. (Reference Tyler, Hodgson and Rose1996) confirmed this finding and indicated that the aerobic contribution to total energy requirement in trained Standardbred horses was 72% during sprint exercise (performed at 115% of VO2max). As our exercises were submaximal, we hypothesized that the aerobic metabolism was dominant during the four testing situations, whereas a possible underestimation of the total EE (aerobic and anaerobic contributions) was suspected for parcours and interval situations. Indeed, although this underestimation could reach ~20% for interval and parcours situations, our EE results were consistent with previous research. Meixner et al. (Reference Meixner, Hörnicke and Ehrlein1981) estimated EE values that varied from 0.8 to 2.6 kJ/min per kg BW during exercise completed at various intensities (from 3.3 to 8.3 m/s) at trot for horses ridden, carrying a 100 kg load. Moreover, Pagan and Hintz (Reference Pagan and Hintz1986) concluded similar results, which varied from 0.8 to 1.9 kJ/min per kg BW at various gaits in horses ridden by a 50-kg rider. In Standardbred trotters pulling a sulky and a driver (80 kg), Martin-Rosset (Reference Martin-Rosset2012) estimated an EE value from 1.0 to 2.3 kJ/min per kg BW for exercises undertaken at 5.0 and 8.3 m/s, respectively, from an equation that permitted an estimation of oxygen consumption, previously established by Gottlieb-Vedi et al. (Reference Gottlieb-Vedi, Essen-Gustavsonn and Persson1991), and estimated anaerobic contribution.
Moreover, to assess EE during exercise, we investigated the different phases that composed each testing situation. In our warm-up conditions – that is, only one heat – the warm-up contributes to 43.6±5.6% and 33.3±3.3% to the EETOTAL for parcours and interval situations, respectively, which represented ~6000 kJ. However, in practice, 50% of trainers undertook either one or two heats (Fortier et al., Reference Fortier, Julliand, Harris and Goachet2014), which represented supplementary EE and impacted the energy contribution during the subsequent exercise phase. In horses, it was indicated that the warm-up increased the aerobic energy contribution to total EE (McCutcheon et al., Reference McCutcheon, Geor and Hinchcliff1999) due to the much faster rate of increase in VO2 at the beginning of the exercise phase (Tyler et al., Reference Tyler, Hodgson and Rose1996). Moreover, the recovery phase also added supplementary EE, representing about 21.4±6.3% and 16.5±2.5% to the EETOTAL of parcours and interval situations, respectively. Interestingly, the EE observed during the recovery phases was similar during the two exercises, which is in agreement with Langsetmo and Poole (Reference Langsetmo and Poole1999), who indicated that the post-exercise oxygen uptake was independent of the preceding exercise intensity. However, as the recovery phase of exercise is often transient and minimal, the physiological recovery could last several hours after exercise (Bompa and Haff, Reference Bompa and Haff2009). This is why it could be of interest to investigate VO2 and EE during the complete warm-up phase and over a longer period post exercise in order to determine the EE in exercising horses.
In conclusion, although yielding different cardiorespiratory responses, the promenade, jogging and parcours situations induced the same EE when expressed in kJ. Although trainers often considered only parcours and interval situations as ‘real work’ (Fortier et al., Reference Fortier, Julliand, Harris and Goachet2014), it seems that in terms of energy the promenade and jogging situations also represent an important component, confirming that the combinations of intensity and volume of exercise and its different phases are fundamental for the assessment of EE.
The data obtained in the present study established the first estimations of weekly and daily amounts of aerobic energy induced by physical activity in trotters, according to the weekly frequency of exercises reported previously (Fortier et al., Reference Fortier, Julliand, Harris and Goachet2014).
Although they should be considered with caution, given the small number of horses tested, our results are the first to provide figures of the amount of aerobic energy utilized during training, ~80 400 kJ/week or 11 500 kJ/day. Further investigation is necessary to confirm our data using more horses for estimating the anaerobic energy contribution, as well as the energy from additional physical activities (such as treadmill exercises, horse walker sessions or races). Despite these limitations, our estimations of energy cost related to physical activity should be added to the maintenance requirements to determine the daily energy requirements of exercising horses. This indeed contributes to assess energy balance in the nutrition of trotters.
Acknowledgements
This study was supported by Institut National de la Recherche Agronomique (INRA) Department Physiologie Animale et Systèmes d’Elevage (PHASE), the Burgundy Region and AgroSup Dijon. Authors acknowledge the trainers of horses and the staff of Unité de Recherche sur les ANImaux de l’Elevage (URANIE) for their active participation.
Supplementary materials
For supplementary materials referred to in this article, please visit http://dx.doi.org/10.1017/S1751731114003139