Implications
The relationship between immunity and growth traits is interesting in pig breeding programs because it appears that improvement in growth traits often compromises immune performance. With genomic data of Meishan and three European pig breeds, we identified putative genetic loci that were related to immunity and growth and also defined some loci that might play different directional roles in growth and immune traits. The results of this study may help breeders design balanced plans for breeding, and the methods can be generalized to explore the relationships between other traits.
Introduction
Growth traits such as average daily gain and BW have been improved because of the development of breeding technology for commercial needs. However, for immune traits, little genetic progress has been made, which is mainly due to the following reasons: ignorance of the improvement in disease-resistance traits, the complexity of these traits and the identification of having not enough trait-specific genes or pathways (Zhao et al., Reference Zhao, Zhu and Chen2012). Rauw had reviewed that the new breeding technology could improve economic production efficiency as well as result in immunological problems (Rauw et al., Reference Reiner, Fischer, Hepp, Berge, Kohler and Willems1998). This type of trade-off exists in European pigs and Meishan pigs. European pig breeds often perform better than Meishan pigs in terms of growth traits (Müller et al., Reference Müller, Moser, Bartenschilager and Geldermann2000), but Meishan pigs perform better than European pigs in terms of immune traits – for example, Meishan pigs have higher neutrophil and monocyte counts than Large White pigs (Clapperton et al., Reference Clapperton, Bishop and Glass2005). This phenomenon suggests that making a balanced selection plan for the two traits is important for breeders.
However, before a balanced selection plan can be developed, the genetic background of the relationship between the two trait complexes should be explored. Genetic relationships among multiple traits often result from pleiotropy of a gene and linkage disequilibrium (LD) between the genes for the different traits (Bolormaa et al., Reference Bolormaa, Pryce, Reverter, Zhang, Barendse, Kemper, Tier, Savin, Hayes and Goddard2014). The former is known as biological pleiotropy, whereas the latter is a type of spurious pleiotropy (Solovieff et al., Reference Upton2013). In this study, we investigated the genetic background of relationships between immunity and growth not only from the view of biological pleiotropy and spurious pleiotropy but also with the idea that genes that are involved in the same pathway could interact with one another, which can be regarded as another type of pleiotropy – namely, mediated pleiotropy (as reviewed by Solovieff et al., Reference Upton2013).
In this study, we conducted our research via the exploration of quantitative trait loci (QTL) overlapping intervals. With more and more QTLs having been integrated, a QTL database (Hu et al., Reference Kanehisa and Goto2013) can be a potential resource for studying the genetic mechanisms that underlie growth and immune traits. Until now, there are more than 500 growth-related QTLs and ~300 immunity-related QTLs in the pig QTL database. Moreover, many overlaps formed by these growth-related and immunity-related QTLs have inspired us to mine the information of the QTL database in order to study the genetic relationships between them. QTL intervals, however, often involve too many candidate genes to find the true causal genes. Therefore, effective annotation methods are needed to further identify and validate pleiotropic genes and gene sets in the overlapping intervals of growth-related and immunity-related QTLs. The objective of this study was to explore the relationship between growth and immunity traits from the view of QTL overlapping intervals.
Material and methods
Bioinformatics pipeline for the identification of pleiotropic genes and gene sets
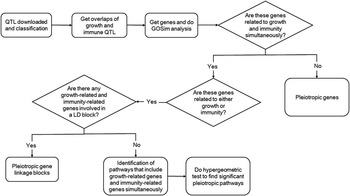
The general pipeline for the identification of pleiotropic gene sets is shown in Figure 1. The details are described as follows.
The pipeline flow chart for the identification of the three pleiotropic gene sets. QTLs=quantitative trait loci; LD=linkage disequilibrium.

QTL data collection and pre-processing
Growth-related and immunity-related QTLs were extracted from the pig QTL database (http://www.animalgenome.org/cgi-bin/QTLdb/SS/index). A Perl script was used to find overlaps of the two types of QTLs. Some overlapping intervals could also overlap with each other, and therefore we merged them into several intervals that have no adjoining region between non-redundant intervals. The genes involved in these overlaps and their Gene Ontology (GO) annotation were retrieved using the BiomaRt package (Durinck et al., Reference Durinck, Moreau, Kasprzyk, Davis, De Moor, Brazma and Huber2005).
Identification of pleiotropic genes
GOSim (Fröhlich et al., Reference Galina-Pantoja, Mellencamp, Bastiaansen, Cabrera, Solano-Aguilar and Lunney2007), which allows calculating the semantic similarity between GO terms, was used to investigate whether the genes identified by previous steps are related to growth, immunity or both. First, we obtained the exact concepts ‘growth’ and ‘development’ that correspond to ‘growth’ and many immune processes corresponding to ‘immunity’ using MeSH database (Lowe and Barnett, Reference Mao, Cai, Olyarchuk and Wei1994). We then selected GO terms ‘development process,’ ‘growth’ and ‘immune system process’ as the ‘model’ terms, and the semantic similarity between these genes’ GO terms and ‘model’ terms were evaluated by GOSim. As a result, whether a gene has a relation to growth, immunity, both or neither can be determined. The genes with both growth and immunity function were regarded as pleiotropic genes. The relative importance of these pleiotropic genes was evaluated to classify them into three levels. The genes of the first level are related to ‘development,’ ‘growth’ and ‘immunity’ simultaneously. Less important genes are related to ‘growth’ and ‘immunity,’ and those that belong to the third level are genes related to ‘development’ and ‘immunity.’
Identification of pleiotropic linkage gene blocks
To further explore the information of the genes involved in the overlaps, we took the extent of LD between these genes into consideration. If the growth-related genes and immunity-related genes defined in the previous step are both in an LD region, the region can be considered to be a pleiotropic block with growth and immune function. LD with average
 $$r_{{0.3}}^{2} $$
values, which is known as useful LD (Aerts et al., Reference Aerts, Megens, Veenendaal, Ovcharenko, Crooijmans, Gordon, Stubbs and Groenen2006), is ~100 kb for Western pigs and 10 kb for Chinese pigs (Ai et al., Reference Ai, Fang, Yang, Huang, Chen, Mao, Zhang, Zhang, Cui and He2013 and Reference Ai, Huang and Ren2015), and thus the length of the LD was set conservatively as 10 kb in this study.
Identification of pleiotropic pathways
In addition to pleiotropic genes and pleiotropic gene linkage blocks, pathways can also be regarded as gene sets that include growth-related genes and immunity-related genes simultaneously. In the first step, genes involved in pig pathways were obtained using KEGG’s API (Kyoto Encyclopedia of Genes and Genomes’ application programming interface; Kanehisa and Goto, 2000), and subsequently they were filtered according to three criteria: (1) genes that cannot be mapped to overlaps that are formed by growth-related and immunity-related QTLs; (2) genes that are pleiotropic genes related to growth and immunity; and (3) genes that are in the same LD regions, which were defined in the previous step. Finally, we undertook a statistical step to identify enriched pathways from all the pathways that contain the remaining growth-related and immunity-related genes simultaneously. For each pathway, we calculated the P-value using a hypergeometric test (Mao et al., Reference Rauw, Kanis, Noordhuizen-Stassen and Grommers2005): (1) if there are N background genes that are involved in all of the pig pathways, and among them there are n growth-related and immunity-related QTL genes, and (2) if there are m genes that can be mapped to a certain pathway and this pathway includes M genes in total, then the P-value for this certain pathway can be calculated as follows:
 $$P={\equals}1{\minus}\mathop{\sum}\limits_{i={\equals}0}^{m{\minus}1} {{{\left( {\matrix{ M \cr i \cr } } \right)\left( {\matrix{ {N{\minus}M} \cr {n{\minus}i} \cr } } \right)} \over {\left( {\matrix{ N \cr n \cr } } \right)}}} $$
We adjusted the P-value by ‘BH’ method in R (Benjamini and Hochberg, Reference Benjamini and Hochberg1995) and set 0.05 to be the default cut-off.
Identification of pleiotropic single nucleotide polymorphisms (SNPs) in Meishan and European pigs
This step was designed to investigate the real genetic variants located in these pleiotropic genes identified by previous steps. Sequencing data from 284 individuals (parts of these data were published by Wang et al., Reference Wang, Chen, Yang, Liao, Zhao, Zhang, Chen, Zhang, Xue and Yang2015) that belonged to four swine breeds (161 Chinese Meishan, 49 Duroc, 37 Landrace and 37 Yorkshire pigs) were used to identify pleiotropic SNPs in Meishan and European pigs. The DNA samples were sequenced and genotyped using the genotyping by genome reducing and sequencing protocol (http://klab.sjtu.edu.cn/GGRS/) (Chen et al., Reference Chen, Ma, Yang, Chen, Liao, Xie, Wang, He, Tu and Zhang2013). A quality control test was performed based on the criterion that minor allele frequency should be >0.01.
SNPs that passed the quality control test were mapped to the following: (1) pleiotropic gene sets (pleiotropic genes, pleiotropic linkage blocks and genes involved in significant pathways) to obtain pleiotropic SNPs; and to (2) genes only related growth or immunity to obtain only growth and only immune SNPs. A Fisher’s exact test (Upton, Reference Fröhlich, Speer, Poustka and Beissbarth1992) was performed to identify the SNPs whose allele frequency differed between Meishan and European pigs (false discovery rate (FDR)<0.01). After the test, the significant SNPs involved in all of the growth and immune genes can be regarded as the cause for the difference between Meishan and European pigs for the two traits. However, Chinese and European pigs are so different that there will be frequency differences for most SNPs, and therefore a hypergeometric test using all of the SNPs as a negative control was performed to validate our findings. The test was performed for the following: (1) pleiotropic SNPs; (2) only growth and only immune SNPs; and (3) the aggregate sets of 1 and 2.
Results
Overlaps formed by growth and immunity QTLs
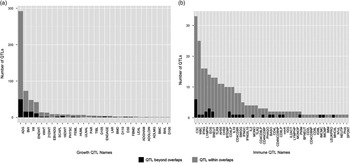
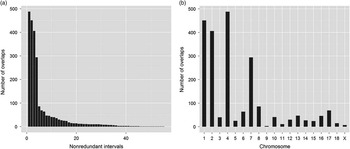
A total of 2414 overlaps formed by 575 growth-related and 262 immunity-related QTLs were identified across the porcine genome. Figure 2 shows whether growth-related and immunity-related QTLs are involved in these overlaps. We found that the number of overlapping QTLs takes up a large portion of the two types of QTLs (79.8% for growth-related QTLs and 88.1% for immunity-related QTLs), which indicates that a relationship between growth and immune traits exists. Furthermore, except for a few traits, most or all of the specific QTLs are included in overlaps. After merging repeated intervals, 55 non-redundant overlapping intervals were finally identified. The distribution of all 2414 overlaps in the non-redundant regions and across the genome is shown in Figure 3. The results of discrete distribution χ 2 test (P<2.0×10⁻¹⁶) indicated that these overlaps were not randomly distributed in non-redundant intervals (Figure 3a).
The distribution of growth quantitative trait loci (QTLs) (a) and immune QTLs (b) within or beyond overlapping intervals. The x-axis represents the QTLs’ abbreviated names and their full names are available in the pig QTL database (http://www.animalgenome.org/cgi-bin/QTLdb/SS/index). The y-axis represents the number of specific QTLs. Different colors stand for different statuses as to whether these QTLs are involved in overlapping intervals (blue) or not (red). As a result, 79.8% of growth-related QTLs and 88.1% of immunity-related QTLs are within overlapping intervals.

The distribution of the number of overlaps included in the non-redundant intervals (a) and genome (b). The x-axis of (a) represents 55 non-redundant intervals. The y-axis of (a) and (b) both represent the number of all of the 2414 overlaps formed by growth-related quantitative trait loci (QTLs) and immunity-related QTLs, located in either non-redundant intervals or chromosomes.

Identification of pleiotropic genes and gene sets
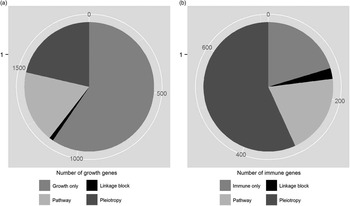
There are 1893 growth-related genes and 713 immunity-related genes identified by GOSim in the overlapping intervals. As shown in Figure 4, 405 pleiotropic genes are shared by the two gene sets. Moreover, there are 19 and 343 growth-related genes involved in pleiotropic LD blocks and pathways, respectively. For immunity-related gene sets, 19 and 144 genes are included in pleiotropic LD blocks and pathways, respectively. The number of all pleiotropic genes involved in pleiotropic gene sets accounts for 40.5% and 79.7% for the size of the growth and immune gene sets, respectively. For the pleiotropic genes, we identified 72 genes in the first level, nine genes in the second level and 324 genes in the third level according to their functional annotation importance. Limited by space, Supplementary Table S1 lists only pleiotropic genes of the first level whose annotation terms have at least one quantified similarity value that is >0.5 between each ‘model’ term; more details are available upon request. Their GO annotation accessions with the maximum quantified similarity value between each ‘model’ term are also listed. The number of genes in the third level is larger than those in the other two levels due to the broader concept of development compared with growth. These 81 pleiotropic genes in the first and second levels are probably more important than those in the third level because ‘growth’ is a more accurate term related to the growth concept than ‘development.’
The classification of growth-related genes (a) and immunity-related genes (b) that we determined. This pie plot illustrates the situations of the number of growth-related genes or immunity-related genes that are distributed in different classes. Except for the ‘growth only’ or ‘immune only’ class, the pleiotropic gene set is composed of genes in the other three classes. Comparing the two pie plots, we can find that pleiotropic genes account for a larger fraction of the immunity-related genes compared with the growth-related genes.

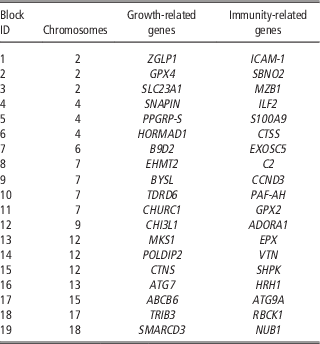
Moreover, 19 pleiotropic gene linkage blocks were identified that involved 38 genes in total (Table 1). The size of pleiotropic gene blocks is not very large because the length of the linkage block was set to a conservative value (10 kb). Growth-related genes in these blocks are all actually annotated by GO terms linked to ‘development;’ therefore, these pleiotropic blocks play roles mainly in development and immunity.
Pleiotropic linkage disequilibrium blocks and the genes involved

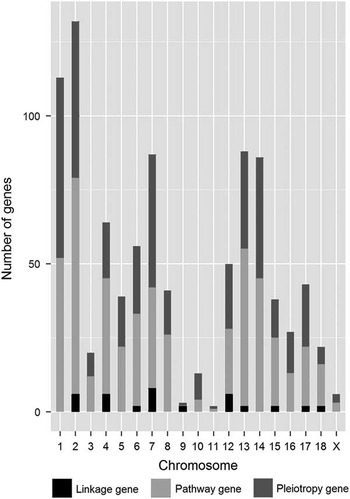
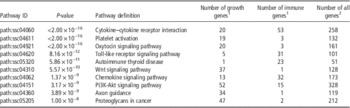
A total of 120 pathways were identified that included growth genes and immune genes simultaneously, and 67 were statistically significant (available upon request). Table 2 lists pleiotropic pathways with P-values of ⩽1.0×10⁻⁸. The distribution of the number of genes that were involved in pleiotropic gene sets in the genome is shown in Figure 5. This distribution does not fully correspond to the distribution of overlaps in the genome (Figure 3b). For example, the number of overlaps in chromosome 12, 13 and 14 are not very large, but a large number of genes are distributed in these chromosomes, which indicate that there are either long intervals for these overlaps or an enrichment of genes in these chromosomes.
Distribution of the number of pleiotropic genes in the genome. The x-axis represents different chromosomes. The y-axis stands for the number of genes in the different pleiotropic gene sets. This figure offers a perspective in terms of the genomes to view the distribution of pleiotropic genes.

Pleiotropic pathways with P-value⩽1.00×10⁻⁸ and the number of genes involved

1 The number of growth-related or immunity-related genes that we identified to be involved in the pathway.
2 The number of all the genes that are involved in the pathway.
Pleiotropic gene sets in Meishan and European pigs
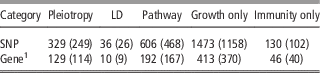
A total of 72 542 SNPs passed the quality control test, among which 53 584 SNPs showed a statistically significant difference between Meishan and European pigs in terms of allele frequencies by Fisher’s exact test (FDR<0.01). A total of 971 high-confidence SNPs could be mapped to pleiotropic gene sets, and among them 743 SNPs were statistically significant. A total of 1603 SNPs were included in genes that were related to only growth and related to only immunity, among which 1260 SNPs were statistically significant.
The hypergeometric test results show that the pleiotropic SNPs (P=0.031), only growth and only immune SNPs (P=4.88×10⁻⁶) and their aggregate sets (P=1.32×10⁻⁶), are all statistically significant. Table 3 lists the summary of these results, and more detailed information is available on request.
The number of single nucleotide polymorphisms (SNPs) and genes or linkage disequilibrium (LD) blocks that are involved in each gene set

The number of significant ones is shown in parenthesis.
1 The number of ‘genes’ for ‘LD’ is actually the count of LD blocks.
Discussion
The relationship between the immune trait and growth trait has been suggested by evidence not only from the standpoint of physiology (Klasing, Reference Klein and Nikolaidis1988; Borghetti et al., Reference Borghetti, De Angelis, Saleri, Cavalli, Cacchioli, Corradi, Mocchegiani and Martelli2006; Galina-Pantoja et al., Reference Hu, Park, Wu and Reecy2006) but also from the viewpoint of genetics (van der Most et al., Reference van der Most, de Jong, Parmentier and Verhulst2011). Moreover, the heritability of some immune traits and genetic relationships that are associated with average daily gain was evaluated under different environments (Clapperton et al., Reference Clapperton, Diack, Matika, Glass, Gladney, Mellencamp, Hoste and Bishop2009). Therefore, in this study, we considered the fact that a relationship between immunity and growth as a starting point exists, and we defined pleiotropic genes and gene sets in relation to immunity and growth from the pig QTL database and mapped real sequencing data to them to demonstrate our findings on Meishan and European pigs.
QTL is a type of statistical association between genetic variation and a trait. QTL intervals are often very large that real causal variants may be obscured among many genes. However, the annotation method enabled us to downsize the long intervals and improve the confidence of the genes that we identified. The number of overlapping QTLs accounts for a higher portion of immune QTLs than growth QTLs (Figure 2a and b), which most likely indicates that a correlation between the two traits has a larger effect on immunity than on growth. This phenomenon was proven in poultry – for example, by means of meta-analysis, van der Most et al. (Reference van der Most, de Jong, Parmentier and Verhulst2011) found that the selection for growth traits in poultry indeed compromised the immune function, but the selection for immunity traits did not consistently affect the growth traits.
GOSim can quantify the relationship between two GO terms, which allows us to evaluate the genes’ functions. Growth is the enlargement of a tissue or organism and is a narrower biological concept than development. Thus, we regarded the pleiotropic genes in the first and second levels to be more important than those in the third level. As a result, the 81 pleiotropic genes in the first and second levels that were identified in our present study are most likely more important genes. The result of GO annotation can also help us understand the functional direction of the pleiotropic genes or blocks. If a pleiotropic gene or linkage gene block has a positive function of growth and a negative function of immunity and vice versa, a selection of that gene must occur cautiously. Although we cannot find these genes or gene blocks directly as a result of a lack of expression profile data or quantified research, we can resort to GO annotation and publications to find some clues – for example, the pleiotropic gene TNFAIP3 that we defined in the third level has the GO terms ‘negative regulation of B cell activation’ and ‘negative regulation of innate immune response,’ but it has been proven to be a stimulus of cell growth, especially in cancer cells (Vereecke et al., Reference Vereecke, Beyaert and van Loo2009). In addition, the gene HIF1A (Supplementary Table S1) is annotated as ‘negative regulation of growth,’ but this gene actually improves the immune capacity by activating embryonic hematopoiesis (Adelman et al., Reference Adelman, Maltepe and Simon1999). There are some pleiotropic genes that have the same functional direction as well – for example, the pleiotropic gene SIX1 (Supplementary Table S1) plays a positive role in many organs’ development, including the thymus, which is very important for immune capacity (Klein and Nikolaidis, Reference Le, Zhou, Iribarren and Wang2005), and the gene DAB2IP, which we defined in the third level with the GO term ‘negative regulation of toll-like receptor 4 signaling pathway,’ can also decrease the development speed of hepatocellular carcinoma (Zhang et al., Reference Zhang, Li, Li, Zhao, Qiao, Liang and Ding2012). For pleiotropic genes with the same functional direction, such as SIX1 and DAB2IP, it is much easier than genes that have different functional directions for breeding programs because the functional directions of the concerned traits are not incompatible.
In the linkage analysis, the LD threshold was set at 10 kb. In fact, the standards for determining whether genes are in a LD region are dependent on many conditions. Even so, some regulations had been found in which the difference of the extent of LD between the European and Chinese pig breeds extending up to 400 kb in Europe and ~10 kb in China (Amaral et al., Reference Amaral, Megens, Crooijmans, Heuven and Groenen2008). Ai et al. (Reference Ai, Fang, Yang, Huang, Chen, Mao, Zhang, Zhang, Cui and He2013 and Reference Ai, Huang and Ren2015) also reported that LD with average
 $$r_{{0.3}}^{2} $$
values is ~100 kb for Western pigs and 10 kb for Chinese pigs (Ai et al., Reference Ai, Fang, Yang, Huang, Chen, Mao, Zhang, Zhang, Cui and He2013 and Reference Ai, Huang and Ren2015). We should note that many QTL mapping designs used families that were developed by crossing European Wild Boar with a commercial breed or crossing the Chinese Meishan breed with a commercial breed (Rothschild et al., Reference Solovieff, Cotsapas, Lee, Purcell and Smoller2007). For example, an overlap could be formed by a growth-related QTL identified in a family generated by cross-breeding of Duroc and Pietrain (Liu et al., Reference Lowe and Barnett2007) and an immunity-related QTL in a family generated by cross-breeding of Pietrain and Meishan (Reiner et al., Reference Rothschild, Hu and Jiang2008). Therefore, to decrease false-positive findings, we set the threshold to be a conservative value – 10 kb.
Pathway annotation is to discover pleiotropic genes in a biological function set. From another perspective, pathways with growth-related genes and immunity-related genes that are enriched could also be pleiotropic. In the present study, 67 pathways that were statistically significant were identified, and several of them have been proven by other researchers. For example, ‘Chemokine signaling pathway (path:ssc04062)’ (Table 2) was discovered to be a mediator of immunity (Le et al., Reference Liu, Jennen, Tholen, Juengst, Kleinwachter, Holker, Tesfaye, Un, Schreinemachers, Murani, Ponsuksili, Kim, Schellander and Wimmers2004) and has also been proven to be related to cell growth and differentiation (Wong and Fish, Reference Wong and Fish2003). A similar situation has also been found in the most significant pathway – ‘Cytokine–cytokine receptor interaction (path:ssc04060)’ (Deverman and Patterson, Reference Deverman and Patterson2009). Some of these are concerned with cancer, such as ‘Pathways in cancer (path:ssc05200)’ (Table 2). The reason is that some immune processes or cytokines play roles in cancer regulation, and the growth of functional biological molecules can also play an important part in tumor growth, such as with ‘Proteoglycans in cancer (path:ssc05205).’ Furthermore, the significant pathway ‘Jak-STAT signaling pathway (path:ssc04630)’ plays an important role in growth and immunity because many cytokines and growth factors mediate their effects via activation of this pathway (Wong and Fish, Reference Wong and Fish2003).
The difference in the immune and growth traits between Meishan and European pig breeds might be caused by the statistically significant differences in genetic variants, which can be mapped to immunity-related genes and growth-related genes. These genes include pleiotropic genes, pleiotropic gene sets and genes that are linked to either growth or immunity. One of the causes of differences is that breeders in developed countries pay attention to improving production traits and care less about immune traits. Therefore, if an SNP is included in the pleiotropic gene sets and its allele frequency differs between Meishan and European pigs, then the reason could be that its advantageous allele frequencies for growth traits are improving in the European pig population and its advantageous allele frequency for immune traits are retained in the Chinese Meishan pig population. In other words, these pleiotropic SNPs are putative contradictive loci that play an opposite directional role in growth and immunity traits. The directional role of these pleiotropic SNPs on immune and growth traits must also be further validated based on large sample sizes and phenotypic data; therefore, a breeding program for these significant pleiotropic SNPs should be more careful than considering only significantly different SNPs that are included in genes that are related to either growth or immunity.
In conclusion, this study provides the viewpoint of overlapping growth and immune QTLs to understand the relationship between growth and immunity traits of pigs. With many pleiotropic genes and gene sets having been identified, the pleiotropic polymorphisms could also be determined. Pig breeders might design a balanced breeding program by making full use of the polymorphisms of pleiotropic genes, LD blocks and pathways. The method used in this study might be generalized to explore the relationships between other traits in the initial steps, especially when there is a lack of phenotypic or expression profile data.
Acknowledgments
This work was supported by the National Natural Science Foundation of China (No. 31472069, 31370043, U1402266), National Key Technology Support Program (2012BAD12B08), Shanghai agriculture science and technology project (2012(2-3)) and Shanghai Jiao Tong University Agri-X fund to YCP.
Supplementary material
For supplementary material/s referred to in this article, please visit http://dx.doi.org/10.1017/S1751731115002761