
 λ



1. Motivation: Cosmic Reionization
The transition from the neutral intergalactic medium (IGM) after the universe recombined at redshift  $z \sim1100$ to the ionized IGM observed today is termed Cosmic Reionization (Robertson et al. (Reference Robertson, Ellis and Dunlop2010)). The ionization of hydrogen in the IGM requires sustained sources of Lyman continuum photons. If galaxies are responsible, the photon requirement can be expressed as
 \begin{equation} \frac{dn_{ion}}{dt} = \rho_{SFR} \times \zeta_Q \times f_{esc}, \end{equation}
where  $\rho_{SFR}$,
 $\zeta_Q$, and
 $f_{esc}$ are the co-moving star-formation rate density, the photon production rate, and the photon escape fraction, respectively. While
 $\rho_{SFR}$ can be constrained out to
 $z \approx 10$ and beyond (Robertson et al. (Reference Robertson, Johnson and Tacchella2024)), determining
 $\zeta_Q$ at such redshifts is challenging even with JWST. Furthermore, the intrinsic galactic Lyman continuum escape fraction
 $f_{esc}$ becomes inaccessible beyond
 $z \sim5$ due the increasing IGM opacity along the sightlines. The physical conditions in EoR galaxies are mirrored in some galaxies found locally. These are coined local analogues and are the focus of this contribution. By studying local analogues we learn about their physical processes and we hope to extrapolate those to the EoR.
2. Pox 186 and UM 461 as Close Local Analogues
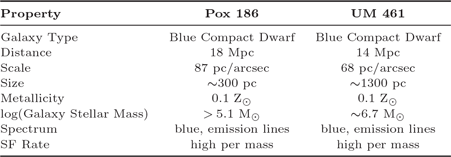
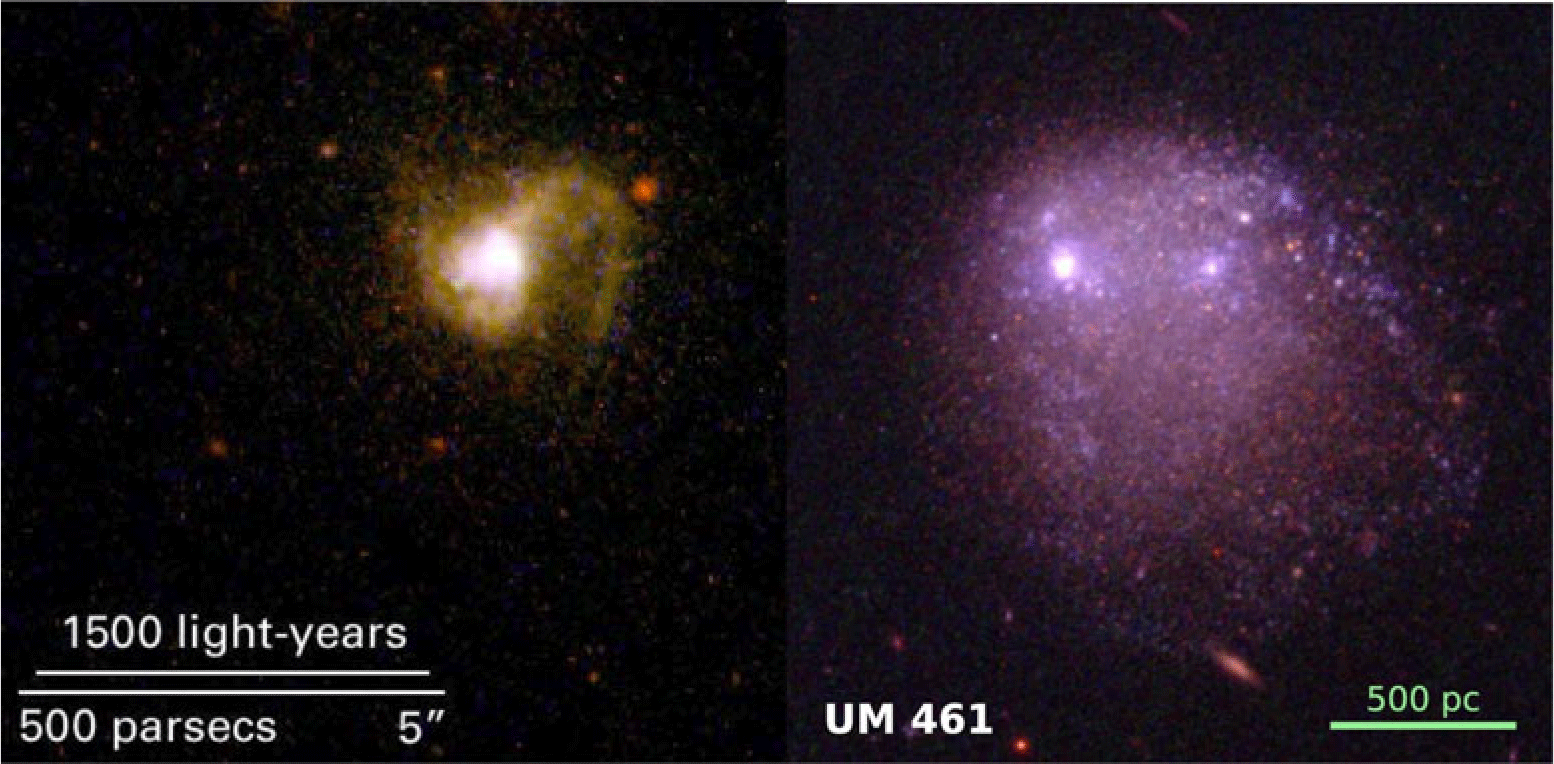
Pox 186 and UM 461 are two nearby blue compact dwarf galaxies whose main properties are summarized in Table 1. See Kumari et al. (Reference Kumari, Smit and Leitherer2024) and Elmegreen et al. (Reference Elmegreen, Elmegreen and Gallagher2022) and references therein for more details. Notably, the two galaxies have small linear sizes and low stellar masses. Both host one or two central star clusters whose radiative and mechanical energy output dominate that of the host galaxies. Throughout this contribution, our results refer to these clusters, not to those of the host galaxies. HST images of both galaxies are reproduced in Figure 1.
Main properties of Pox 186 and UM 461.

Table 1 Long description
A table comparing properties of two blue compact dwarf galaxies, Pox 186 and UM 461. The table has 6 rows and 2 columns. Row 1: Property, Pox 186, UM 461. Row 2: Galaxy Type, Blue Compact Dwarf, Blue Compact Dwarf. Row 3: Distance, 18 Mpc, 14 Mpc. Row 4: Scale, 87 pc/arcsec, 68 pc/arcsec. Row 5: Size, greater than 300 pc, approximately 1300 pc. Row 6: Metallicity, 0.1 Z sun, 0.1 Z sun. Row 7: log(Galaxy Stellar Mass), greater than 5.1 M sun, approximately 6.7 M sun. Row 8: Spectrum, blue, emission lines, blue, emission lines. Row 9: SF Rate, high per mass, high per mass.
HST images of Pox 186 and UM 461. Left: Pox 186 – HST/WFPC2 U+V+I (Corbin & Vacca (Reference Corbin and Vacca2002); right: UM 461 – HST/WFC3+ACS U+V+I (Reference Elmegreen, Elmegreen and GallagherElmegreen et al. (2022)).

3. Modeling the Stellar Population
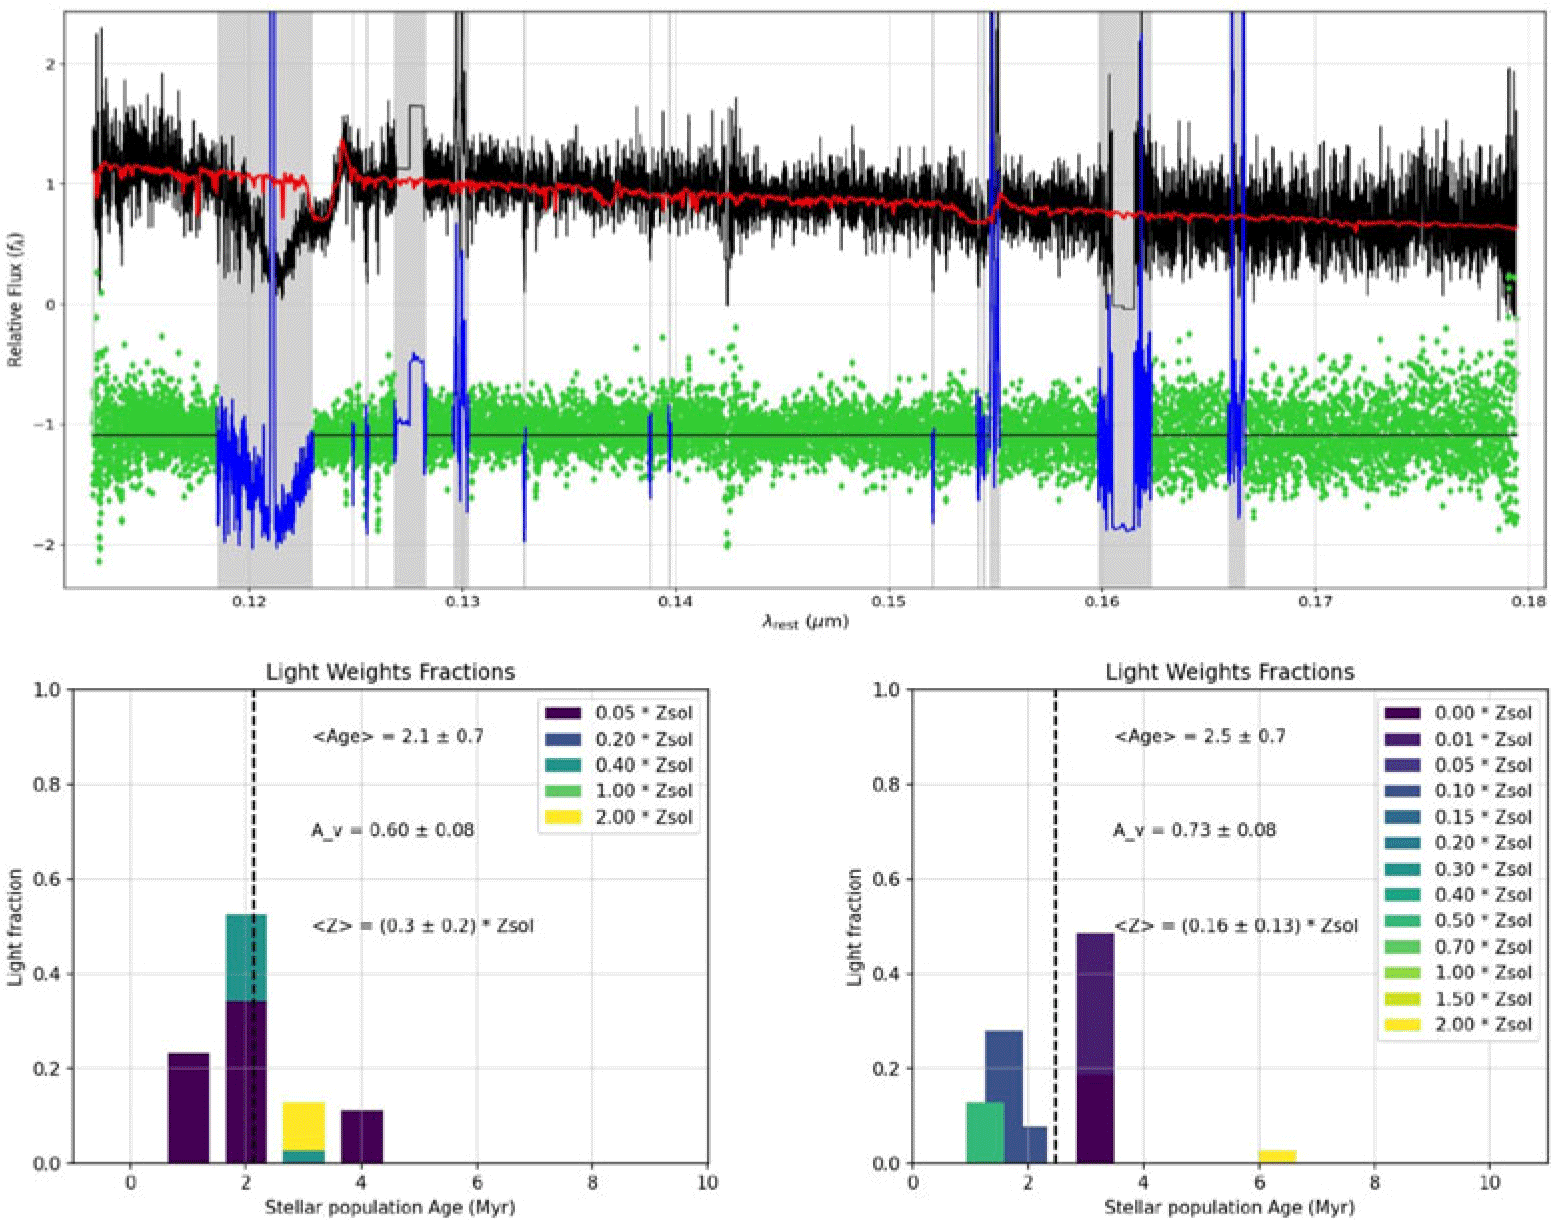
We used the software package GalSpecFitX by Rivera et al. (Reference Rivera, Kumari and Leitherer2025) for determining ages, metallicities and dust attenuation from the UV spectrum of the cluster. The models are built on a library of individual single stellar populations with a range of ages, metallicities, and reddening, which are then combined to derive the preferred average values from the spectral fit. Figure 2 shows an example for Pox 186. In order to study the effects of single-star versus binary evolution, we performed the fitting both with Starburst99 (Reference Leitherer, Ekström and MeynetLeitherer et al. (2014)), a single-star synthesis code, and BPASS (Eldridge et al. (Reference Eldridge, Stanway and Xiao2017)), which incorporates binary evolution. The best fits suggest a young age of 2 – 3 Myr, a relative high dust reddening of  $A_V = 0.6 - 0.7$ mag, and a metallicity of
 $\sim0.2$ Z
 $_\odot$. Note that metallicity should be understood as Fe abundance, as it is predominantly derived from the continuum line-blanketing. There is no significant difference between the results from Starburst99 without rotation and BPASS, as expected for a very young population, in which binary interactions are not yet important.
Top: fit to the HST/COS FUV spectrum of Pox 186. Black: observed spectrum. The masked regions excluded from the spectral fitting are shown in grey and blue. The best-fit (red) is derived using single-star Starburst99 spectral synthesis models. Green: error spectrum. Bottom: contribution of each individual burst to the best fit. Each panel displays the best-fit light-weighted stellar age, metallicity, and dust attenuation. The vertical dashed line marks the average stellar age. Left panel: results from Starburst99. Right panel: results from BPASS.

As a complementary method, we determined the ages of the dominating clusters in Pox 186 and UM 461 from the equivalent width (EW) of the nebular H $\beta$ emission line, which is commonly used as chronometer in star clusters located in H II regions. We measured EW(H
 $\beta$)
 $\approx 300$ Å in both clusters. Comparison with pyStarburst99 without rotation (Reference Hawcroft, Leitherer and AranguréHawcroft et al. (2025)) suggests ages of about 3 Myr, in agreement with the stellar-population ages.
4. Nebular Diagnostics
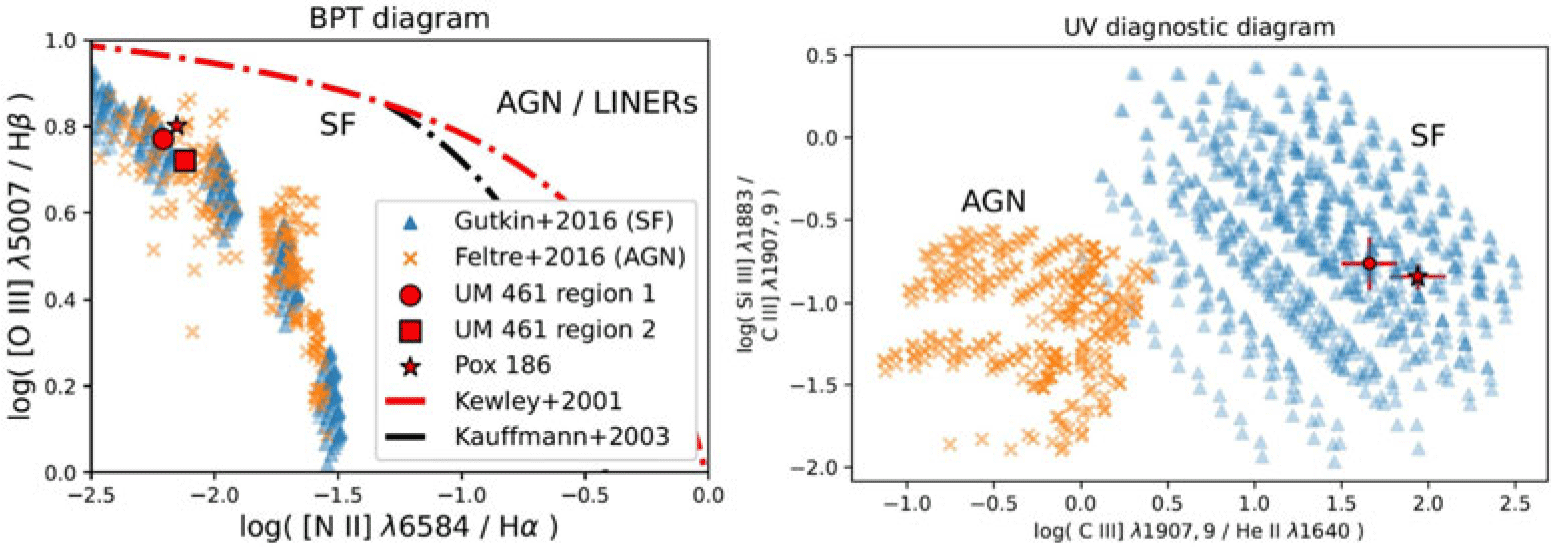
Newly obtained and publicly available archival UV-to-optical spectroscopy has been compared to a suite of photo-ionization models for star-forming galaxies by Gutkin et al. (Reference Gutkin, Charlot and Bruzual2016) and for AGN by Feltre et al. (Reference Feltre, Charlot and Gutkin2016). The models cover a wide range of metallicities, ionization parameters, stellar ages, initial mass function (IMF) and other relevant properties. In Figure 3 we show diagnostic diagrams for both optical and ultraviolet line ratios. Pox 186 and UM 461 agree with both sets of models for typical cluster properties assuming SMC metallicity. However, the ultraviolet diagram allows us to separate star formation and AGN models. Both Pox 186 and UM 461 are consistent with star formation only.
Left: optical diagnostic diagram showing the ratio of [O III]  $\lambda$5007/H
 $\beta$ versus [N II]
 $\lambda$6584/H
 $\alpha$. The triangles and crosses denote a family of photo-ionization models for star-forming galaxies by Gutkin et al. (Reference Gutkin, Charlot and Bruzual2016) and for AGN by Feltre et al. (Reference Feltre, Charlot and Gutkin2016) that are overlapping. The clusters in Pox 186 and UM 461 are at the locus of both model sets. Right: corresponding UV diagnostic digram for Si III]
 $\lambda$1883/C III
 $\lambda$1908 versus C III]
 $\lambda$1908/He II
 $\lambda$1640. Star-formation and AGN models are well separated, and Pox 186 and UM 461 are in the region of star formation.

Weak nebular He II  $\lambda$4686 emission with an EW of
 $\sim$0.2 Å is detected in both clusters. The models of Gutkin et al. (Reference Gutkin, Charlot and Bruzual2016) can reproduce the emission with a normal IMF extending to masses up to 100 – 300 M
 $_\odot$. Nebular He II is thought to trace the hard ionization field of Wolf-Rayet (WR) stars. Predictions of population synthesis models related to WR stars are notoriously uncertain. Therefore we took an alternative, empirical approach as a consistency check. The required numbers of He
 $^+$ ionizing photons to account for the
 $\lambda$4686 line luminosities in Pox 186 and UM 461 are
 $Q_{\rm HeII} = 2.5 \times 10^{49}$ photons s
 $^{-1}$ and
 $8.4 \times 10^{48}$ photons s
 $^{-1}$, respectively. These numbers correspond to the ionizing fluxes of eight and three WR stars of spectral type WN3h, respectively, which are known to be He
 $^+$ continuum leakers (Reference González-Torà, Sander and EgorovaGonzález-Torà et al. (2025)). This small number of WR stars would not be observable via broad stellar WR lines, consistent with the absence of WR features in both clusters.
Is there evidence of even harder radiation beyond that indicated by nebular He II? Mid-IR spectra of very metal-poor galaxies such as SBS0335-052 E (Reference Mingozzi, Garcia Del Valle-Espinosa and JamesMingozzi et al. (2025)) show significant emission of highly ionized [Ne V]  $\lambda$14.3
 $\mu$m, which requires ionizing photons with energies above 97 eV. A recent JWST/MIRI spectrum obtained by us indicates no signficant detection of this line in Pox 186.
5. Extreme C III]  $\lambda$1908

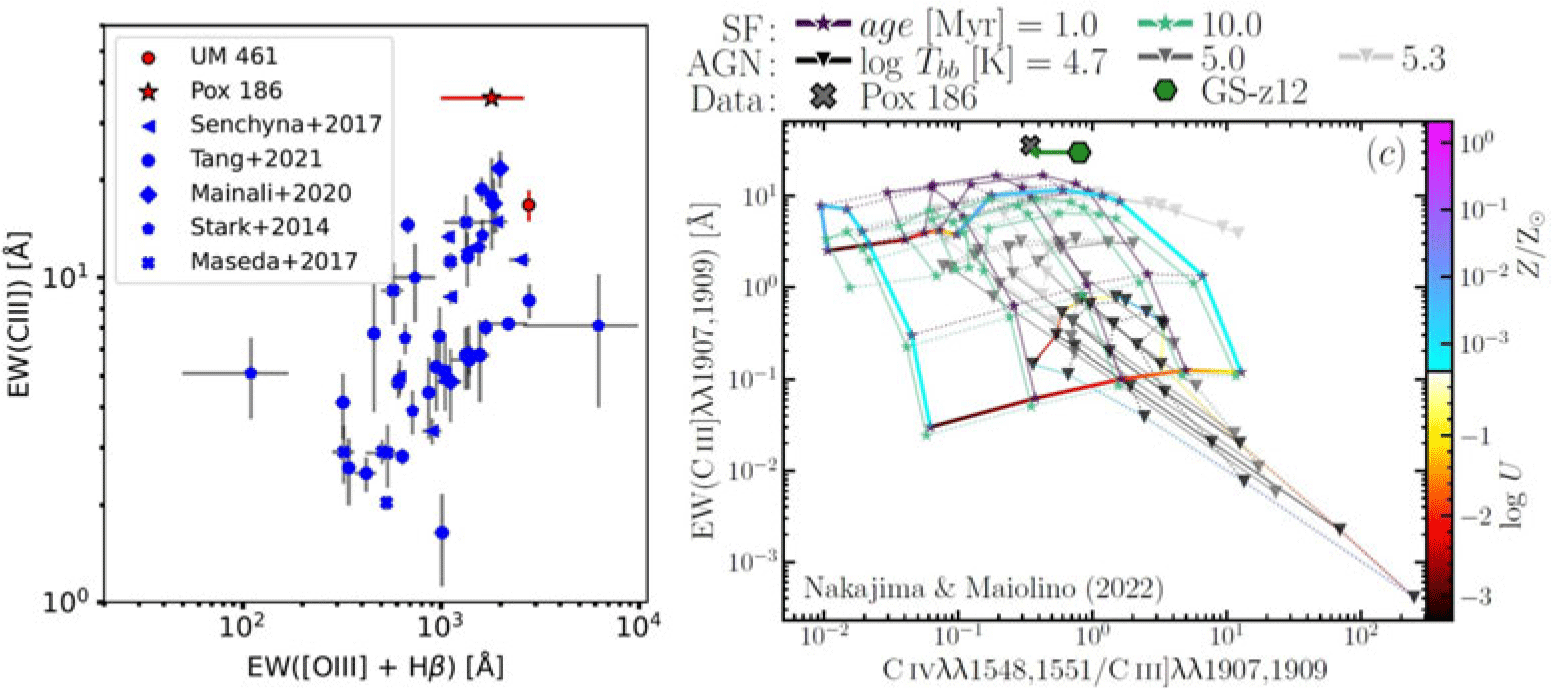
Pox 186 and UM 461 are extraordinary with respect to the measured EW of the C III]  $\lambda$1908 doublet. The two galaxies have some of the largest EW(C III]
 $\lambda$1908) observed at low and high redshift (see left panel of Figure 4). Strong C III]
 $\lambda$1908 lines suggest elevated electron temperatures, harder radiation fields from metal-poor gas and stars, young stellar populations, and high ionization parameters (Stark (Reference Stark2016)). Kumari et al. (Reference Kumari, Smit and Leitherer2024) performed a detailed parameter study of Pox 186 to interpret the high EW of C III]
 $\lambda$1908, as well as C IV
 $\lambda$1549. They studied the effects of the ionizing radiation field, elevated carbon-to-oxygen ratio for a given gas-phase metallicity, parameters of photoionization models, single versus binary stars, a top-heavy IMF, nebular
 $\alpha$/Fe enhancement and in-homogeneous dust distribution. However, the models could not simultaneously reproduce all constraints suggesting shortcomings in our understanding of seemingly simple systems like the massive, compact cluster in Pox 186.
Left: plot of EW(C III]  $\lambda$1908) versus the EW of (C III
 $\lambda$1908 + H
 $\beta$). Pox 186 and UM 461 (red symbols) are compared to a galaxy sample at low and high z. From Kumari et al. (Reference Kumari, Smit and Leitherer2024). Right: Diagnostic diagram for EW(C III]
 $\lambda$1908) versus the ratio of C IV
 $\lambda$1549/C III]
 $\lambda$1908. The grid has been computed with photo-ionization models for a range of metallicities (blue/purple) and ionization parameters (red/yellow). Pox 186 and the high-z galaxy GS-z12 are outside the grid. From D’Eugenio et al. (Reference D’Eugenio, Maiolino and Carniani2024).

D’Eugenio et al. (Reference D’Eugenio, Maiolino and Carniani2024) pointed out some similarities between the  $z \approx 12.5$ galaxy GS-z12, in particular their similar EW(C III]
 $\lambda$1908). The right panel of Figure 4 reproduces a diagnostic diagram including EW(C III]
 $\lambda$1908). Strikingly, both Pox 186 and GS-z12 are located outside an extensive grid of photo-ionization models covering an extreme range of metallicities and ionization parameters. D’Eugenio et al. (Reference D’Eugenio, Maiolino and Carniani2024) suggested an enhanced C/O ratio to mitigate the tension between the models and the data. This interpretation would be in conflict with other constraints provided in Pox 186.
The extreme properties of the star clusters make them excellent candidates for escaping Lyman continuum radiation. Pox 186 and UM 461 are too close for direct measurements. Indirect indicators are inconclusive. As for Pox 186, high values of [O III]  $\lambda$5007/[O II]
 $\lambda$3727 and the far-IR [O III]
 $\lambda$88
 $\mu$m/[C II]
 $\lambda$157
 $\mu$m suggest large
 $f_{\rm esc}$ values. In contrast, C IV
 $\lambda$1549/C III]
 $\lambda$1908 is also below the threshold for Lyman continuum leakers, in agreement with the observed UV continuum slope
 $\beta = -0.36$, which indicates negligible escape as well.
6. Key Points
• Pox 186 and UM 461 host one or two dominating stars clusters. Such simple systems make them ideal cases for testing models and identifying shortcomings.
-
• The clusters have sizes of
$\sim$20 pc and luminosity-derived masses of $10^5 - 10^6$ M$_\odot$. -
• The data suggest a Salpeter-type upper IMF.
-
• The most massive stars have masses of 100 – 300 M
$_\odot$. -
• C/O, N/O, and O/Fe are not enhanced.
-
• Weak nebular He II
$\lambda$1640 and $\lambda$4686 are detected. However, there is no evidence of broad He II due to WR stars. -
• EW(C III]
$\lambda$1908) cannot be reproduced by the models without violating other observational constraints. -
• The Lyman continuum cannot be observed directly.
$f_{\rm esc}$ is inclusive since several indirect indicators are contradictory.


Acknowledgements
Support for this work has been provided by NASA through grant No. AR-17729 from the Space Telescope Science Institute, which is operated by AURA, Inc., under NASA contract NAS 5-26555. Travel support has been provided by the STScI Director’s Discretionary Fund D0001.82413.
 λ
 β
 λ
 α
 λ
 λ
 λ
 λ
 λ
 λ
 β
 λ
 λ
 λ


